Highlights Since April 2026
Takuya Yokota (hereinafter, Yokota): My name is Takuya Yokota, General Manager of the Logistics REIT Department at Mitsubishi Jisho Investment Advisors (MJIA). Thank you very much for joining us today for the financial results briefing for the fiscal period ended August 31, 2026 (the 20th fiscal period) of Mitsubishi Estate Logistics REIT Investment Corporation (MEL). Let me walk you through the financial results presentation materials.
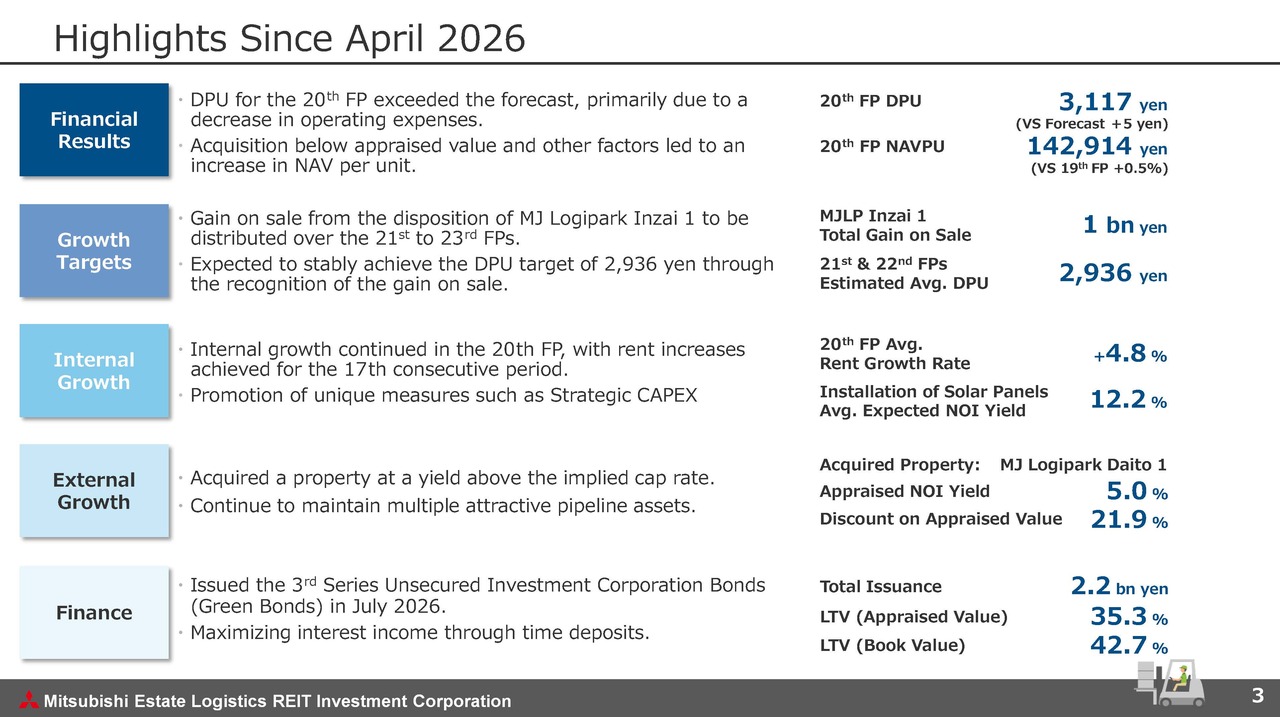
First, I will explain the highlights for the fiscal period, starting with the financial results. In the 20th fiscal period, distributions per unit (DPU) exceeded the initial forecast, primarily due to a decrease in certain operating expenses and the deferral of some payments. In addition, higher appraised values for our existing portfolio and the acquisition of a property below its appraised value helped increase NAV per unit.
Next, let me discuss our growth strategy. As reported at our financial results briefing in April this year, we completed the sale of two properties, MJ Logipark Kazo 1 and MJ Logipark Kazo 2, in March 2026. In addition to these two sales, we decided yesterday to sell MJ Logipark Inzai 1. This sale has put us on track to achieve our near-term DPU target of 2,936 yen.
In terms of internal growth, we have achieved rent increases for 17 consecutive fiscal periods through the 20th fiscal period. Rents rose by 4.8% in the latest period. The solar panels planned for the rooftops of our logistics facilities are scheduled to become fully operational in stages from the 21st fiscal period. We are steadily moving forward with these strategic CAPEX initiatives.
With regard to external growth, we completed the acquisition of MJ Logipark Daito 1 as part of capital recycling following the sale of MJ Logipark Kazo 1 and MJ Logipark Kazo 2.
The property's appraisal NOI yield of 5.0% is attractive compared with yields in the surrounding property transaction market. The acquisition also improves the quality of our portfolio. We will continue to consider acquisitions from our attractive pipeline at the right time.
In terms of finance, we issued our third series of investment corporation bonds in July 2026, our first issuance in three years. With interest rates now positive, we have also stepped up our use of time deposits to make effective use of MEL's surplus cash. We continue to maintain ample LTV headroom and will use it as needed, but we do not anticipate any abrupt changes in our LTV level.
DPU Transition
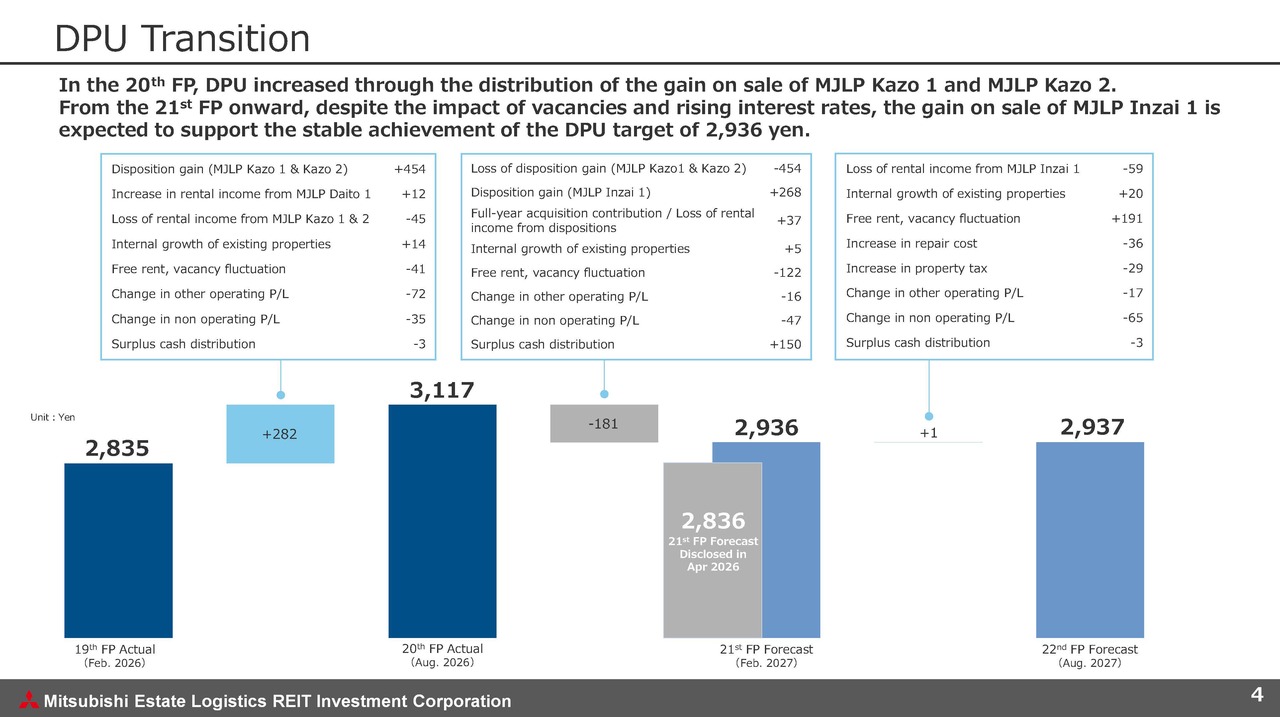
Let me review our DPU results and forecasts. In the 20th fiscal period, we recorded gains on sale of MJ Logipark Kazo 1 and MJ Logipark Kazo 2, while the acquisition of MJ Logipark Daito 1 increased operating revenues. Operating expenses also decreased, partly due to the deferral of leasing fee payments.
As a result, DPU increased by 282 yen compared with the previous fiscal period and exceeded the forecast by 5 yen. We are very likely to pay these deferred operating expenses in the future. We have therefore adjusted surplus cash distributions to retain an equivalent amount within MEL and smooth future cash outflows.
As mentioned at the beginning, the recognition of gains on sale of MJ Logipark Inzai 1 from the 21st fiscal period onward has put us on track to achieve our near-term target of an average DPU of 2,936 yen per fiscal period over the year. Our earnings forecasts do not currently factor in any additional property acquisitions or sales, and we will continue to pursue further growth.
DPU Growth Targets
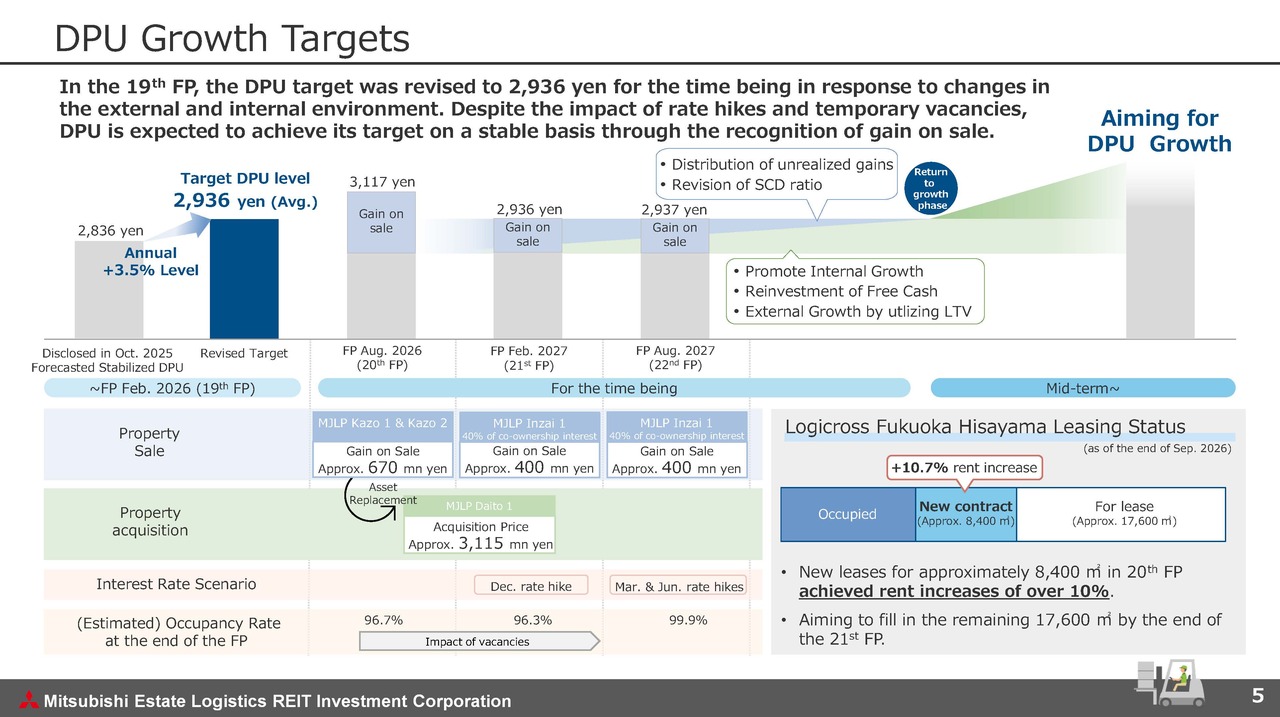
Let me now discuss our growth strategy. As shown in the graph at the top of the slide, our near-term target is an average DPU of 2,936 yen per fiscal period over the year.
To achieve this target, we sold MJ Logipark Kazo 1 and MJ Logipark Kazo 2 during the fiscal period. We have also decided to sell MJ Logipark Inzai 1. Distributing some of our unrealized gains has put us on track to achieve our near-term DPU target.
Meanwhile, to offset the decline in NOI resulting from property sales, we acquired MJ Logipark Daito 1 in July this year. This relatively new and highly competitive property in inland Osaka enhances the quality of our overall portfolio. We also acquired it at a discount of approximately 20% to its appraised value, making this an attractive acquisition.
Tenant departures at some of our properties have led to a slight decline in the overall portfolio occupancy rate. However, we aim to fill these vacancies during the period in which we recognize the gains on sale mentioned earlier.
Logicross Fukuoka Hisayama, shown at the bottom right of the slide, is an example of a property affected by tenant departures. We have not yet completed leasing for all the space. However, rents for the space where leases have already been signed are more than 10% above the previous levels. We are making steady progress with our internal growth initiatives.
Capital Recycling Using Disposition Proceeds
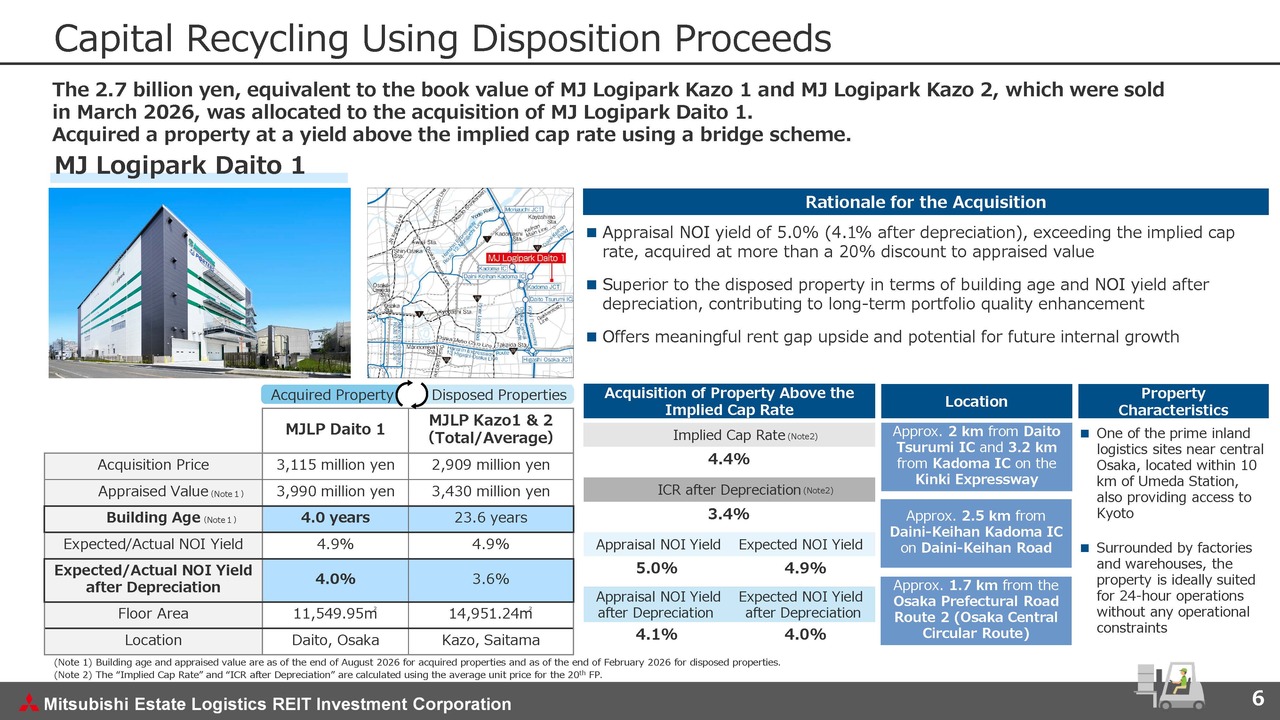
Let me explain the results of our capital recycling. During the fiscal period, we sold MJ Logipark Kazo 1 and MJ Logipark Kazo 2 and acquired MJ Logipark Daito 1 as their replacement.
As shown in the table at the bottom left of the slide, MJ Logipark Daito 1 is substantially newer than MJ Logipark Kazo 1 and MJ Logipark Kazo 2 and has a significantly higher NOI yield after depreciation. The acquisition therefore enhances the quality of our portfolio.
We believe that the property currently offers meaningful rent gap upside and potential for further growth. We also expect it to contribute to MEL's growth in the anticipated inflationary environment.
Returning Capital Gains to Unitholders
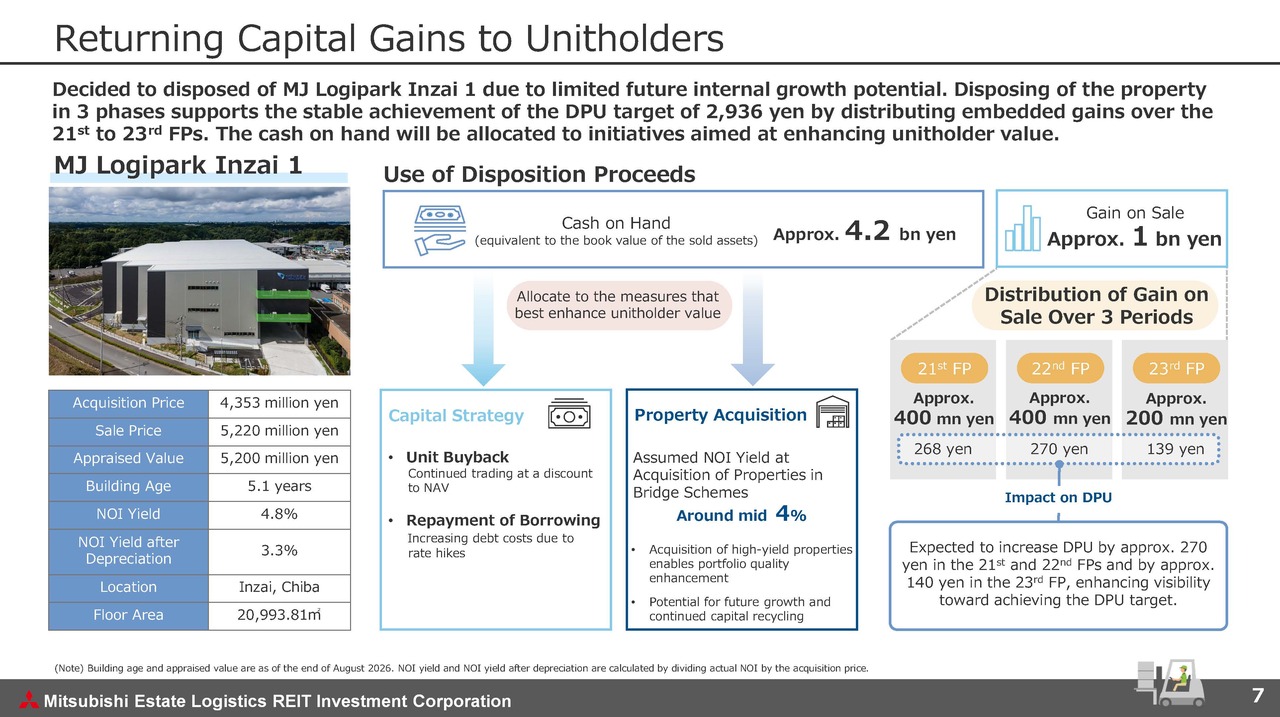
Let me explain the distribution of capital gains in more detail. After considering the property's potential for future internal growth and the balance of our portfolio, we decided to sell MJ Logipark Inzai 1 and announced the decision yesterday.
As shown on the right side of the slide, a key feature of this sale is that we will dispose of co-ownership interests in the property in stages over the next three fiscal periods. Spreading the benefits of the sale over this period will help smooth out the impact of temporary vacancies following tenant departures and rising debt costs, supporting stable operations at MEL.
We expect to retain approximately 4.2 billion yen within MEL, equivalent to the book value of the property sold, as the sale proceeds are received in stages. We plan to allocate these funds to the measures that best enhance unitholder value over the medium to long term, choosing from options such as property acquisitions, unit buybacks, and repayment of borrowings. That concludes our report on the financial results and MEL's growth targets.
Internal Growth Strategy
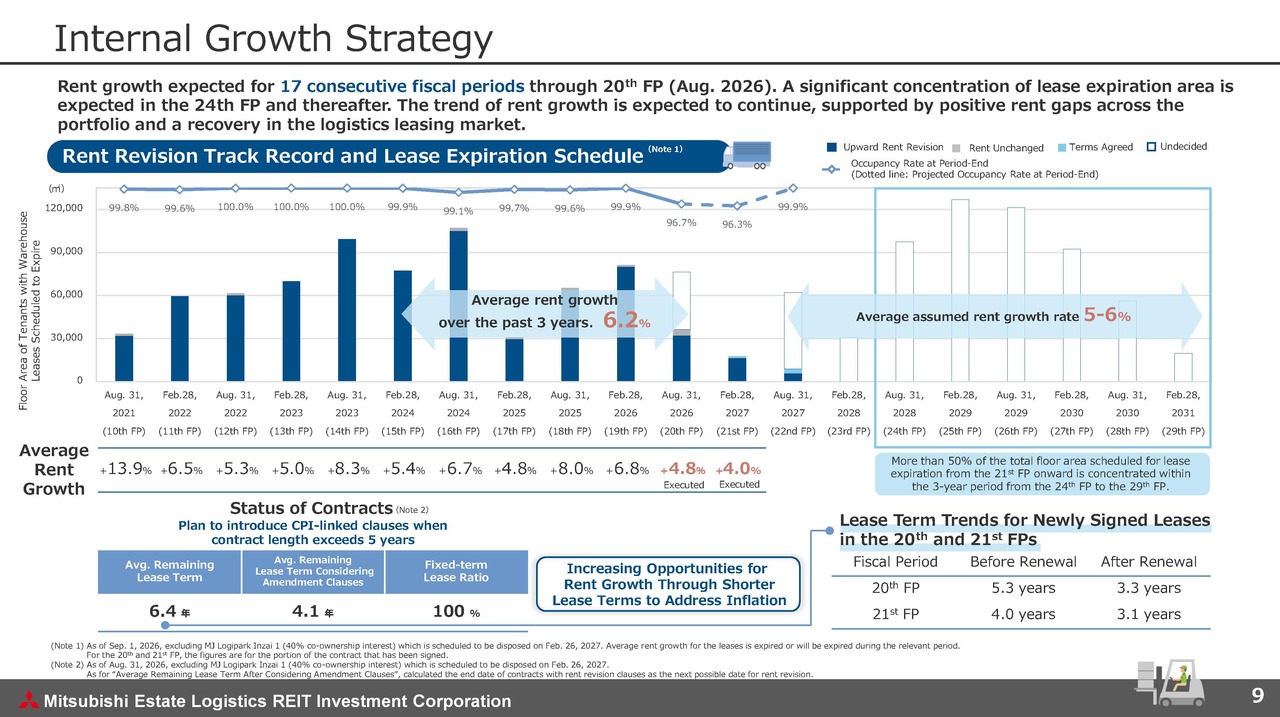
Next, I will discuss our initiatives to enhance MEL's unit price, starting with internal growth. In the 20th fiscal period, we achieved rent increases of 4.8% over the previous rents for warehouse space where leases expired and new agreements were signed. This marked our 17th consecutive fiscal period of upward rent revisions.
In the current 21st fiscal period, we have already renewed leases with tenants for most of the space where leases are due to expire. We expect the renewed rents to be 4.0% higher than the previous levels. This is slightly below our historical average, mainly because the previous lease terms were short and the rents were already among the highest in their respective areas.
We have also shortened the terms of recently signed leases to increase opportunities for rent revisions in an inflationary environment. Based on our recent results, we believe that rents are continuing to rise.
Internal Growth by Strategic CAPEX and Properties in Disaster-Affected Areas
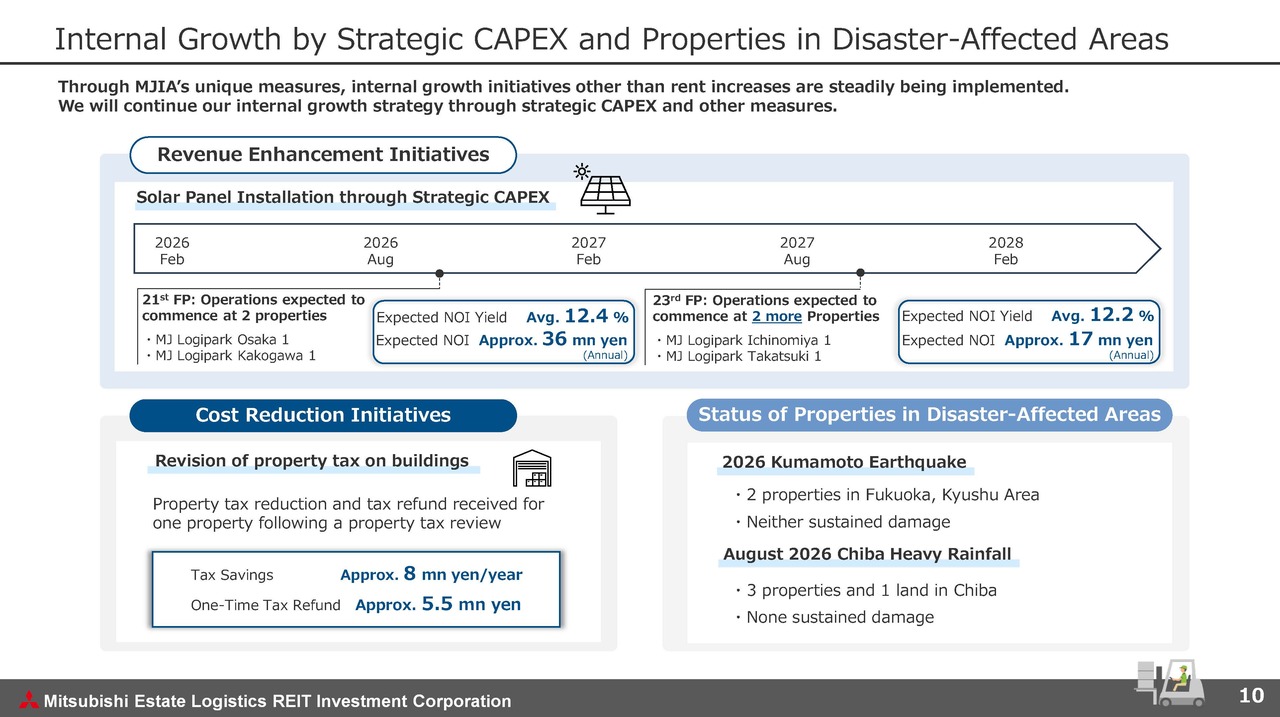
Let me share some of MJIA's unique initiatives for driving internal growth beyond rent increases. The top of the slide shows our strategic CAPEX initiatives aimed at increasing revenue. MEL installs solar panels on the rooftops of its logistics facilities and leases them to power generation operators. Full-scale operations are scheduled to begin at two properties in the current 21st fiscal period, with a highly attractive average expected NOI yield of 12.4%.
Similar projects are also underway at two additional properties, with operations scheduled to begin in the 23rd fiscal period. We expect attractive investment returns from both projects.
Pipeline to Realize External Growth Strategy
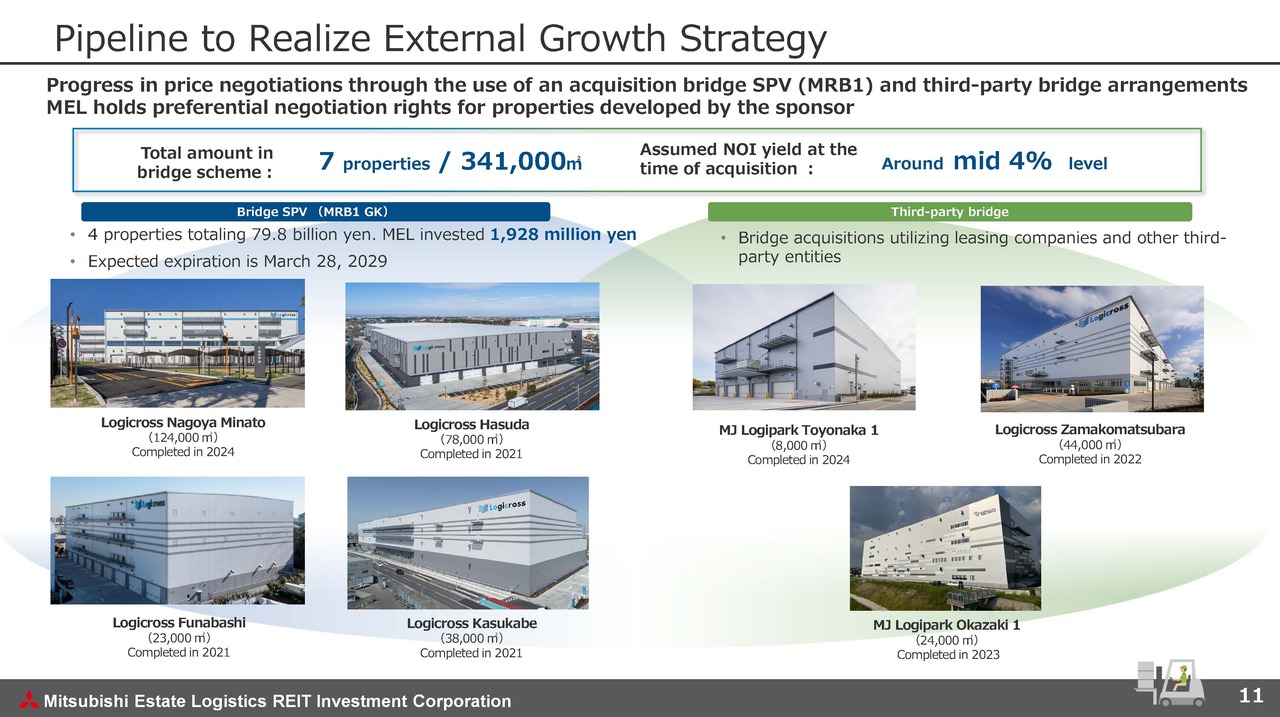
Let me now discuss our external growth strategy and pipeline. Our pipeline currently includes seven properties totaling approximately 340,000 square meters that are held in bridge schemes. We will use this pipeline to achieve external growth that enhances unitholder value, while taking market conditions into account. We will also continue discussions with our sponsor to secure an attractive pipeline.
Financial Strategy
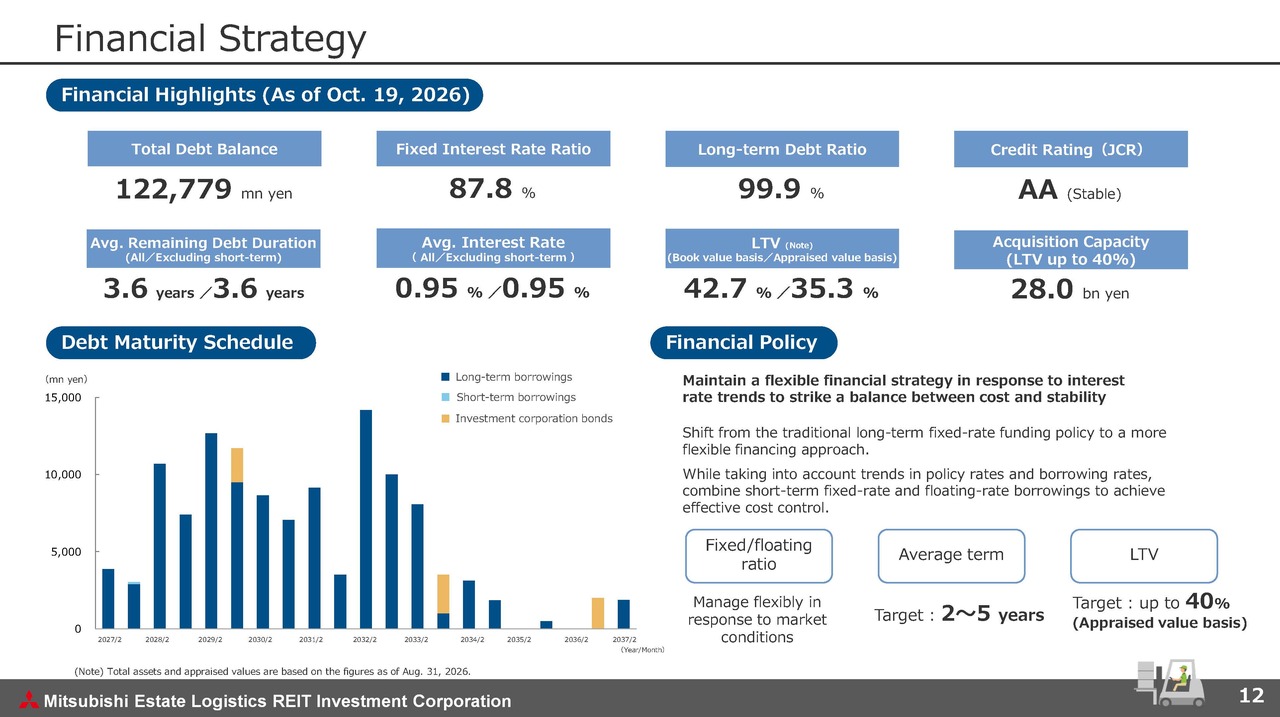
Let me move on to our financial strategy. We continue to maintain stable financial management by leveraging the Mitsubishi Estate Group's strong creditworthiness. Our financial policy is shown at the bottom right of the slide, and there has been no change in our basic approach.
As mentioned at our previous briefing, setting a specific target for the fixed interest rate ratio may not necessarily lead to optimal financing in the current financial environment. We therefore do not plan to set a specific target ratio for the time being. However, we do not anticipate a significant decline from the current ratio.
We aim for an average financing term of around two to five years, seeking to strike a balance between stability and cost control. We will use LTV on an appraised value basis as our primary indicator and the book value-based figure for reference. For the time being, we intend to keep LTV on an appraised value basis at or below 40%.
Financial Strategy Highlights
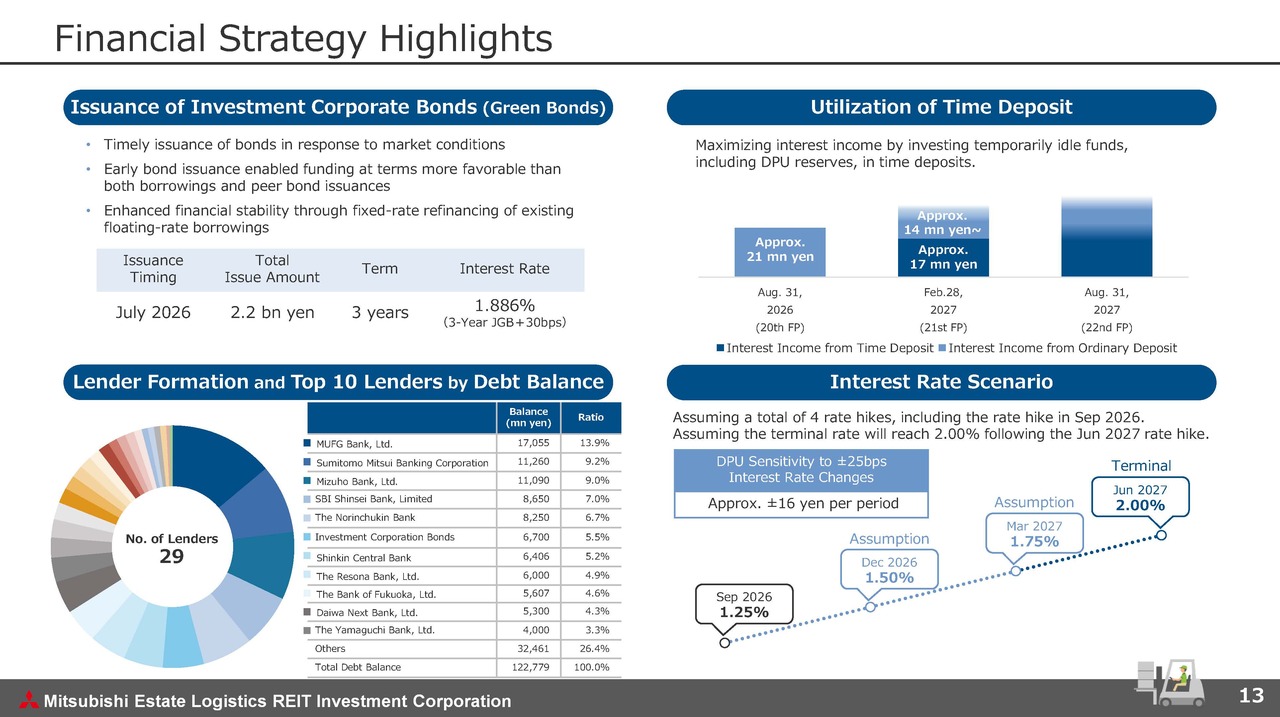
This slide highlights recent financial developments. The top left outlines the bond issuance I mentioned at the beginning. As corporate bond issuance increased considerably, bringing our bonds to market early allowed us to secure attractive financing terms.
The top right shows our use of time deposits. We expect interest income to rise progressively and contribute to MEL's earnings. The bottom right sets out the policy rate assumptions used in our current earnings forecasts, which assume a policy rate of 2.0% in June 2027
Logistics Market (Supply, Stock)
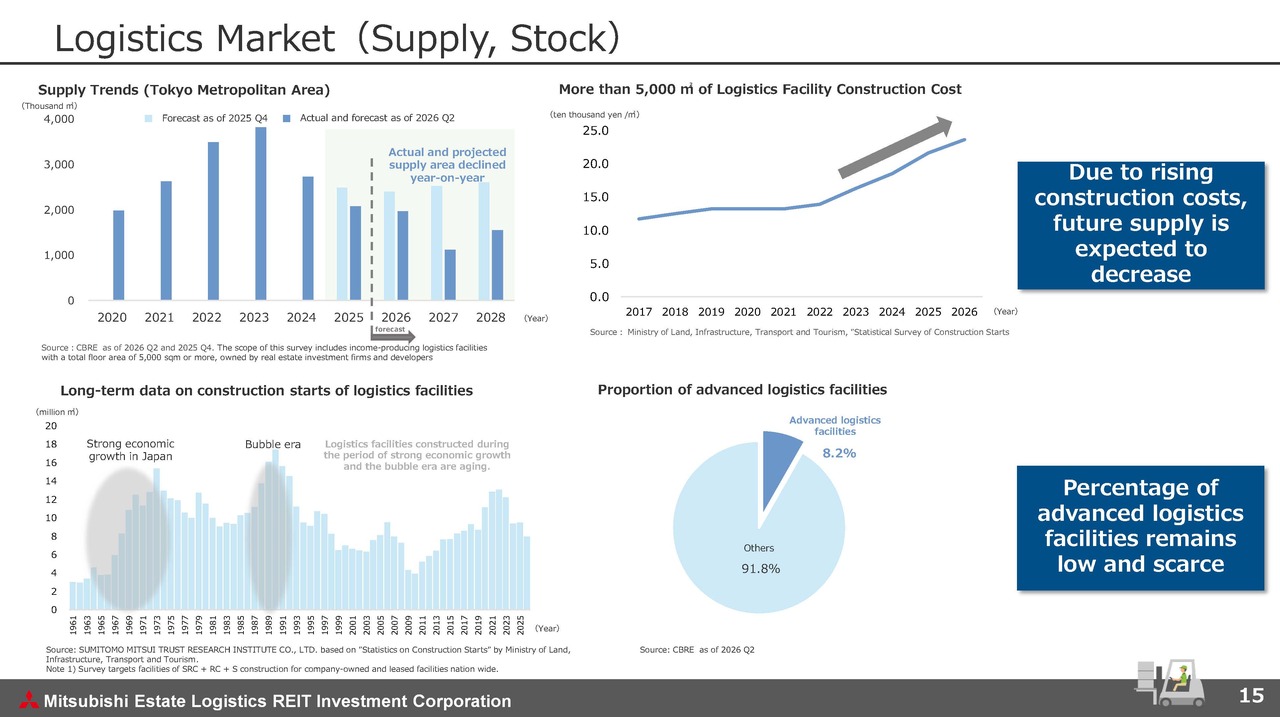
This slide shows the supply trends for logistics facilities. Continued increases in labor costs and building material prices are pushing up construction costs, making development more challenging. As shown in the graph at the top left, future supply is expected to decline. Compared with forecasts from a year ago, supply is now expected to be even more limited.
Meanwhile, as shown at the bottom of the slide, the logistics facility stock continues to age. Despite the large volume of supply in recent years, advanced logistics facilities still account for less than 10% of the stock. We therefore believe that facilities such as those in our portfolio remain scarce.
Logistics Market (Demand)
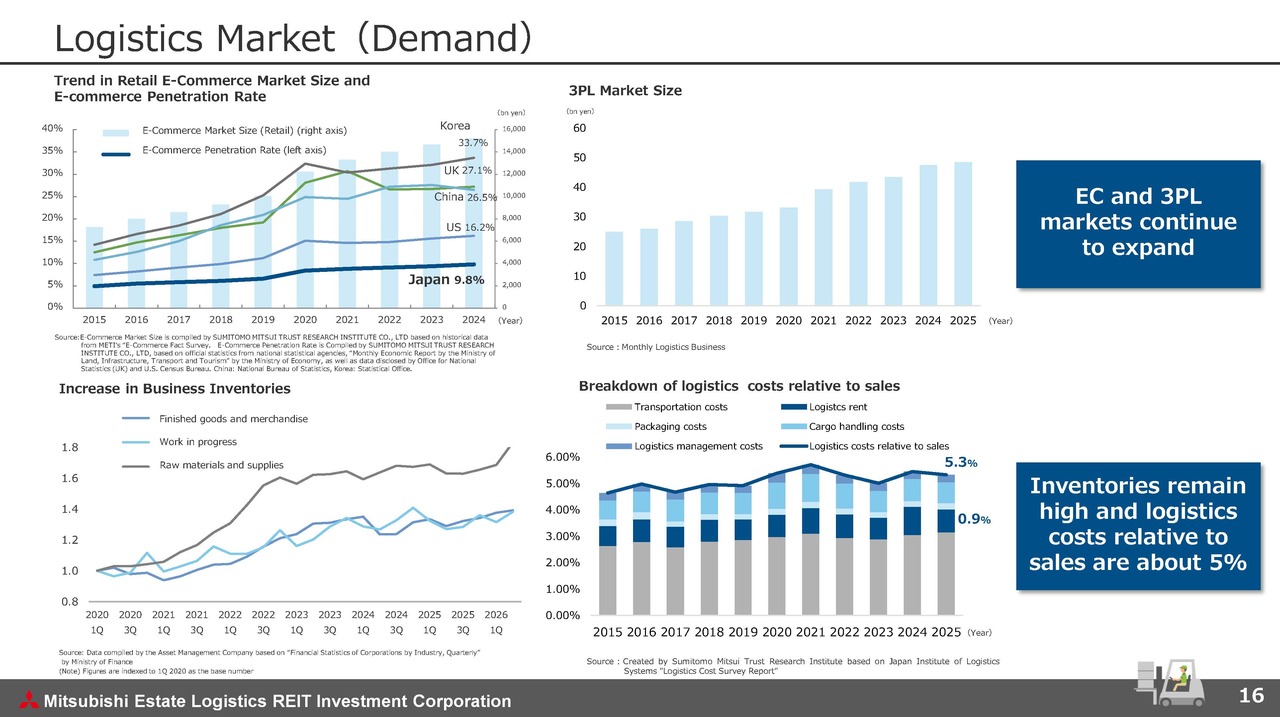
This slide shows the demand trends for logistics facilities. We believe that demand for efficient logistics facilities for lease remains strong, supported by the growing penetration of e-commerce worldwide and businesses' increasing use of third-party logistics services.
In addition, corporate inventories remain high due to robust business activity, while logistics costs relative to sales remain contained at around 5%. We therefore expect stable demand to continue.
Logistics Market Overview: Supply-Demand Trends by Region
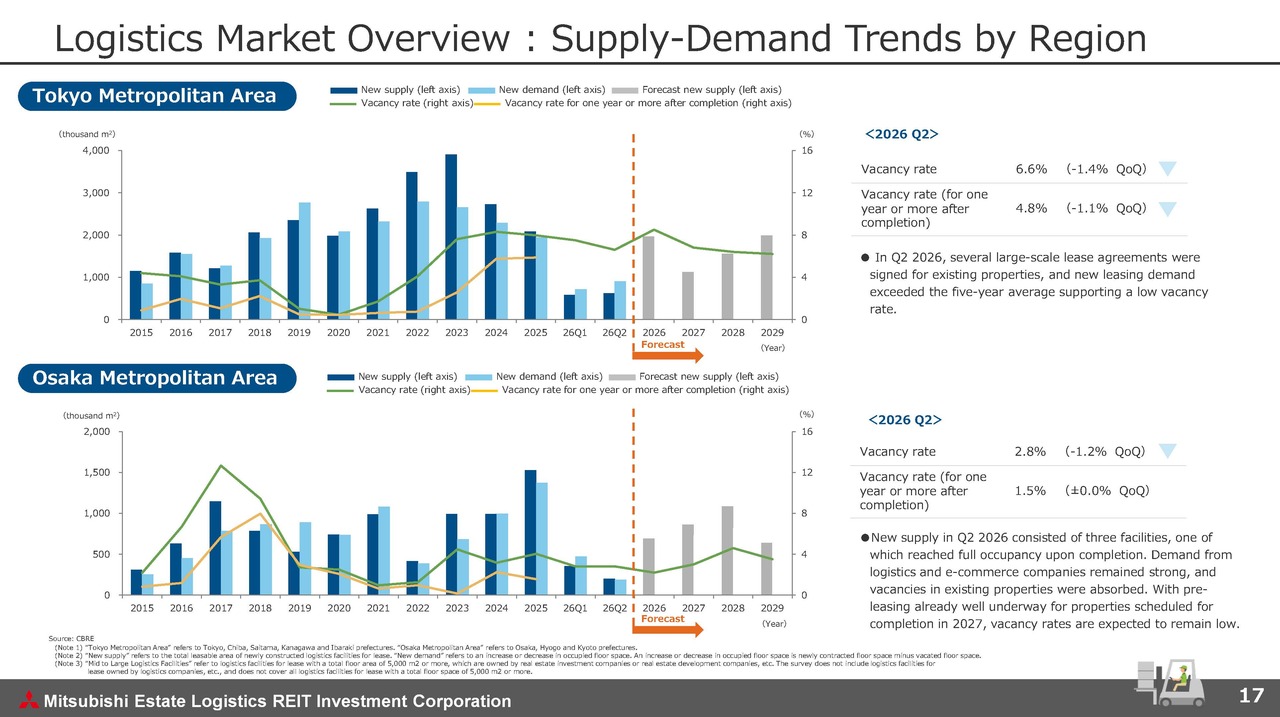
Pages 17 and 18 outline the supply-and-demand trends by region. In the Tokyo Metropolitan Area, vacancy rates have temporarily risen due to increased supply in recent years. However, future supply is expected to remain at a moderate level. We therefore expect vacancy rates to decline gradually and the market to shift toward conditions that favor property owners.
In the Osaka Metropolitan Area, vacancies are currently limited and the supply-and-demand balance is tight. We expect this trend to continue.
Slightly more than 80% of MEL's portfolio is located in the Tokyo and Osaka metropolitan areas. We aim to achieve further internal growth, supported by these favorable or improving market conditions.
This concludes my presentation. Thank you for your attention.
Q&A: Key Factors in Returning to the Growth Phase
Questioner: I have a question about the “Return to growth phase” shown on page 5. My understanding is that you would first complete leasing of the space left vacant by tenant departures and undertake property acquisitions using LTV headroom or unit buybacks funded by free cash flow. Would you return to the growth phase once you have also achieved a DPU of 2,936 yen excluding gains on sale?
Once you return to the growth phase, what other measures do you plan to take to achieve growth?
Yokota: As you pointed out, filling vacancies is a key factor in returning to the growth phase. We made this point at our previous financial results briefing as well.
Another factor, as shown in the graph on the internal growth strategy slide, is the relatively small volume of space currently coming up for lease renewal. We therefore intend to move into the growth phase while using gains on sale to help offset the effects of vacancies and the limited volume of space coming up for renewal.
As we approach the fiscal period ending August 31, 2028, we expect more space to come up for lease renewal, creating greater opportunities for internal growth. Until then, we intend to use gains on sale to support earnings. We also expect to have a clearer view of the terminal policy rate and interest rate levels by then. We plan to present a new growth strategy based on our internal growth prospects and interest rate levels.
For now, our basic approach is to steadily implement the measures shown on the slide. I believe we will consider additional measures going forward.
Q&A: Assumptions for Future Rent Growth
Questioner: I have a question about your approach to rent growth. While it appears to be slowing somewhat at present, you are forecasting rent growth of around 5% to 6% from the fiscal period ending August 31, 2027 onward. By comparison, GLP J-REIT, which announced its results this month, reported actual rent growth of 10% and a forecast of 15% going forward.
Does MEL also aim to achieve those levels, or does the difference reflect factors such as property locations, quality, or lease terms? Could you share your view on the difference in rent growth momentum?
Yokota: Our assumed rent growth rate is 5% to 6%. Growth rates can vary considerably depending on existing rent levels, and we have adopted a relatively moderate figure.
The market environment and supply-and-demand balance continue to improve. When a larger volume of space comes up for renewal, we expect an even more favorable supply-and-demand balance and stronger prospects for market rent growth. We therefore believe we could achieve rent growth above the 5% to 6% range.
Q&A: Assessment of Acquired and Disposed Properties
Questioner: My question concerns capital recycling and the distribution of gains on sale. Following your earlier explanations, I now have a good understanding of the individual properties. Comparing MJ Logipark Daito 1 with MJ Logipark Kazo 1 and MJ Logipark Kazo 2 on page 6, I understand that the acquisition replaces older properties with a newer one, which is a typical benefit of capital recycling.
However, there is little difference in building age between MJ Logipark Daito 1 and MJ Logipark Inzai 1, the property shown on page 7. I therefore think that a major benefit of this capital recycling is the ability to acquire the replacement property at a very low price. I also believe that the main reason for selling MJ Logipark Inzai 1 is the high price you can achieve.
You also mentioned earlier that MJ Logipark Daito 1 offers some rent gap upside. Could you explain how you assess MJ Logipark Daito 1 compared with MJ Logipark Inzai 1?
Your comments seem to suggest that MJ Logipark Inzai 1, which you are selling, has limited upside. Although a direct comparison may be difficult, is its rent gap smaller than that of MJ Logipark Daito 1?
Yokota: As I mentioned when discussing the market earlier, the supply-and-demand balance in inland Osaka is very favorable. MJ Logipark Daito 1 has a substantial gap between its current rents and market rents, was acquired at a very attractive price, and offers potential for further growth.
We also found it attractive compared with MJ Logipark Kazo 1 and MJ Logipark Kazo 2 and therefore decided to acquire it.
Meanwhile, MJ Logipark Inzai 1, which is five years old, does not have any particular problems within our overall portfolio.
However, given our target of returning capital gains to unitholders, we decided to sell MJ Logipark Inzai 1 after considering a range of factors. These included the unrealized gains that could be realized through a sale, the impact on the portfolio after the sale, and the property's potential for internal growth. The two properties have somewhat different internal growth prospects, which led us to decide to sell one and acquire the other.
Q&A: Assumed NOI Yield at the Time of Acquisition of Pipeline Assets
Questioner: I have a question about the pipeline on page 11. Seven properties are shown, with phrases such as 'Assumed NOI yield at the time of acquisition: Around mid 4% level' and 'price negotiations.'
I understand that the yield in the mid-4% range reflects price adjustments: as properties remain in the fund, depreciation reduces their book values and raises the yield. Does this figure reflect the current level? For example, if you acquired the properties a year from now, could depreciation and other factors result in a yield above the mid-4% range?
As for the SPV, I assume that its yield is somewhat higher because of leverage. Could you remind us of the SPV's current yield?
Yokota: The mid-4% figure is our estimate of the yield we could achieve during the period in which MEL is likely to acquire the properties.
At our previous results announcement, we said that we expected the SPV to deliver a return of around 5% on an earnings basis. My impression is that the return is now slightly below that level due to factors such as rising interest rates.
Remarks from Mr. Yokota
Once again, thank you for taking the time out of your busy schedules to attend the financial results briefing for the fiscal period ended August 31, 2026 (the 20th fiscal period) of Mitsubishi Estate Logistics REIT Investment Corporation today. We will continue our efforts to meet the expectations of our investors, and we sincerely appreciate your continued support.