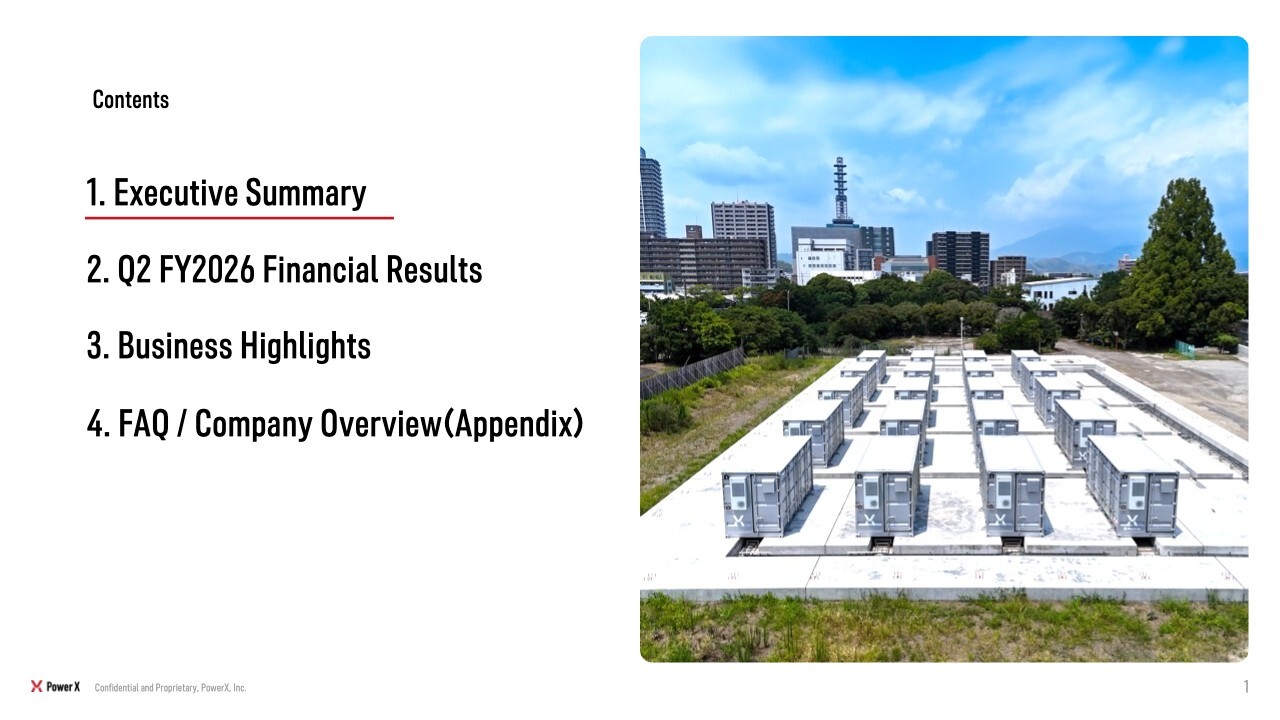
Contents
Masahiro Ito (hereinafter, “Ito”): Hello, everyone. I am Masahiro Ito, Director, President & CEO of PowerX, Inc. Thank you very much for joining us today for our financial results briefing.
Our financial results presentation contains a very large amount of information, and I apologize that each briefing comes with so much material. We have been listed for less than a year and are not yet covered by any analysts. As a result, there are currently no consensus estimates or target share prices for the Company.
Against this backdrop, we have done our utmost to include all of our latest information in the presentation, with the aim of enabling everyone to make their own judgments. This has resulted in a large volume of information, but I hope you will review the materials and stay with us through the presentation. Thank you for your understanding.
Let me explain today’s agenda. I will first give a brief summary, after which our CFO, Mr. Fujita, will explain the financial results. I will then return to discuss the state of our businesses, the market environment, and new products.
Executive Summary
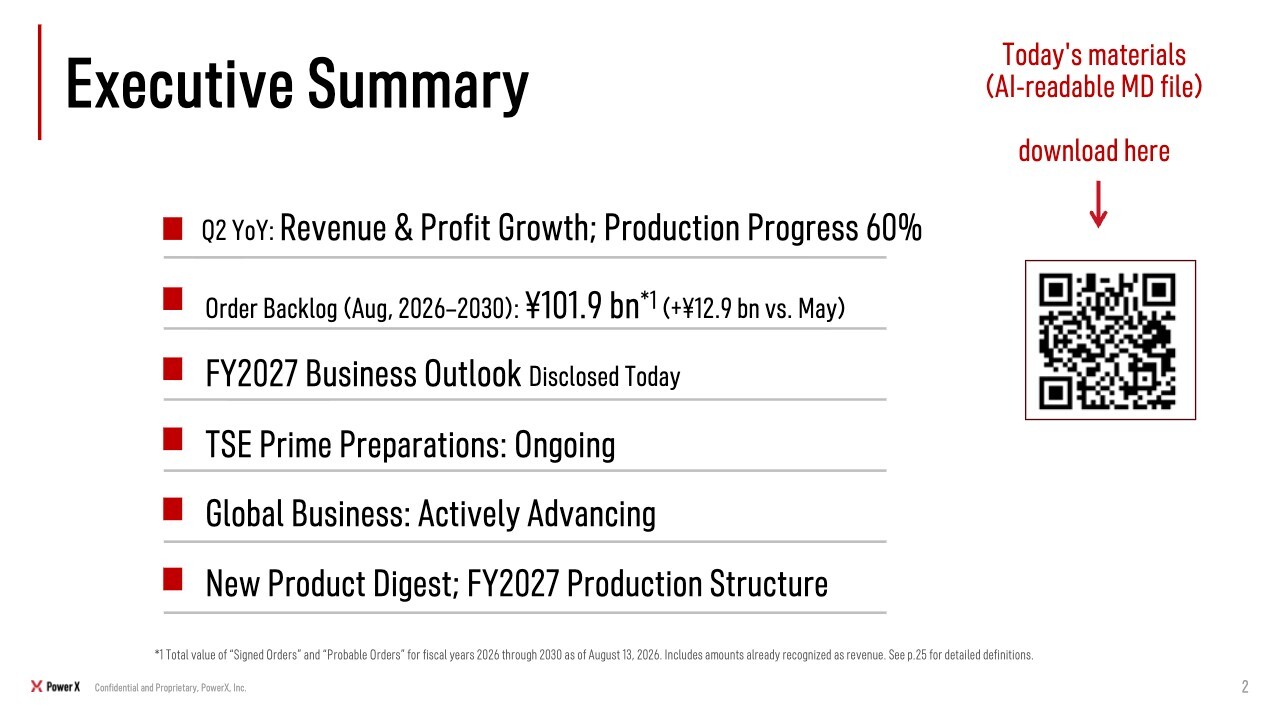
Let me begin with the summary. In the second quarter, revenue grew and profitability improved year on year.
For new investors who may not yet be very familiar with PowerX, let me briefly explain our business model. We manufacture batteries in response to customer orders. Because the factory does not operate at full capacity continuously, we build inventory in advance and then ship products in batches as customers' scheduled delivery dates approach. Revenue is recognized when the products are loaded onto trucks or delivered to the project site, depending on the delivery point stipulated in each contract.
Accordingly, an important KPI for us is the annual production progress rate. We have received orders totaling more than ¥40.0 billion for delivery within this fiscal year, and by the end of June we had completed 60% of the year's planned production. Production is progressing ahead of plan, and we have now manufactured approximately ¥24.0 billion worth of products. We expect production to continue smoothly through the end of the fiscal year at this pace.
Next, let me discuss our order backlog. We are seeing very strong demand for battery storage systems, both for projects from next year onward and for projects to be delivered this year. Our order backlog has grown to ¥101.9 billion, including ¥12.9 billion in new orders received over the past three months.
At this pace, we are also gaining greater visibility into next fiscal year. We would not normally disclose an outlook for the following year at the half-year results stage, but visibility into next year has now become sufficiently clear that today we would like to show you what we believe next year will probably look like.
As we disclosed in June, we are also steadily proceeding with preparations for a transfer to the TSE Prime Market. We have no new update today, but we will make a further announcement when there is progress.
We are also actively expanding our overseas business, and I will provide an overview later.
Next, I will provide a digest of our new products and discuss our production structure for next fiscal year. I would like to explain this carefully so there is no misunderstanding. We believe we have made substantial progress in improving capital efficiency in our production structure, and I will also explain that point.
Let me add a note about the QR code shown on the slide. We have included this since the previous briefing. If you feel there is too much material and would like to use generative AI to analyze it, please scan the QR code or refer to the AI-readable version of the financial results presentation on our website. The file is available for download in Markdown, or MD, format.
The file is only in the 20-kilobyte range, so it is small and lightweight. If you download it and load it into a generative AI service such as ChatGPT, Gemini, or Claude, the AI can understand the contents of the materials without misinterpreting them. It is designed so that generative AI can accurately ingest the content, and we encourage you to make use of it.
I will now hand over to Mr. Fujita for the financial review.
PowerX's Revenue Model
Toshiyuki Fujita: I am Toshiyuki Fujita, Corporate Executive Officer & CFO. I will explain our results for the second quarter. Thank you for your time today.
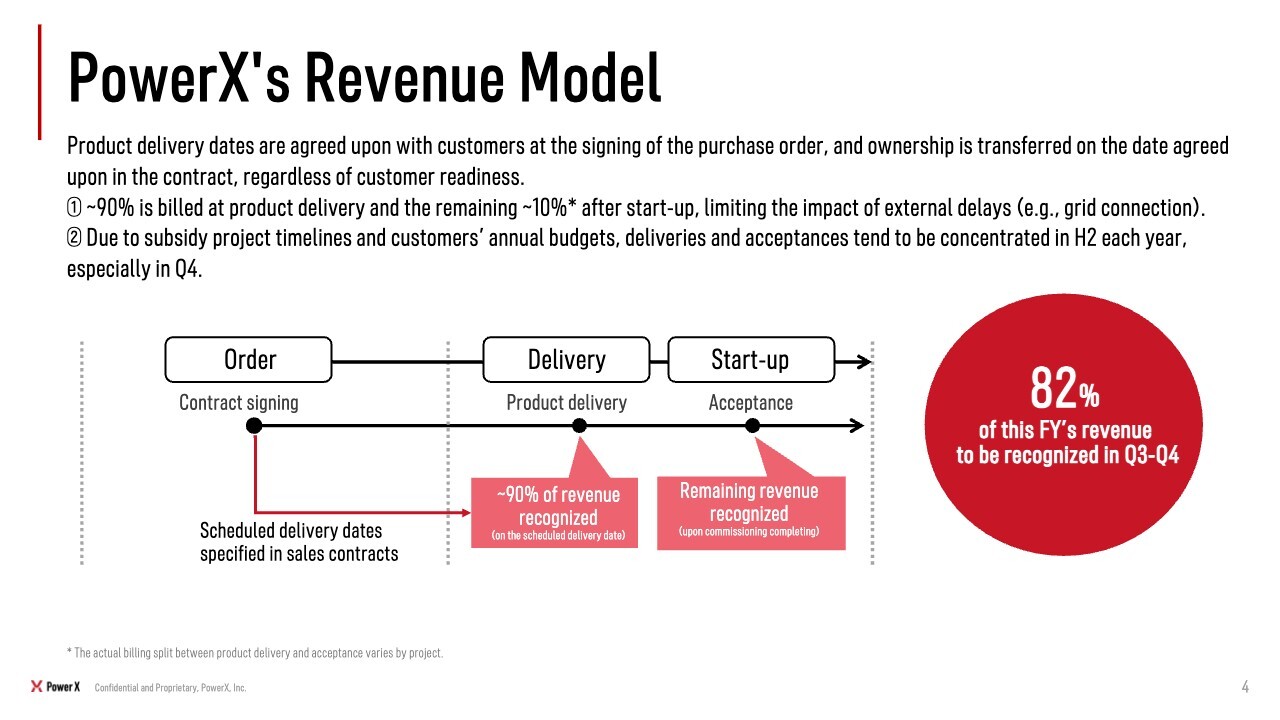
Mr. Ito touched on this earlier, but as some of you may be joining us for the first time, I will briefly review our revenue model before discussing the results. In our core business, particularly the BESS Business, we sell a product called Mega Power, which is essentially our main product.
For Mega Power, after receiving an order for a project, we work backward from the delivery date specified in the contract to manufacture the product, and we recognize revenue when the product is delivered and accepted by the customer. Under the contract, 90% of revenue is recognized upon delivery, and the remainder is recognized upon acceptance, making the model relatively unaffected by delays in the commencement of battery power plant operations and similar external factors.
As shown on the slide, 82% of this fiscal year's revenue is scheduled to be recognized in the second half, during the third and fourth quarters. This is because customers' delivery schedules tend to be concentrated in the second half due to the timing of subsidy programs and their fiscal year-ends, particularly in October, November, and December, which fall in our fourth quarter.
I would like you to keep these characteristics of our revenue model in mind as you listen to the rest of the presentation.
Consolidated Financial Summary
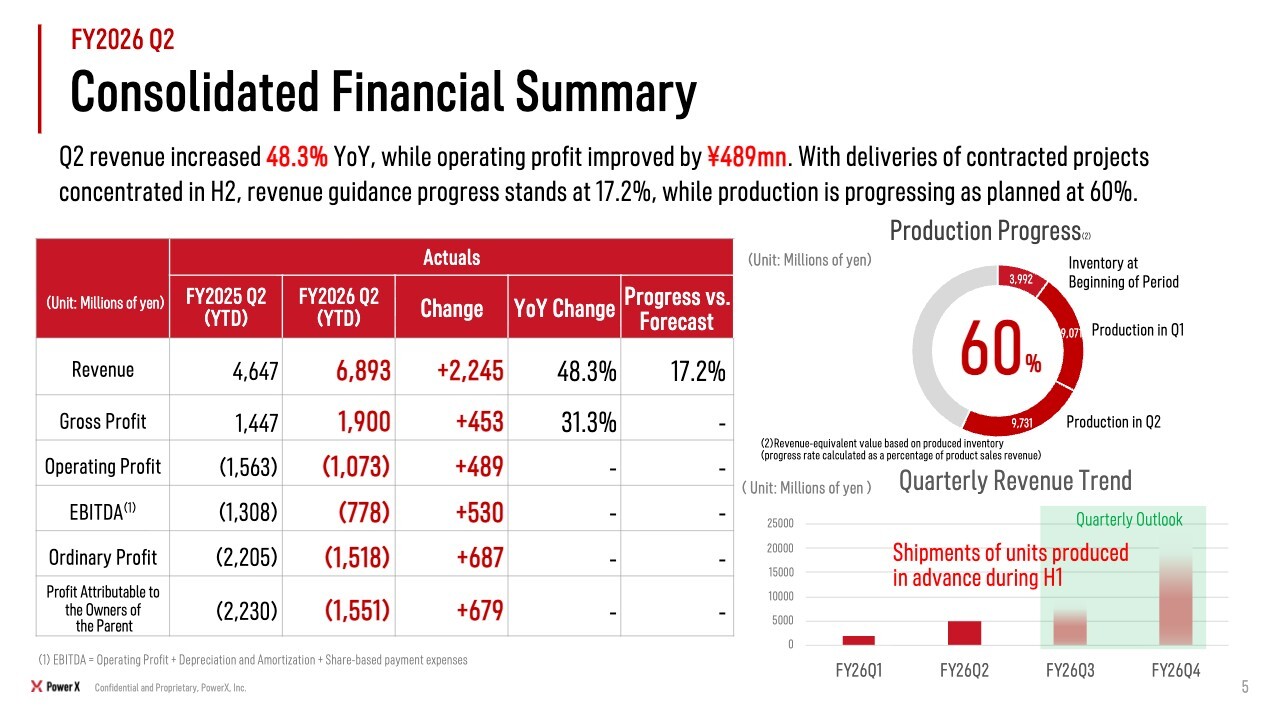
Let me discuss our cumulative results through the second quarter. Revenue was ¥6.893 billion, up 48.3% year on year. Operating loss was ¥1.073 billion, an improvement of ¥489 million from the previous year. Loss attributable to the owners of the parent was ¥1.551 billion, an improvement of ¥679 million from the previous year.
As mentioned earlier, revenue is weighted toward the second half, so we do not believe there is any particular cause for concern even though progress against the full-year revenue forecast is 17.2%. In addition, based on delivery dates agreed with customers under our contracts, we have already completed production equivalent to 60% of the annual plan and are waiting to ship those products. We therefore believe that overall performance is progressing in line with plan.
Full-year consolidated financial results forecast
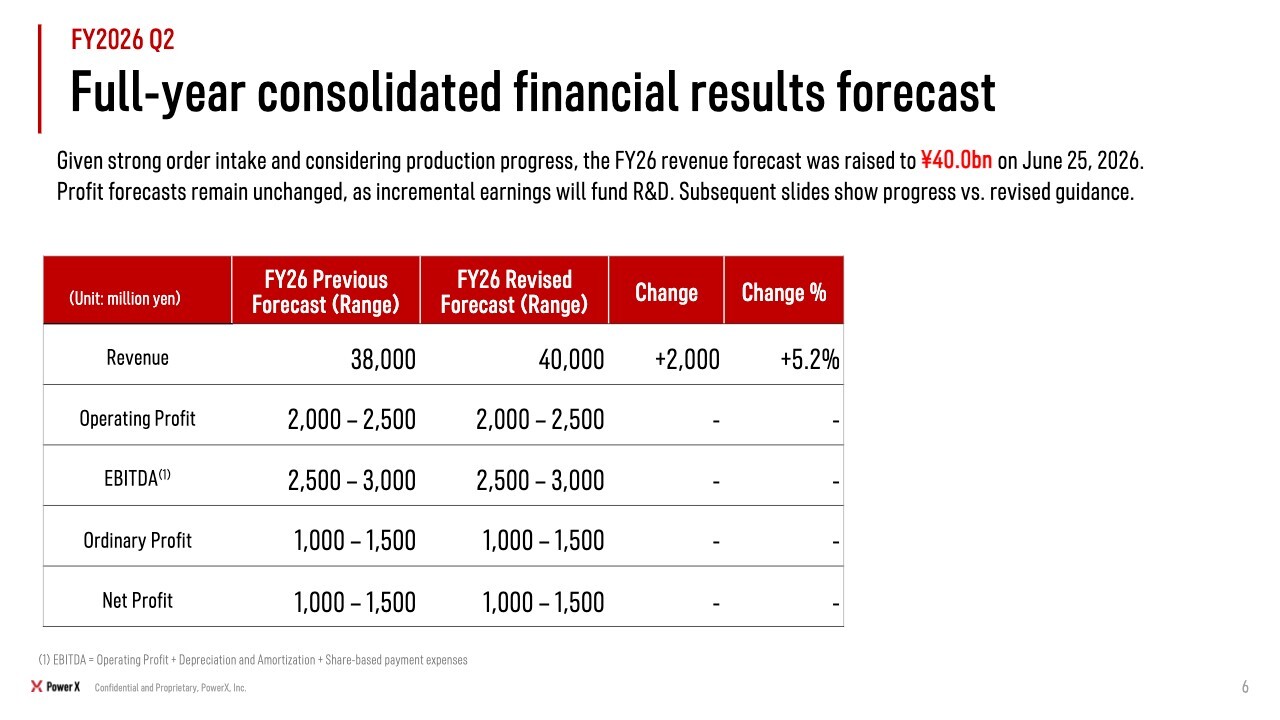
Let me explain our full-year performance outlook. On June 25, 2026, we revised our revenue forecast upward.
We now forecast revenue of ¥40.0 billion. Normally, an increase in revenue would also increase profit, but we left our profit forecasts at each level unchanged. We recently announced new products and plan to use the incremental earnings to fund R&D for those products, which is why our profit forecasts remain unchanged. We are progressing in line with plan toward the revised figures.
FY2026 Order Backlog (Total of Signed Orders and Probable Orders)
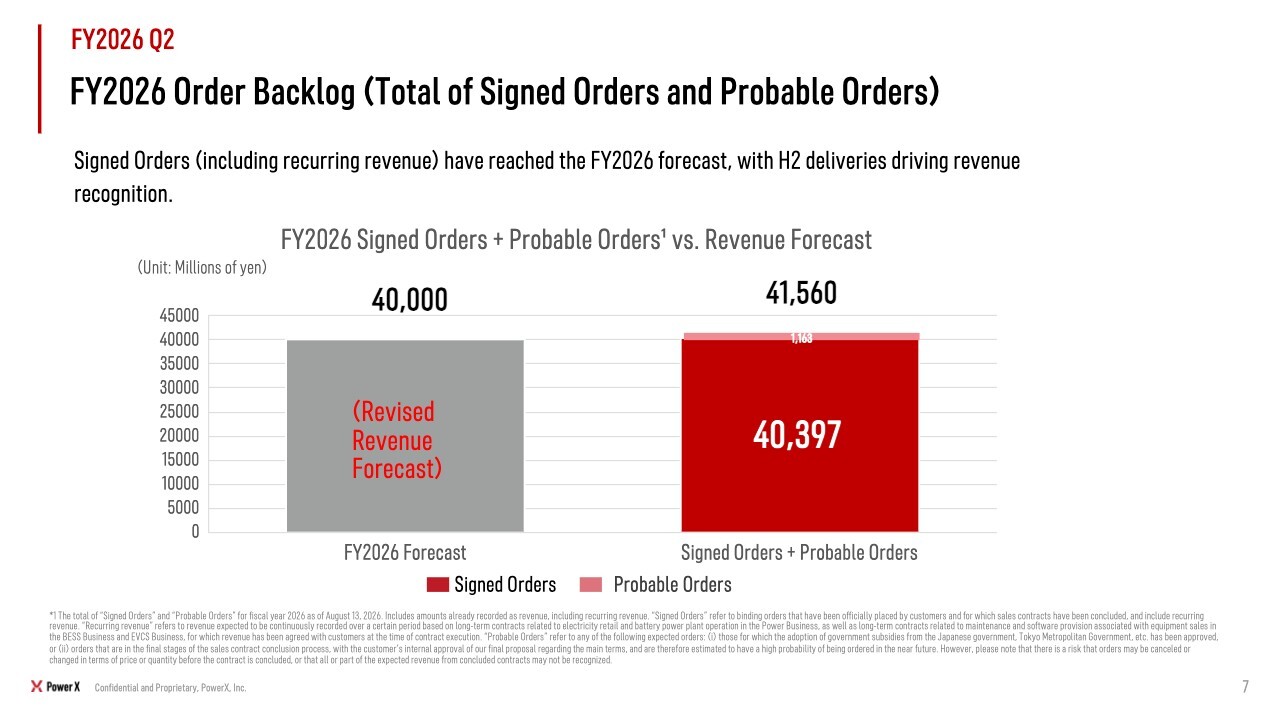
Against the ¥40.0 billion revenue forecast I just mentioned, let me briefly discuss this fiscal year’s order situation, particularly signed orders for which contracts have already been executed. For contracted projects, we plan to deliver the products steadily on the dates agreed with customers under the contracts and recognize revenue accordingly.
Signed orders have already reached ¥40.397 billion, a level sufficient to achieve our full-year forecast. Including a small amount of probable orders for which contracts have not yet been signed, the total already exceeds ¥40.0 billion.
Historically, there have been almost no delays in recognizing revenue from either signed orders or probable orders. We therefore believe that our full-year forecast is fully achievable.
Order Backlog (Signed Orders) Trend
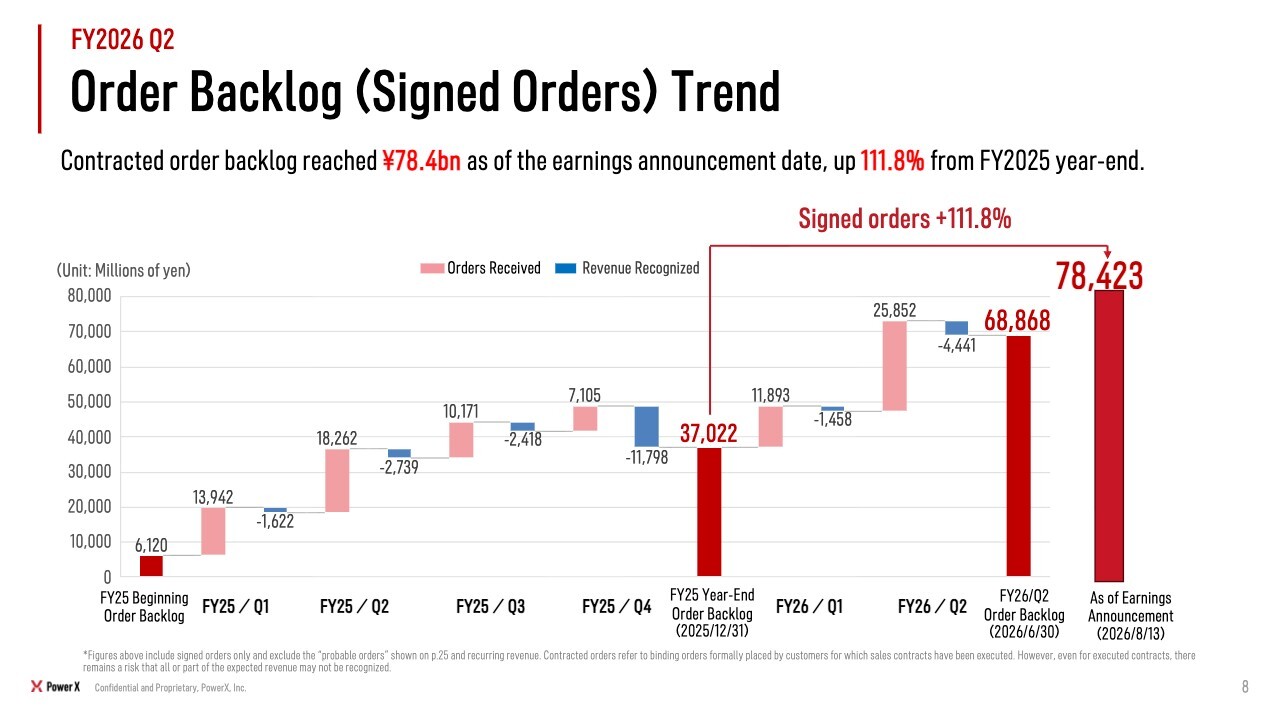
I mentioned that there are no major issues with this fiscal year's orders and that they are progressing as planned. Let me now discuss the overall order backlog, particularly signed orders. As of August 13, the signed order backlog stood at ¥78.423 billion, up 111.8% from the end of FY2025. In the signed order backlog chart, amounts recognized as revenue are deducted from the backlog. Accordingly, the increase shown represents the net growth in signed orders after deducting the amount recognized as revenue.
Although the order backlog will decline to some extent as revenue is recognized in the second half, even after accounting for that, we have already secured signed orders for next fiscal year that exceed this fiscal year’s revenue forecast. As a result, we currently have a fairly high degree of visibility into next fiscal year as well.
Mr. Ito will explain the figures including probable orders later in the presentation.
Outlook and Financial Targets
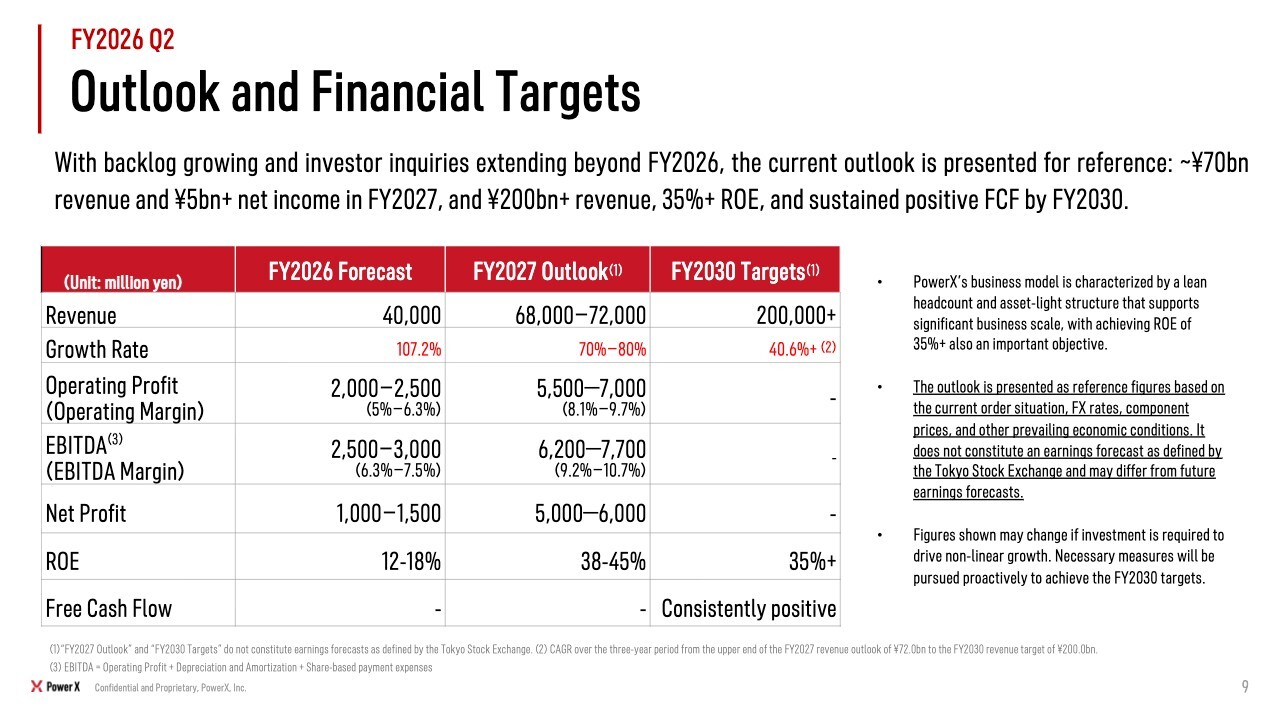
This slide presents an indicative outlook for 2027 and our targets for 2030. This is a new initiative for us, and although it is somewhat unusual, we are making this disclosure at the half-year stage.
As discussed earlier, our order backlog for this fiscal year has built up substantially. Mr. Ito and I conduct extensive investor relations activities and meet with many investors. In those meetings, with the order backlog now at this substantial level, we are repeatedly asked about our earnings outlook for next fiscal year and beyond rather than about this fiscal year. However, from a fair disclosure perspective, we do not believe it is appropriate to provide that type of information only to certain investors.
At the same time, while we are not yet at the stage of announcing a three-year medium-term management plan, visibility into next fiscal year’s revenue and earnings has been increasing to some extent. We therefore decided to disclose the figures this time strictly as an indicative financial outlook.
For next fiscal year, taking into account the signed orders and probable orders discussed earlier, we expect revenue of approximately ¥68.0 billion to ¥72.0 billion.
Profit will be affected by various economic conditions, including exchange rates and component prices, but if the outlook develops as currently expected, we believe we can achieve operating profit of approximately ¥5.5 billion to ¥7.0 billion, EBITDA of approximately ¥6.2 billion to ¥7.7 billion, and net profit of approximately ¥5.0 billion to ¥6.0 billion. We place a strong emphasis on growth rates and believe we can achieve a certain level of growth again next year.
As our long-term management targets toward 2030, we are aiming for revenue of ¥200.0 billion and ROE of at least 35%. For free cash flow, a key point is to ensure that it turns positive, taking into account the partial change to the production plan we are announcing today.
We intend to work toward these targets through 2030 and strive to become one of Japan’s leading manufacturers.
Quarterly Revenue, Gross Profit, and Gross Margin Trends
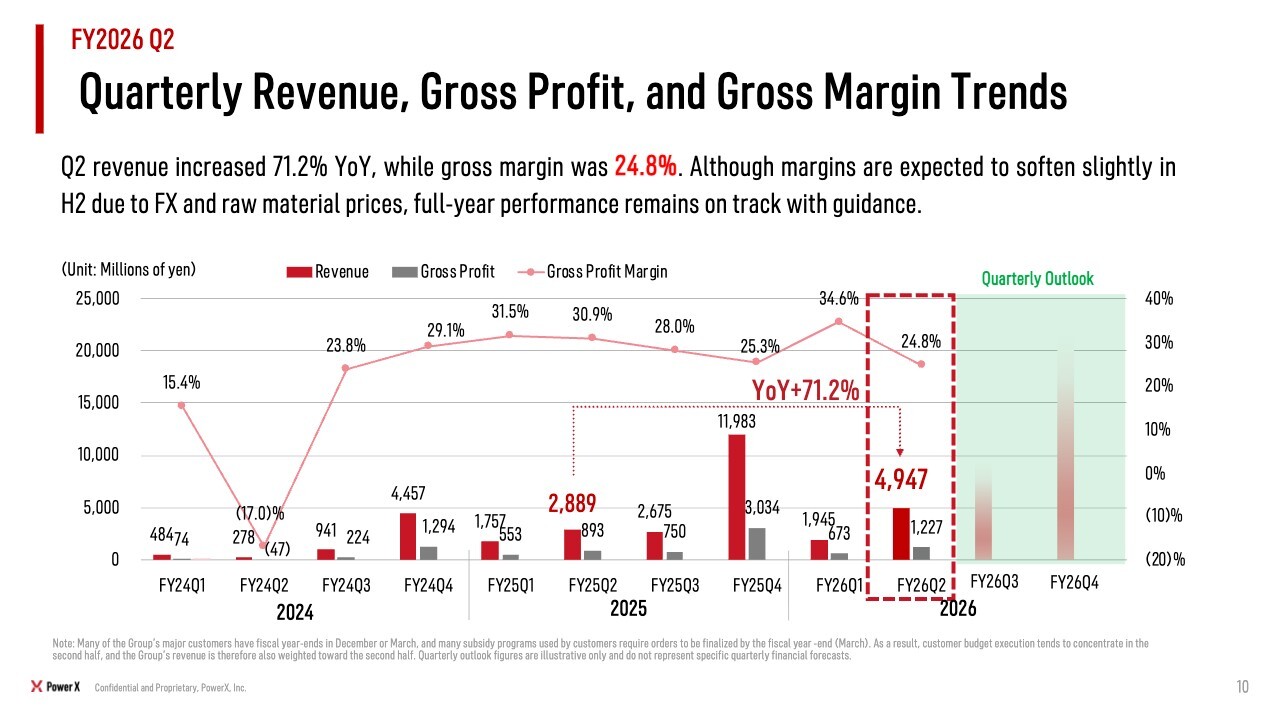
Let me provide more detail on our second-quarter results. As noted earlier for the cumulative period, on a stand-alone second-quarter basis, revenue increased 71.2% year on year and the gross profit margin was 24.8%.
As we explained at the full-year results briefing and again in the first quarter, we expect the gross profit margin to be somewhat lower this year due to the effects of foreign exchange rates and higher raw material prices. This is within the range we assumed when preparing the original budget, and although the margin is expected to be somewhat lower as reflected in our earnings forecast, we believe it will remain within our target range.
Segment Results
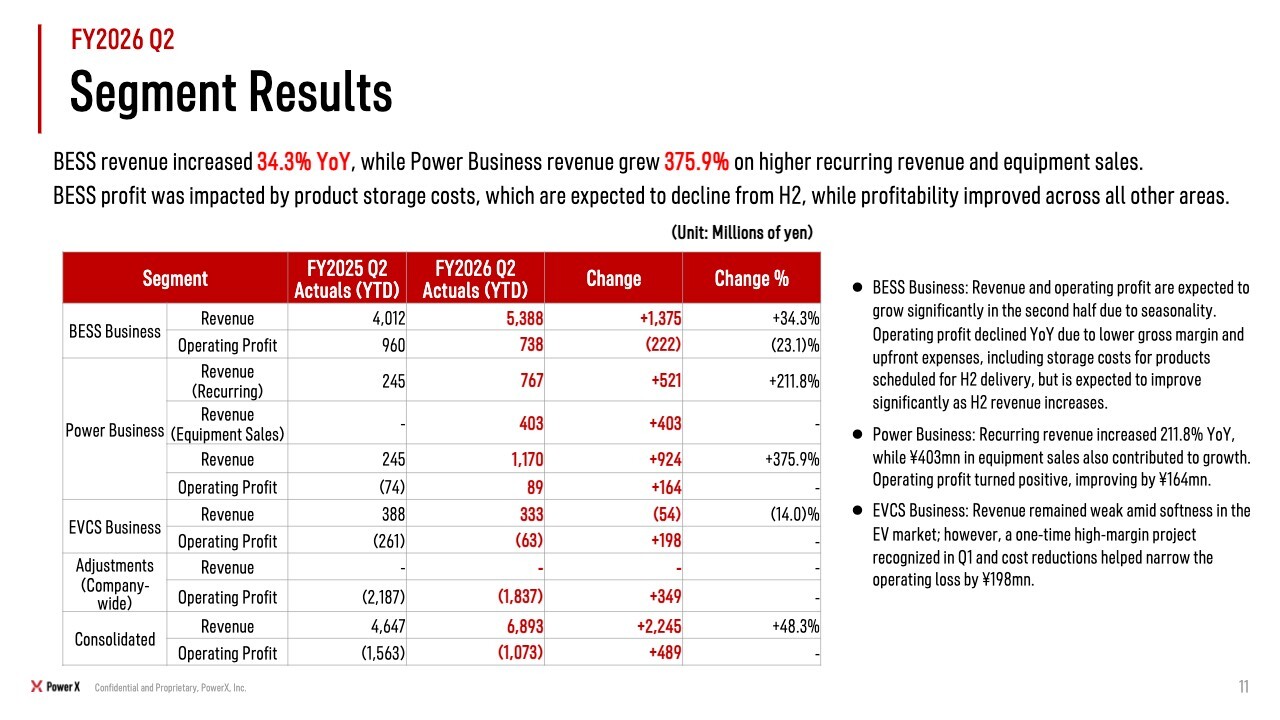
Let me explain segment performance. Revenue in the BESS Business was ¥5.388 billion, up 34.3% year on year. It accounted for 78% of total revenue. We expect substantially larger revenue in the second half, but there is no change in our focus on the BESS Business.
Next, the Power Business. This time, we are reporting recurring revenue and equipment sales separately, and both are progressing well. Overall revenue grew by a very strong 375.9%.
Turning to profit, you may be concerned that the BESS Business was down year on year. The main reason is that, while revenue is weighted toward the second half, we are incurring storage costs for product inventory. Naturally, the products currently in storage will be delivered in the second half, and for next year we are also preparing our own container yard as a measure to reduce storage costs. These storage costs had already been factored into our plan, but this is why this is the only area showing a decline compared with the previous year.
Profit in the other businesses has generally improved from last year, and overall profit has also increased.
Quarterly Profit Trends
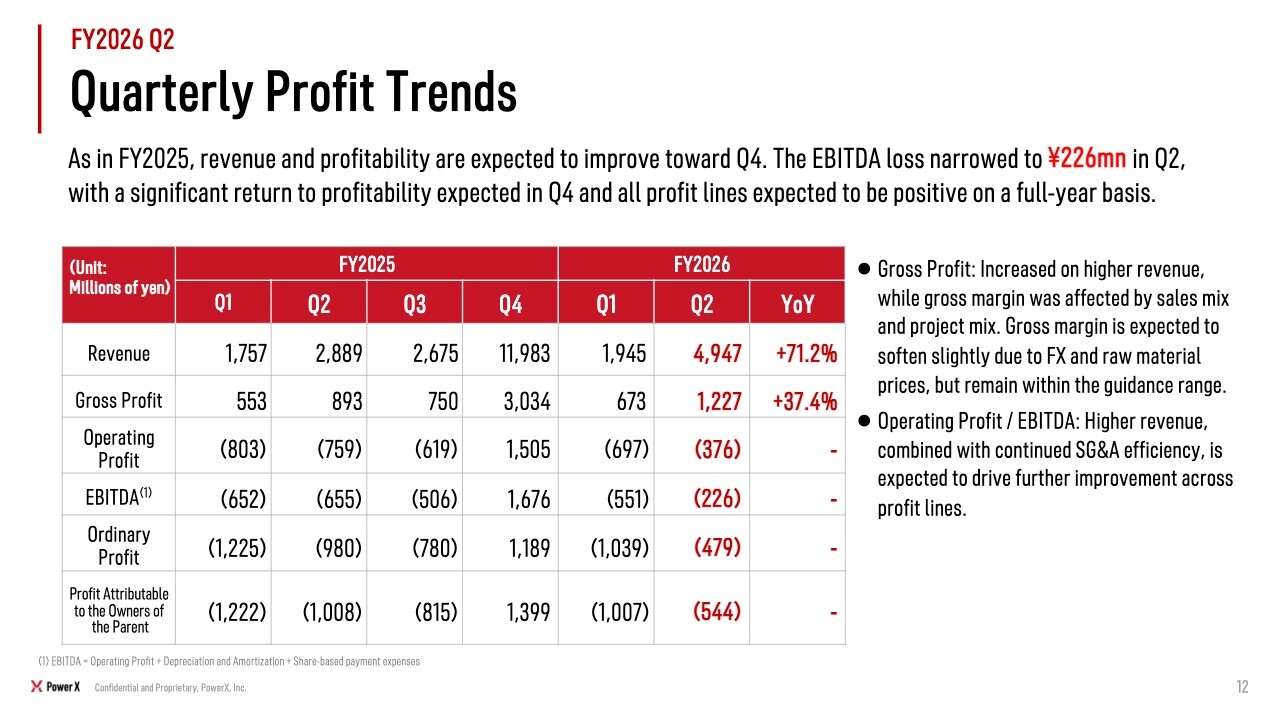
Let me discuss profit at each level. Looking at operating profit, EBITDA, ordinary profit, and profit attributable to the owners of the parent, last year our losses narrowed from the first through the third quarter, and we moved sharply into the black in the fourth quarter.
We expect a similar pattern this year. In the second quarter, EBITDA improved to a loss of ¥226 million. We therefore expect the loss to narrow further in the third quarter and then move substantially into the black in the fourth quarter, following a trajectory similar to last year.
Quarterly SG&A Breakdown and Ratios
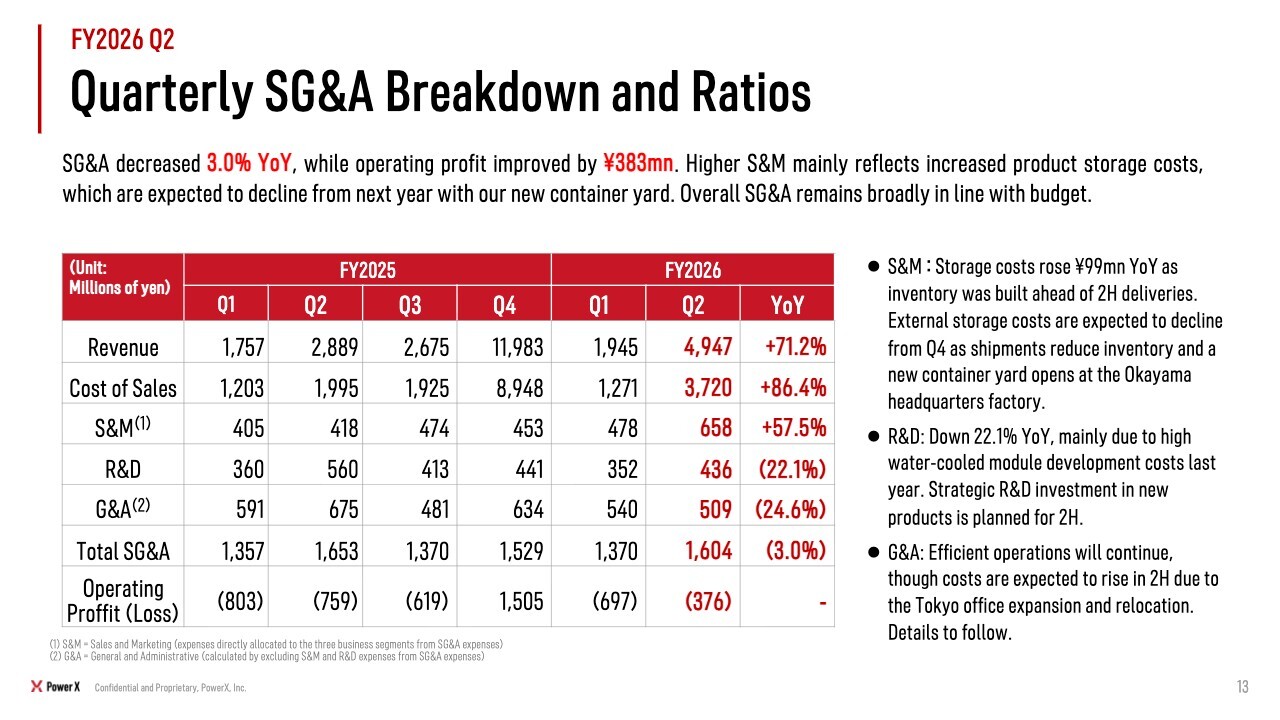
Turning to SG&A expenses, total SG&A was ¥1.604 billion, down 3% year on year. Looking at the breakdown, S&M, or sales and marketing expenses, increased, mainly due to the storage costs I just mentioned and the strengthening of our sales organization.
On the other hand, R&D and G&A expenses declined from last year. With regard to R&D, as I mentioned briefly earlier, the upward revision to revenue would ordinarily have increased profit, but we plan to allocate part of the incremental earnings to R&D and budget additional spending in the second half.
Overall, we believe SG&A expenses are under control and progressing in line with budget.
Revenue per Employee
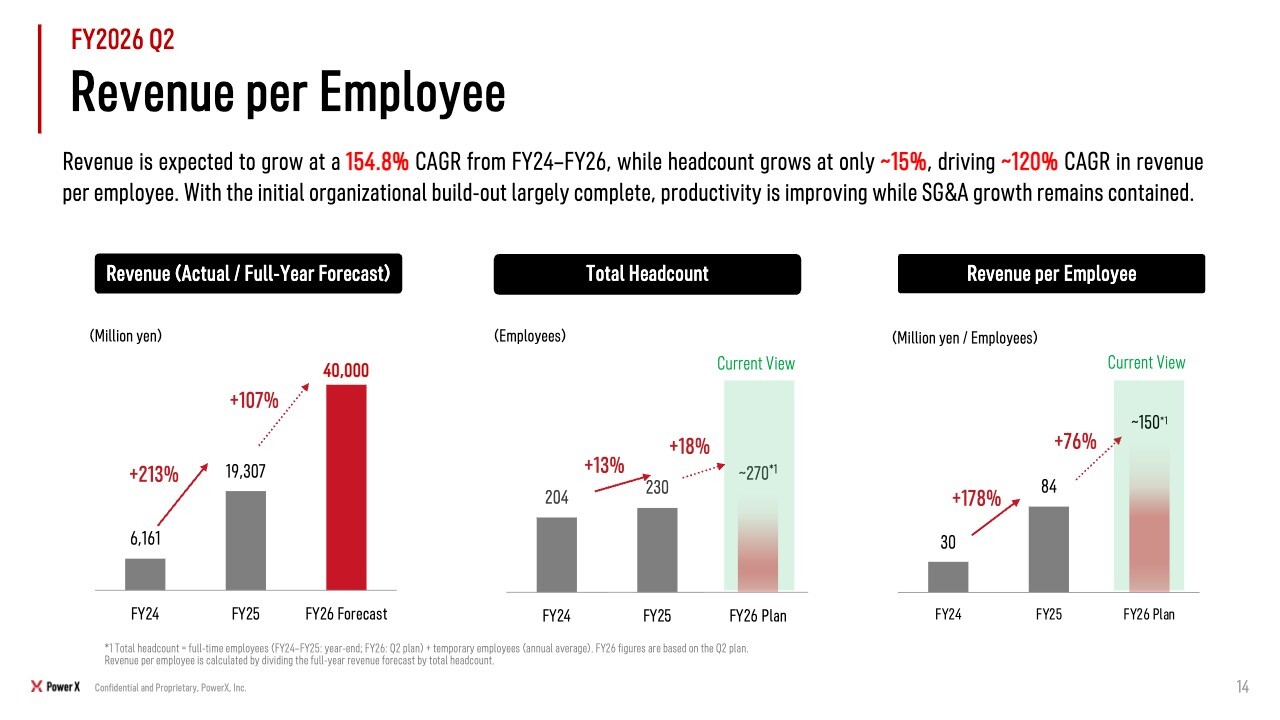
One reason we have been able to keep SG&A expenses relatively contained is that revenue per employee is growing at a CAGR of approximately 120%.
In manufacturing, the difficult part is that the organization needs to be built out quickly at the outset. At this point, however, we have established a structure that allows us to increase production without significantly increasing headcount.
Accordingly, we believe productivity will improve further as our performance improves. We also regard these productivity metrics as very important KPIs.
Consolidated Balance Sheet
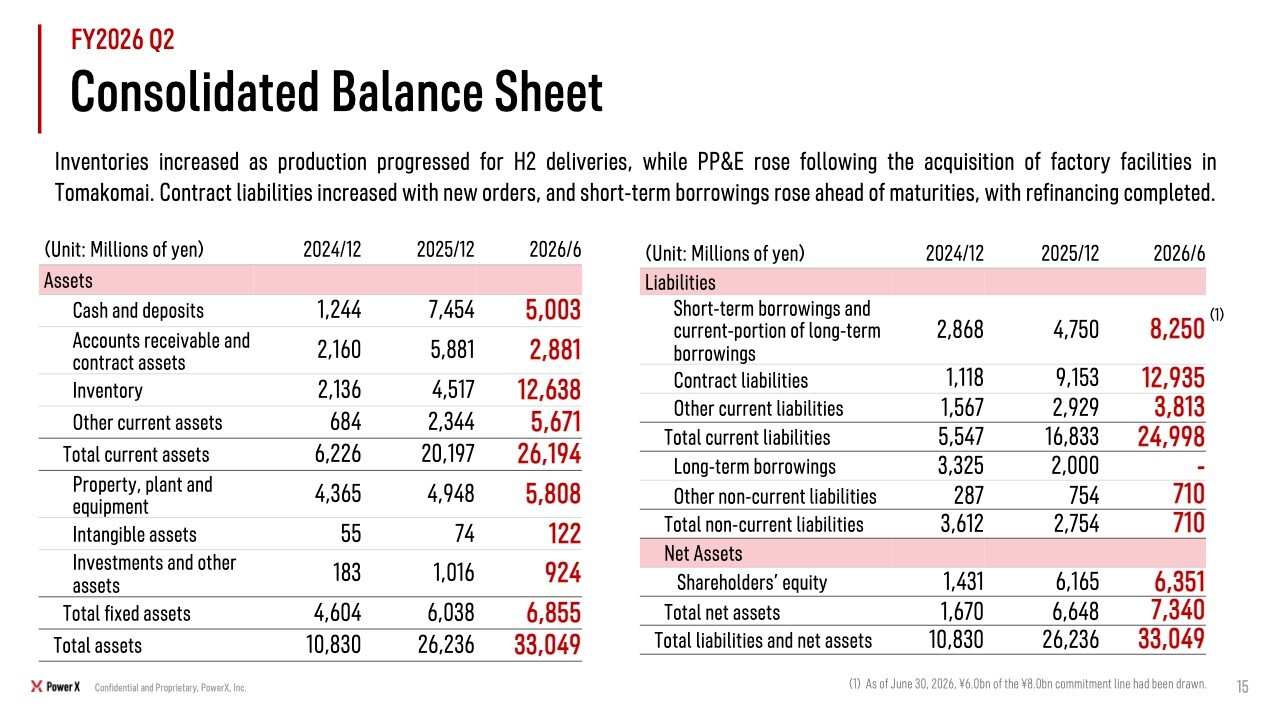
Turning to the consolidated balance sheet, as we have already explained, inventories are high because we are ramping up production and building inventory for deliveries in the second half. We expect this inventory to be converted progressively into revenue during the second half.
On the liabilities side, contract liabilities represent advance payments received from customers. As discussed earlier in relation to signed orders, we often receive advance payments at an early stage after an order is placed, so the increase in contract liabilities is consistent with the growth in our order backlog.
With regard to borrowings, refinancing and other factors have resulted in some long-term borrowings being reclassified as short-term borrowings, while total borrowings have also increased. I will explain this in more detail later.
Consolidated Cash Flow
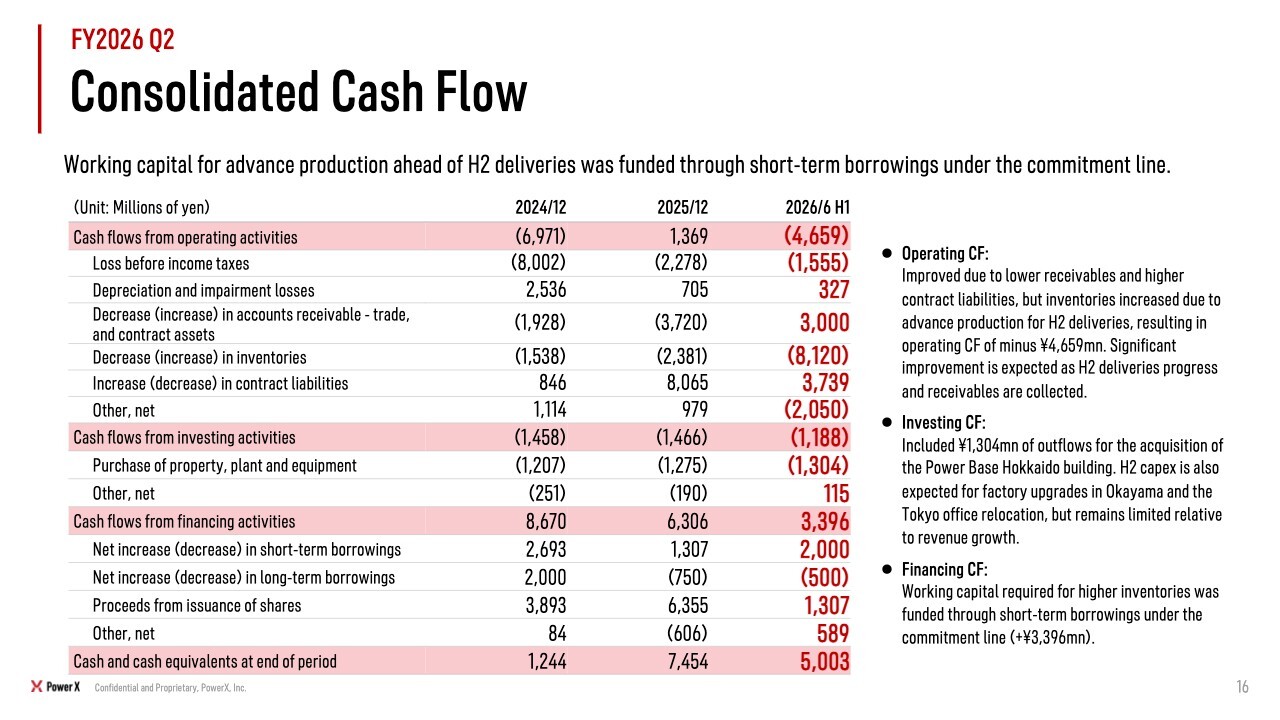
Let me explain consolidated cash flow. Operating cash flow is inevitably substantially negative in the first half because revenue is weighted toward the second half. We view this as an unavoidable feature of the business. However, we expect a substantial improvement during the second half as profitability improves and inventory is sold down.
Investing cash flow was affected by the acquisition of the factory in Tomakomai, Hokkaido, while financing cash flow mainly reflects the borrowings discussed earlier.
Capital Allocation Approach
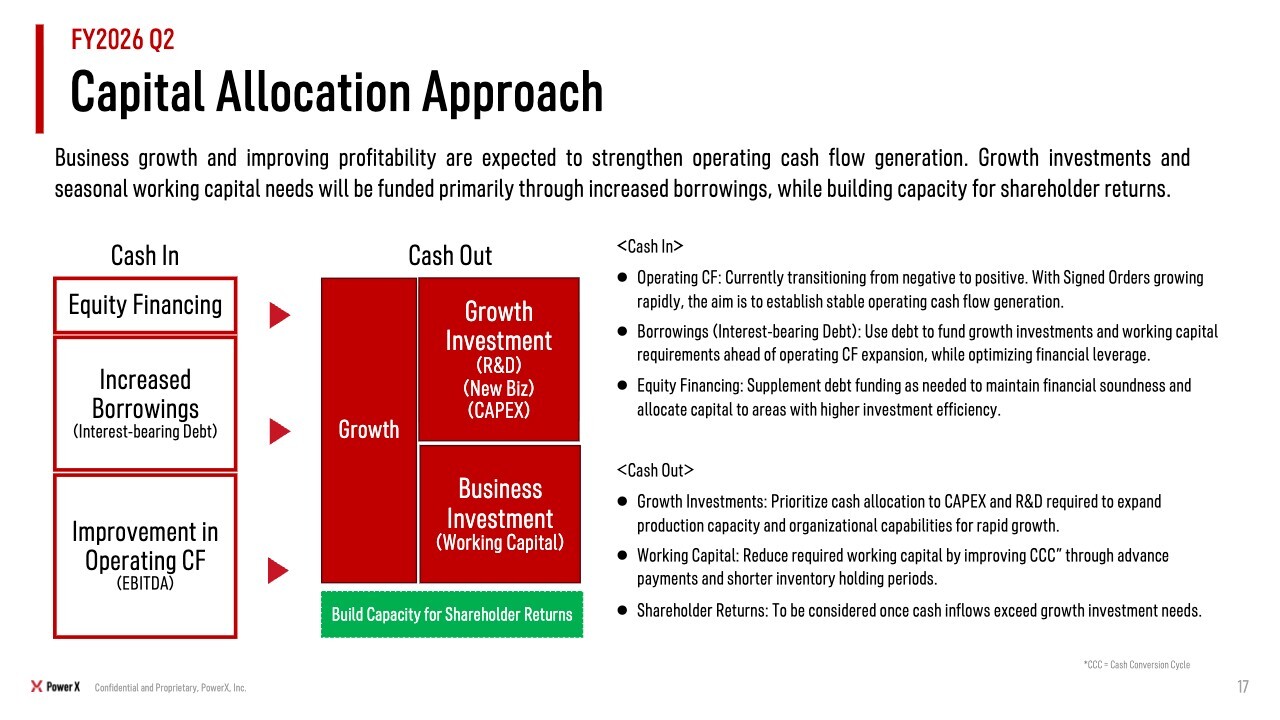
Starting this time, we have added an explanation of our capital allocation approach. On the cash-in side, a very important point is to achieve profitability this fiscal year through business growth and increase operating cash flow. For any remaining funding needs, we intend to rely primarily on increased borrowings while maintaining the high level of trust we have earned from financial institutions.
On the cash-out side, we will of course make the R&D and capital expenditures, or CAPEX, required to fund growth. We will make the investments that are necessary, but we have adopted an asset-light business model. We are therefore reviewing our approach somewhat so that CAPEX can be used more efficiently to generate returns.
Ultimately, we believe it is very important to build capacity for shareholder returns. As we optimize cash inflows and outflows, our progress toward profitability—even though some areas remain in the red—is creating scope to pursue initiatives of this kind. We intend to continue taking a proactive approach.
Capital Allocation Approach
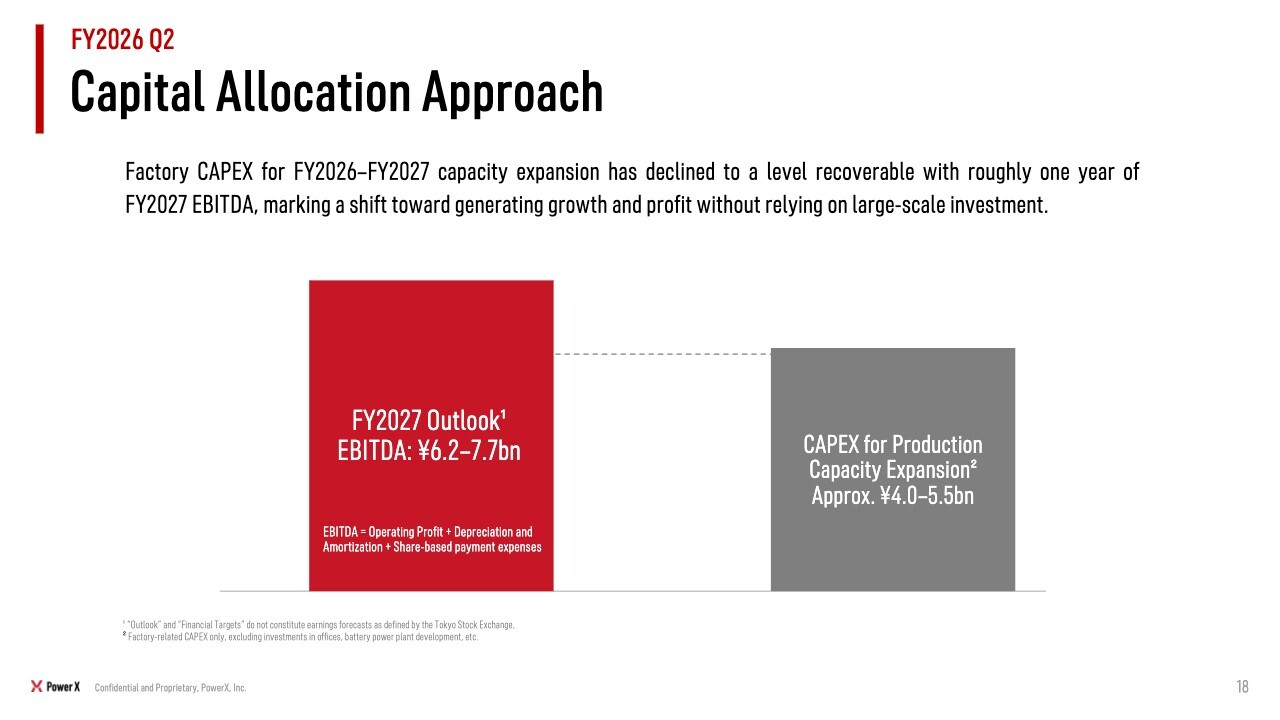
Let me add a little more detail. We are presenting an indicative outlook for FY2027 this time. Based on the EBITDA we expect next fiscal year and the revised amount of investment required to expand production capacity, we believe next fiscal year's EBITDA will be sufficient to fund our near-term CAPEX within a single year.
We have set a very important goal of further increasing free cash flow. Our policy is therefore to increase EBITDA while keeping CAPEX as low as possible and steadily improving profitability.
Borrowing Status
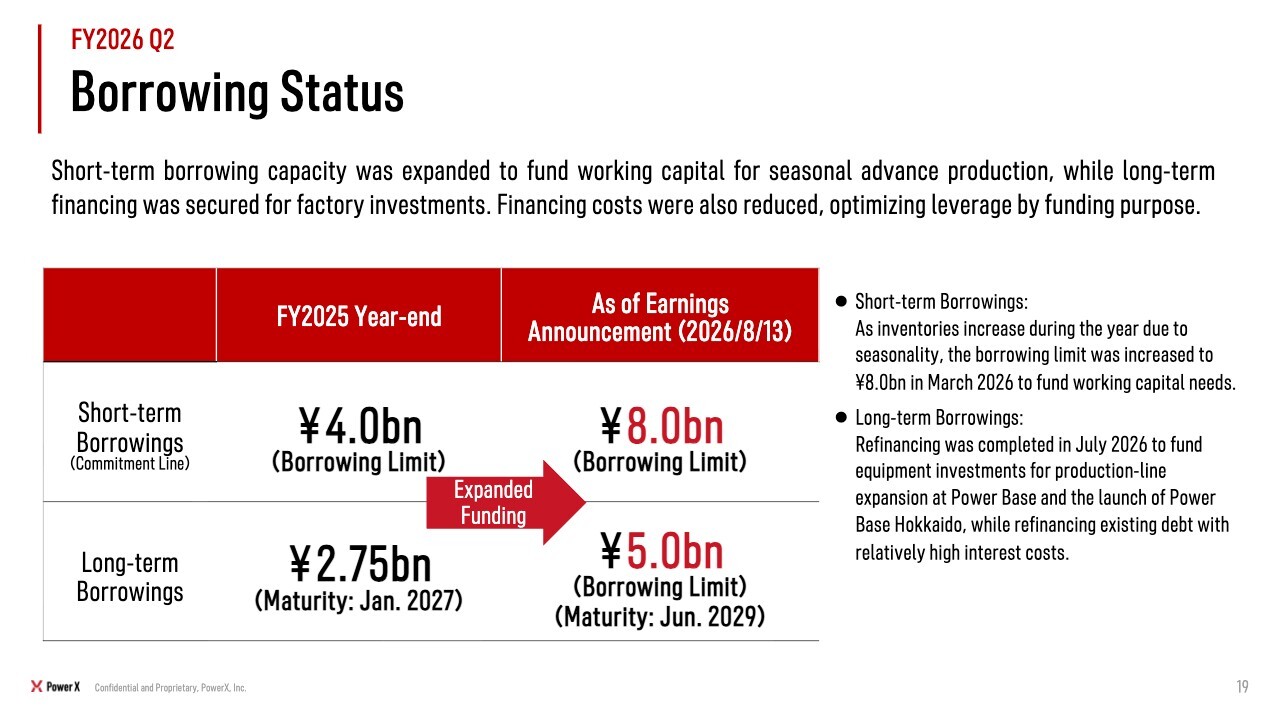
We disclose our borrowing activities on a timely basis. Backed by the strong trust of financial institutions, our order backlog has continued to grow and the visibility of future earnings is viewed as high. As a result, both our short-term and long-term borrowing capacity has been expanding. Under these circumstances, we intend to make active use of borrowings while maintaining financial soundness.
Changes to Use of IPO Proceeds
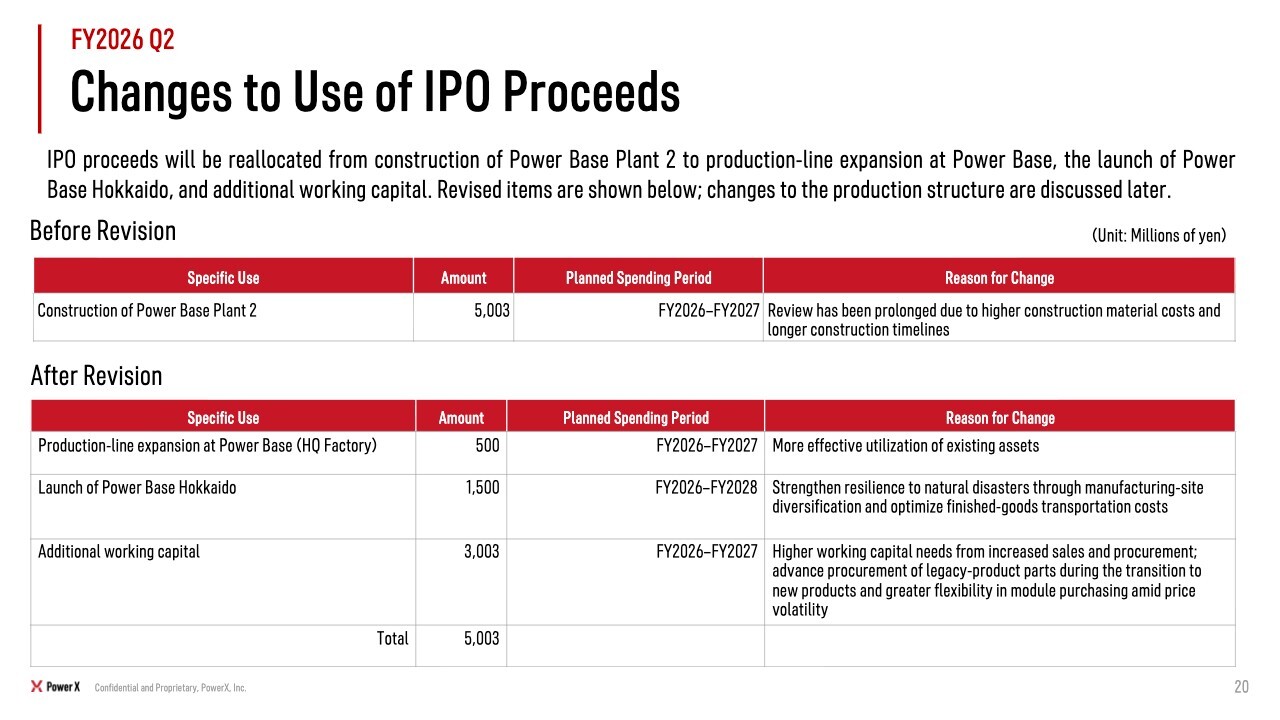
Next, I will discuss the equity financing associated with our IPO. We have partially changed the use of proceeds.
Our original plan was to construct a large second factory next to the existing Power Base. We have now reallocated the IPO proceeds to production-line expansion at the existing Power Base, the launch of Power Base Hokkaido in Tomakomai, and the additional working capital required to address our pronounced seasonality. We will also make use of the borrowings discussed earlier to meet our funding needs.
This change is part of our effort to generate free cash flow by utilizing our existing assets and continuing to grow while minimizing CAPEX as much as possible.
Changes to Mega Power Production Structure and Outlook
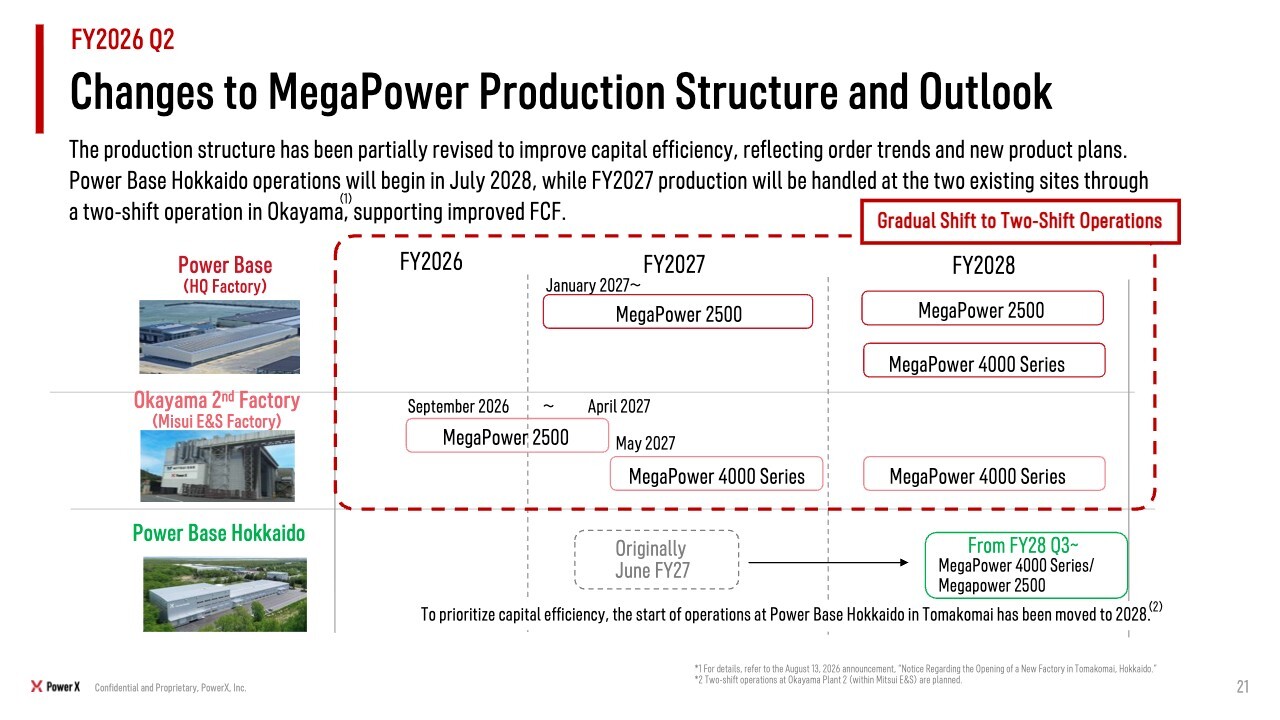
This slide shows our three factories: the current Power Base, Okayama Plant 2, and the Hokkaido factory. We have pushed back the start of operations at the Hokkaido factory slightly. To avoid any misunderstanding that this reflects weak business performance, let me explain that we now have a clearer path to moving the two existing factories to two-shift operations, and we are therefore considering making maximum use of those existing facilities.
The Hokkaido factory is in an excellent location and has good facilities, so we want to keep it in a condition that allows us to use it whenever needed. However, for the purpose of optimizing CAPEX, we determined that slightly delaying its start-up and shifting the existing plants to two-shift operations would improve overall capital efficiency.
Production Capacity
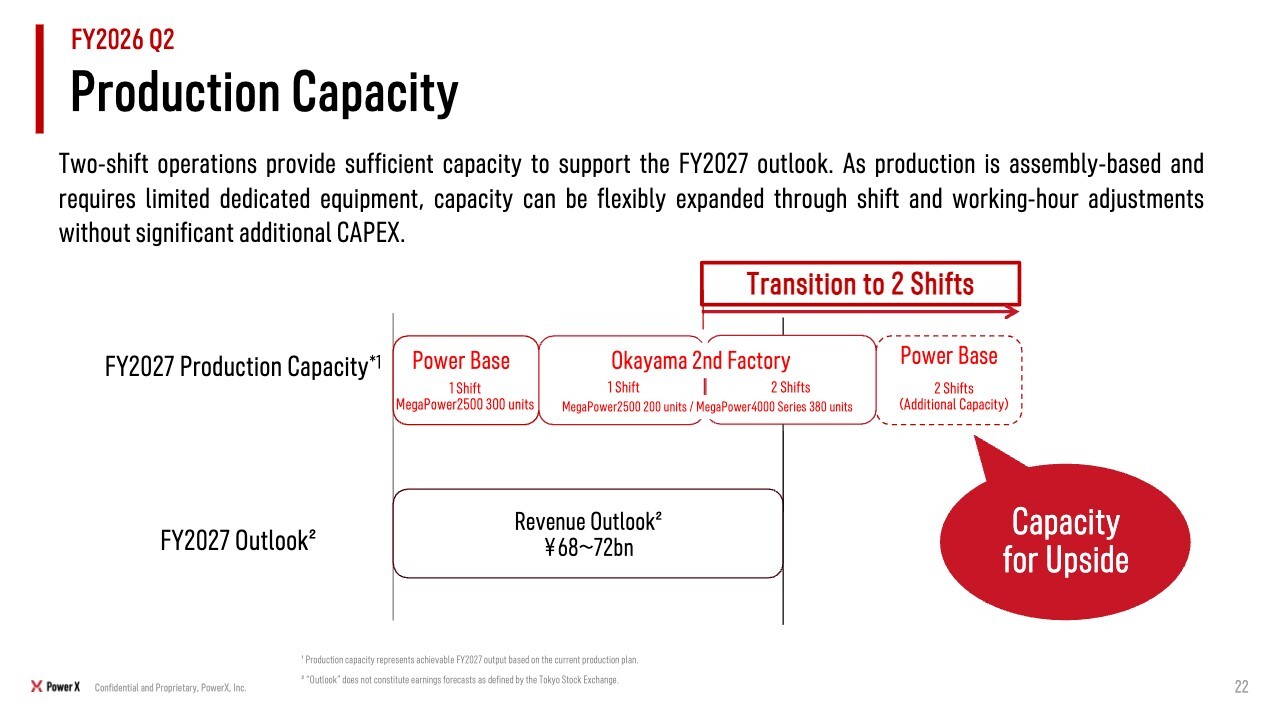
Turning to production capacity, we have disclosed part of our FY2027 outlook this time. Moving to two-shift operations will provide substantial headroom, so we do not believe there is any need for major concern.
That concludes my presentation. Thank you very much.
Breakdown of backlog (including probable orders) - by fiscal year
Ito: I will now explain the status of our businesses. Mr. Fujita has discussed the order backlog and future outlook from a financial perspective, and I would like to add some comments from the business side.
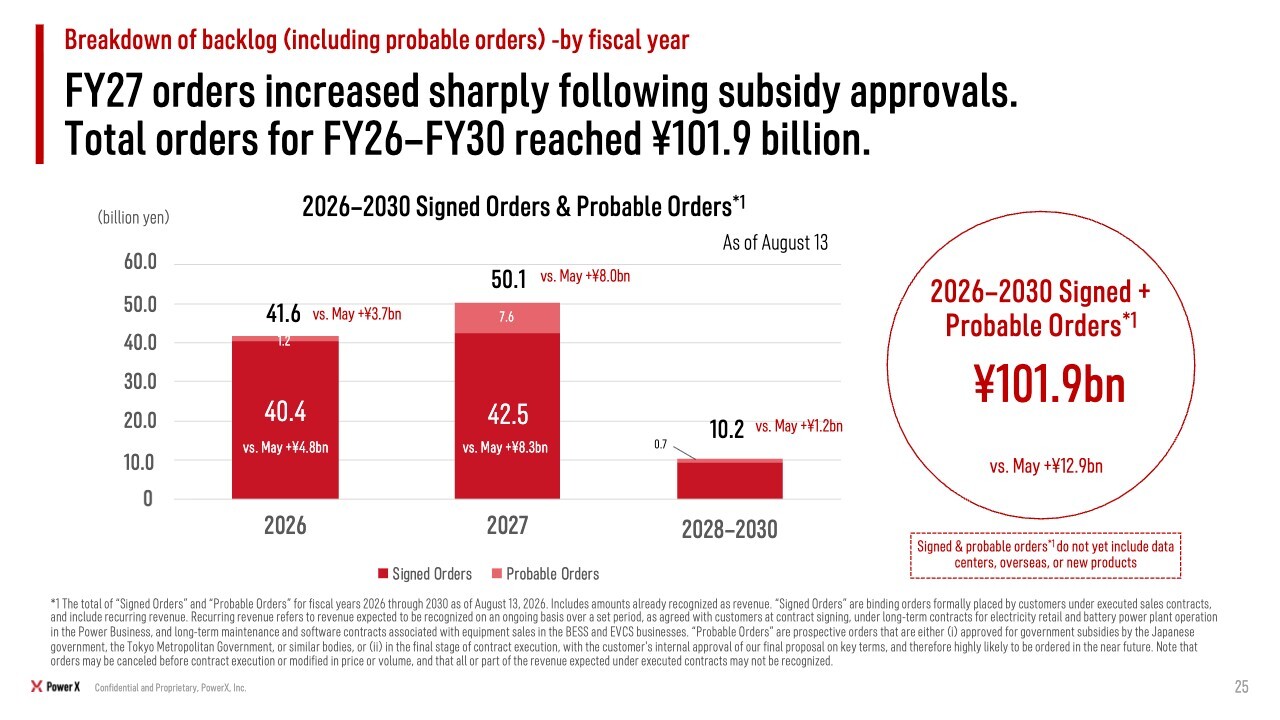
For projects contracted for delivery within this fiscal year, current orders total ¥41.6 billion, up ¥3.7 billion from May. For FY2027, current orders total ¥50.1 billion, up ¥8.0 billion from May.
For FY2028 and beyond, orders increased by ¥1.2 billion from May, bringing total orders for FY2026 through FY2030 to ¥101.9 billion. Orders have increased by ¥12.9 billion in the three months since our previous earnings briefing.
Let me also explain what we mean by probable orders, as there may be new investors joining us today. At PowerX, probable orders are projects for which the customer has indicated an intention to place an order and a purchase order has been issued, or projects for which a subsidy has been approved, production is effectively certain, and the customer’s internal approval has been obtained, but the sales contract has not yet been executed.
Once a contract is executed, if the order exceeds 10% of the previous fiscal year’s revenue, timely disclosure is required.
Last year's revenue was ¥19.3 billion. Accordingly, an order of ¥1.9 billion or more would be subject to timely disclosure. To avoid surprising investors when such disclosures are made, the slide identifies amounts included in our budget and amounts not included in our budget.
The ¥7.6 billion shown in pink on the slide represents probable orders. If these are converted into contracts, they are within budget, while anything beyond that would be outside the budget. We will continue presenting the information in this way. The recent trend is that orders have increased significantly over the past three months.
Financial Outlook for FY26 and FY27
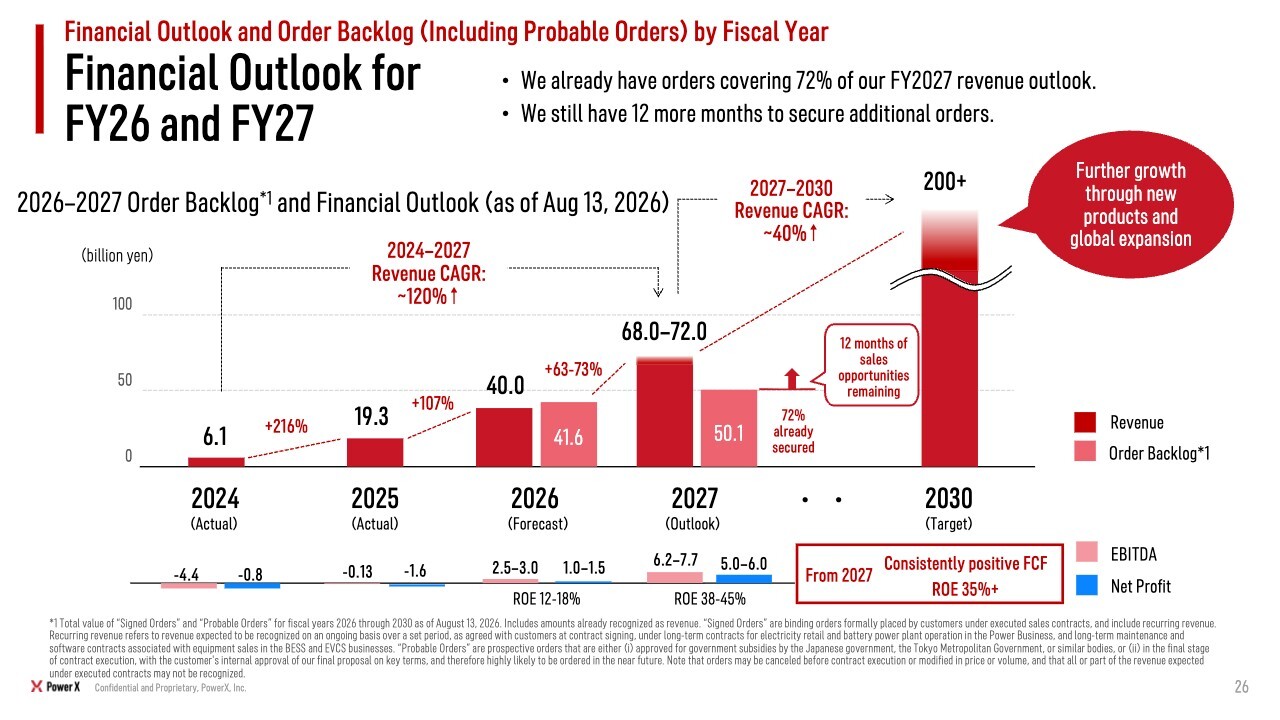
Let us take a step back and look at the business from a broader perspective. PowerX was founded in 2021, and our first revenue was ¥300 million in 2023. Revenue then rose to ¥6.1 billion in 2024 and ¥19.3 billion in 2025. We expect ¥40.0 billion this year and ¥68.0 billion to ¥72.0 billion next year, maintaining a very high growth rate.
Taking the midpoint of our expected FY2027 revenue range of ¥68.0 billion to ¥72.0 billion gives approximately ¥70.0 billion. Of that amount, ¥50.1 billion has already been ordered. Against the remaining ¥19.9 billion needed to reach ¥70.0 billion, we received ¥12.0 billion of orders in the past three months, and we still have another 12 months of sales opportunities. We also have ample factory capacity.
Taking into account the recent trends and overseas projects that I will discuss shortly, we will continue aiming even higher as a company. We intend to devote our full efforts to sales activities over the remaining 12 months.
As for our 2030 target, we believe that sustaining rapid growth is part of the Company's purpose. As I will explain later, we see a great many growth opportunities and are targeting revenue of more than ¥200.0 billion by 2030. To achieve this, we are developing new products and preparing for overseas expansion. We want to become an outstanding company that is highly valued by the market.
For those who may have recently purchased our shares, let me reiterate our business model. We manufacture batteries for customers who place orders with us, prepare the products at our facilities, deliver them, and recognize revenue at that point.
From 2024 through 2026, revenue progress has consistently been weighted toward the second half. More specifically, revenue tends to increase sharply in the third and fourth quarters. This means we need to store batteries in advance, and costs such as the storage fees discussed earlier are factored into our plan. Everything is proceeding as planned, but without this explanation, some investors looking only at an individual quarter’s results might be surprised.
Pipeline Toward FY30
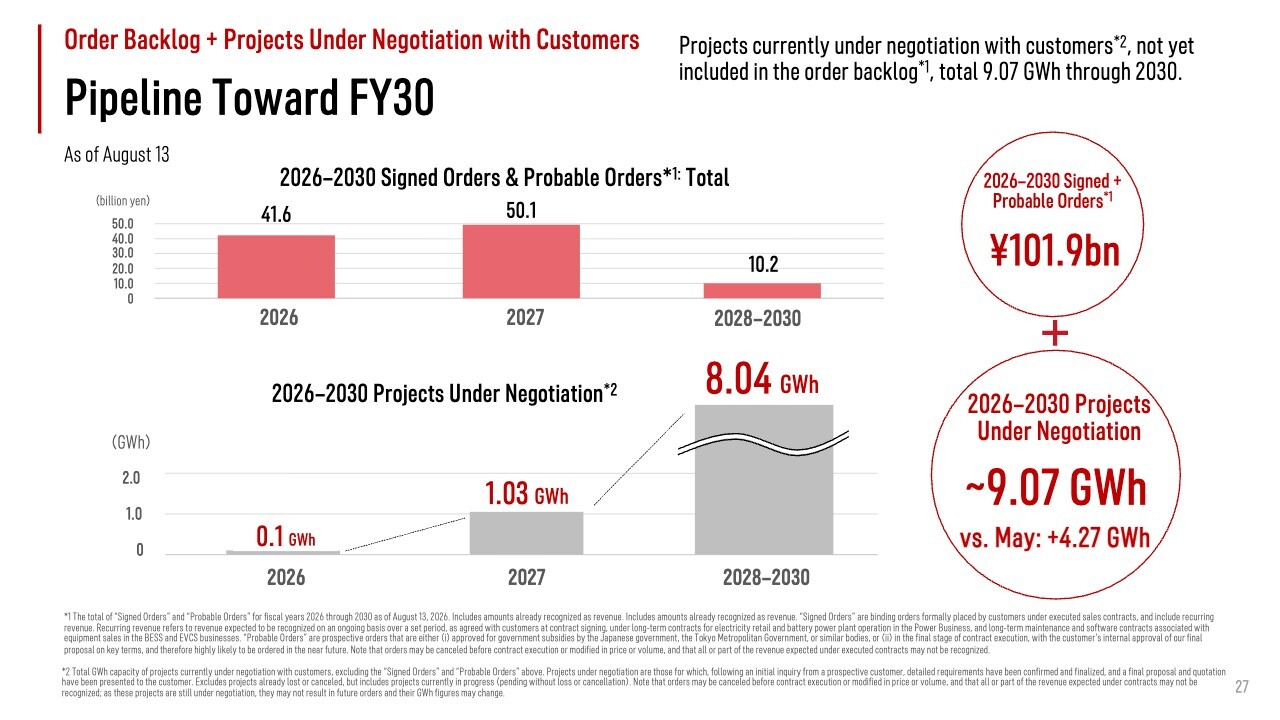
The volume of projects currently under negotiation has doubled over the past three months. I would like you to view the ¥101.9 billion order backlog as one important indicator. Looking beyond that, the volume of projects under negotiation increased by 4.27 GWh to 9.07 GWh.
The number of projects has therefore increased significantly, and we currently have many opportunities for 2028, 2029, and 2030. We are continuing to work to convert each of these projects into firm orders.
Extra-High-Voltage Projects Dominate the BESS Pipeline
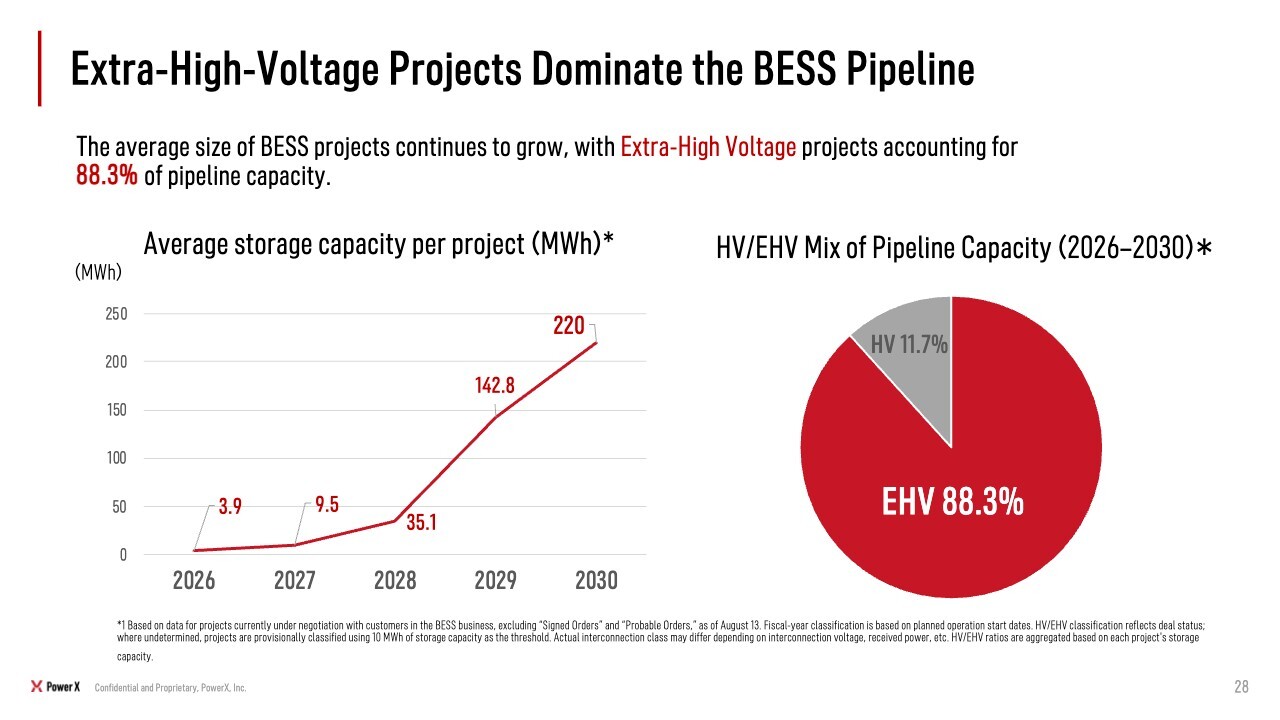
In terms of recent trends, extra-high-voltage, or EHV, projects continue to account for a large share, as they did previously. At present, 88.3% of the projects, or nearly 90%, are large-scale projects. There are relatively few small projects, and we now have projects involving 20 or 30 batteries, as well as 100 or 200 batteries, moving forward.
Current Pipeline Includes BESS Only
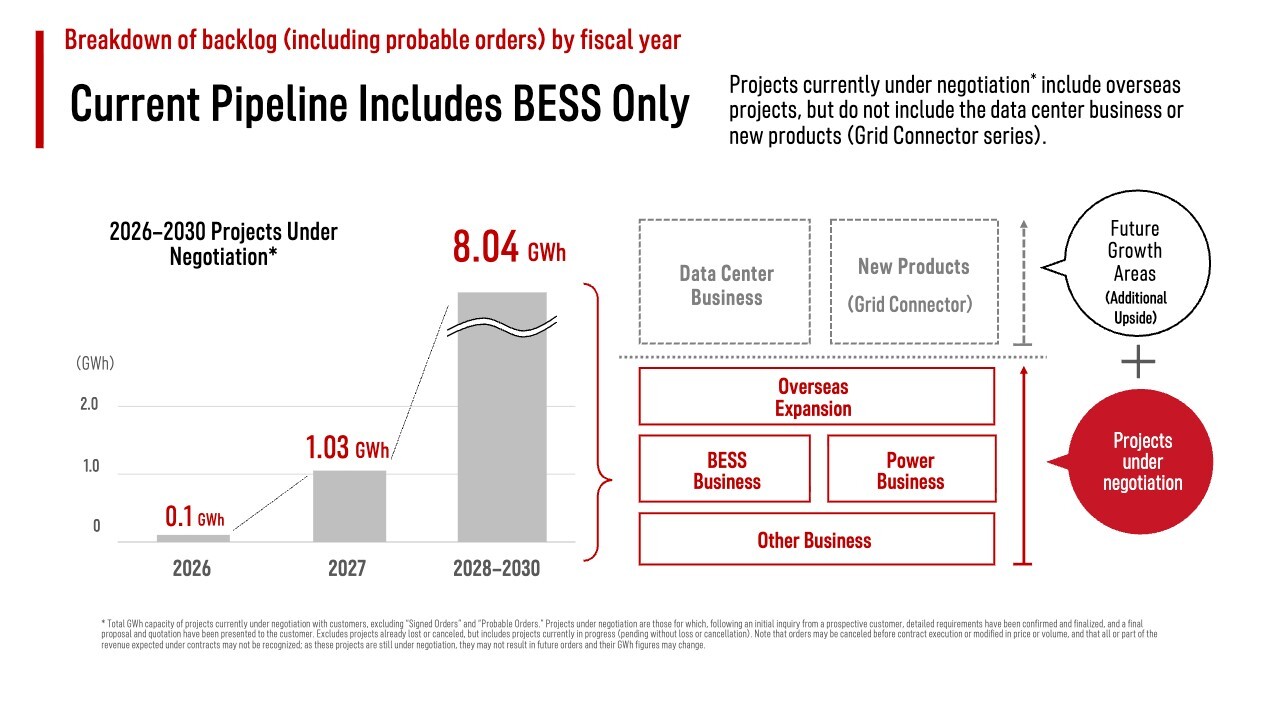
We are often asked whether data center products and Grid Connector, our new product, are included here. They are not yet included in next year's order backlog, nor have we included them in our outlook.
We have received many inquiries and will of course work to win these projects. Any orders we secure would represent upside. We are therefore continuing our efforts in the hope that data center products and new products will provide upside to the base case.
New Product Summary
We developed new products and announced them about a week ago. I hope you will watch the video; please scan the QR code in the upper-right corner of the slide to access it. I will provide a brief digest here.
New Product Positioning Map
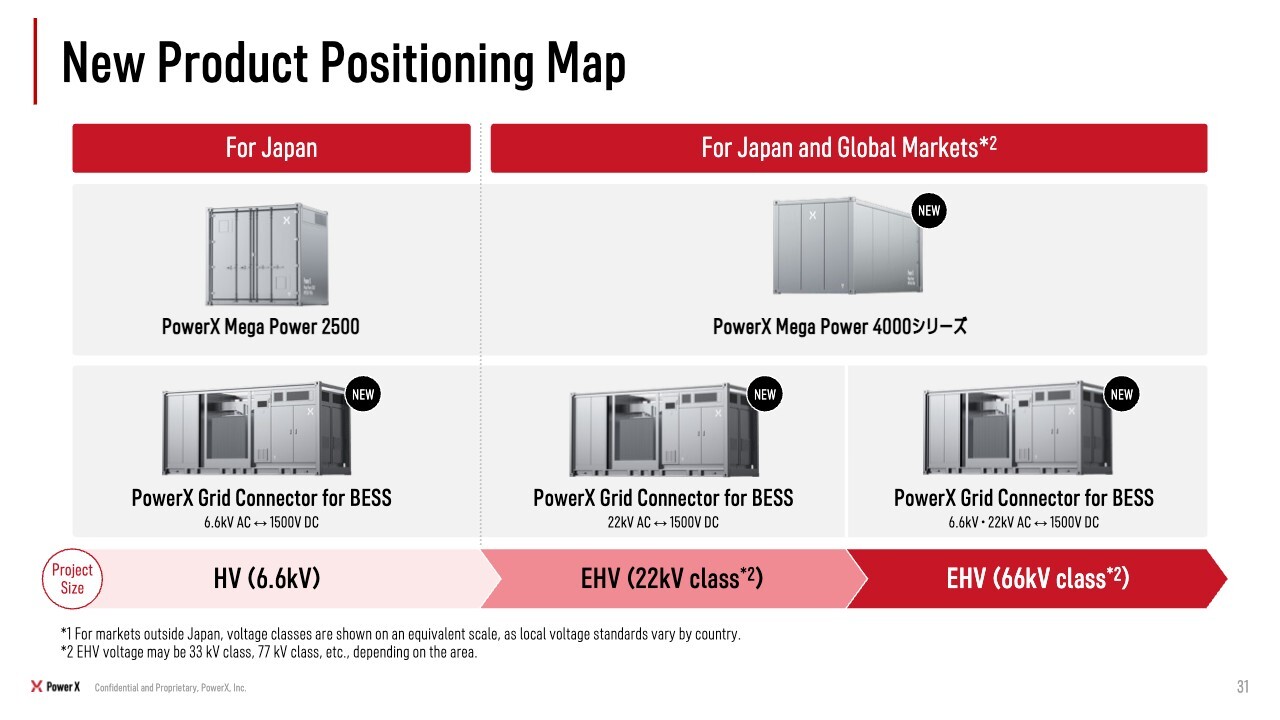
This is what our product lineup now looks like, including the new products. Mega Power 2500, which is focused on the Japanese market, is a 10-foot battery system designed to be very easy to transport under Japan’s road traffic regulations. We are grateful to have received a very large number of orders, and currently have orders for more than 400 units.
In addition, as large-scale projects have increased, we have needed larger battery systems. Overseas markets also require even larger batteries. Against this backdrop, we developed the Mega Power 4000 Series.
Until now, we manufactured the battery systems themselves in-house and procured the surrounding equipment from third parties. Under this approach, however, we had to provide engineering work on peripheral equipment with very low gross margins. To improve this situation, we developed Grid Connector as a stand-alone product that integrates the peripheral equipment.
For Grid Connector, we built out the product lineup for voltage classes including 6.6 kV, 22 kV, and 66 kV. The purpose is to support large projects in Japan and win projects overseas.
Mega Power: Setting a New Standard for BESS Safety and Resilience
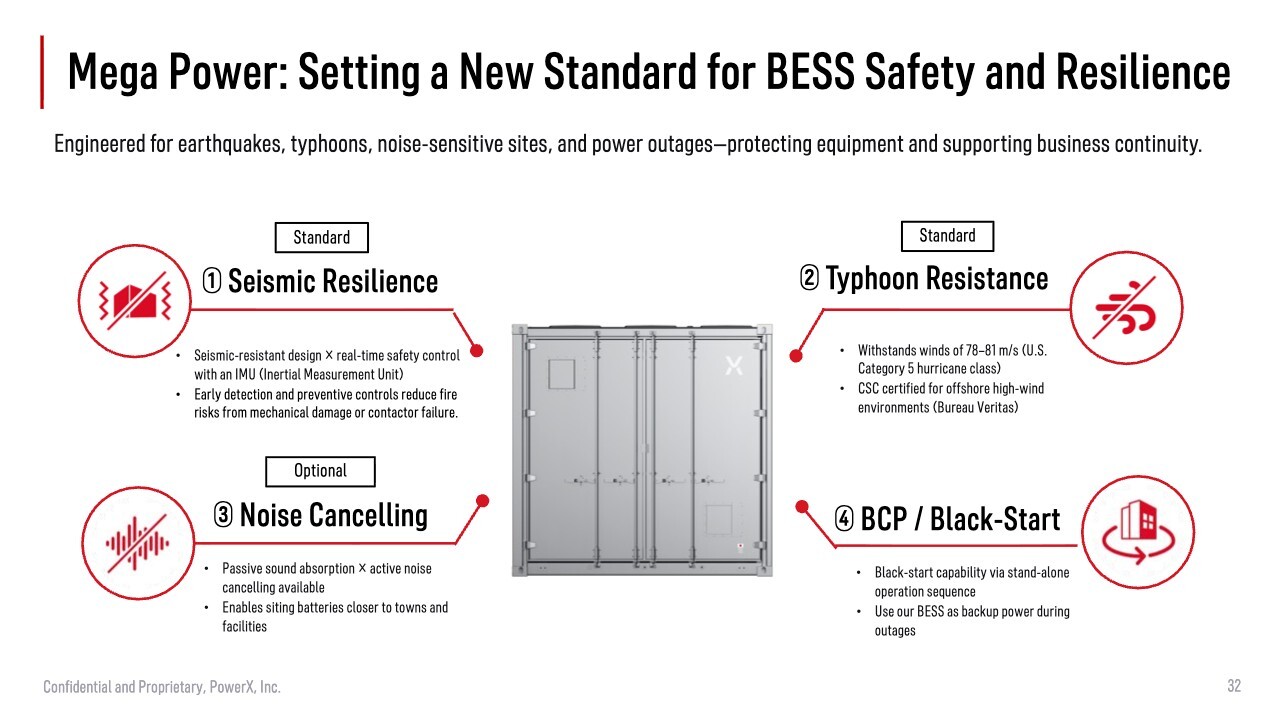
In Japan, people used to tell us that a battery was simply a box that stores electricity and that Japanese manufacturers would ultimately lose to Chinese competitors on price. More recently, however, we have been receiving a very positive response even in overseas markets.
We believe this is because we add substantial value. For example, our products are not simply batteries. They are designed to withstand very strong earthquakes and typhoons, and noise-cancelling technology can provide a quieter environment for nearby residents.
Our batteries are selected because they offer a range of additional value, including black-start capability that enables the system to restart itself during a power outage, as well as extremely strong information security.
Mega Power 4000 Series Specification
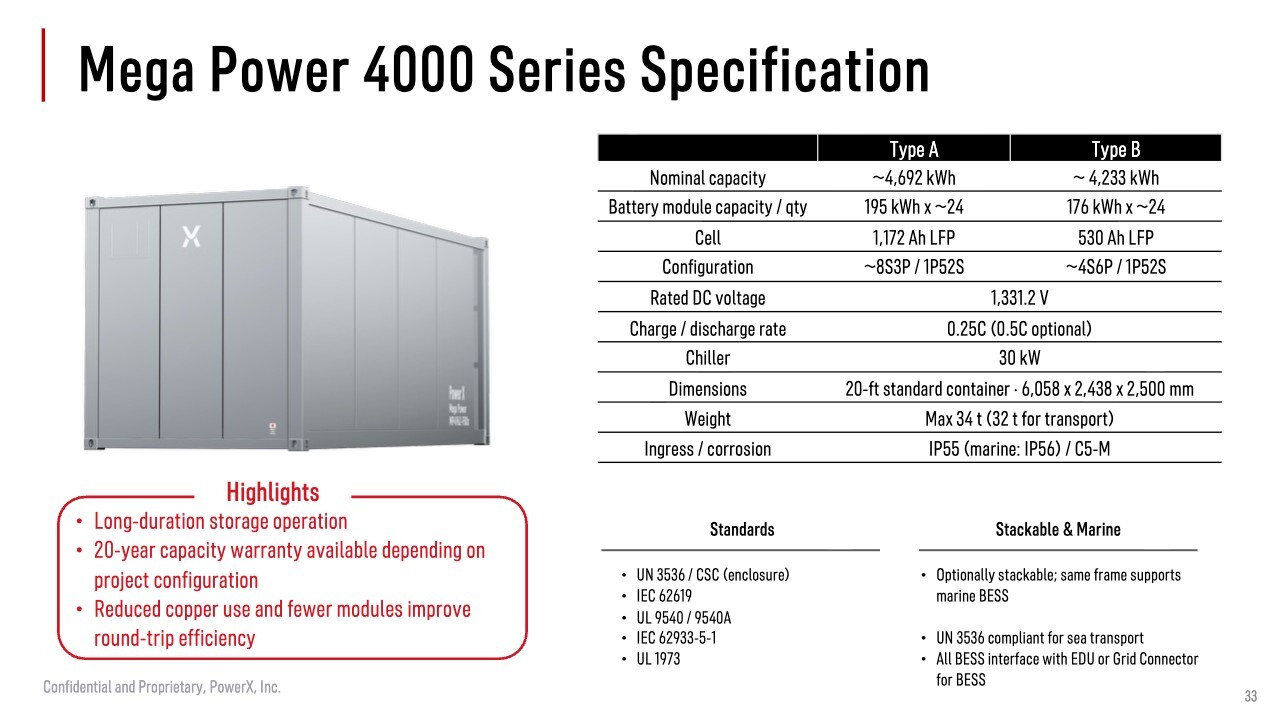
Regarding the Mega Power 4000 Series, I would like investors to understand that there are Type A and Type B models. The country of origin of the battery modules differs between Type A and Type B. In some overseas markets, it may be preferable for the modules not to originate from a particular country.
We can procure cells from a variety of sources and package them into products. We therefore offer two models, with capacities of 4.6 MWh and 4.2 MWh. The Mega Power 4000 Series uses a standard-height 20-foot container, making it lower than competing products that use high-cube containers.
Mega Power 4000 Series: High Capacity & Stackable
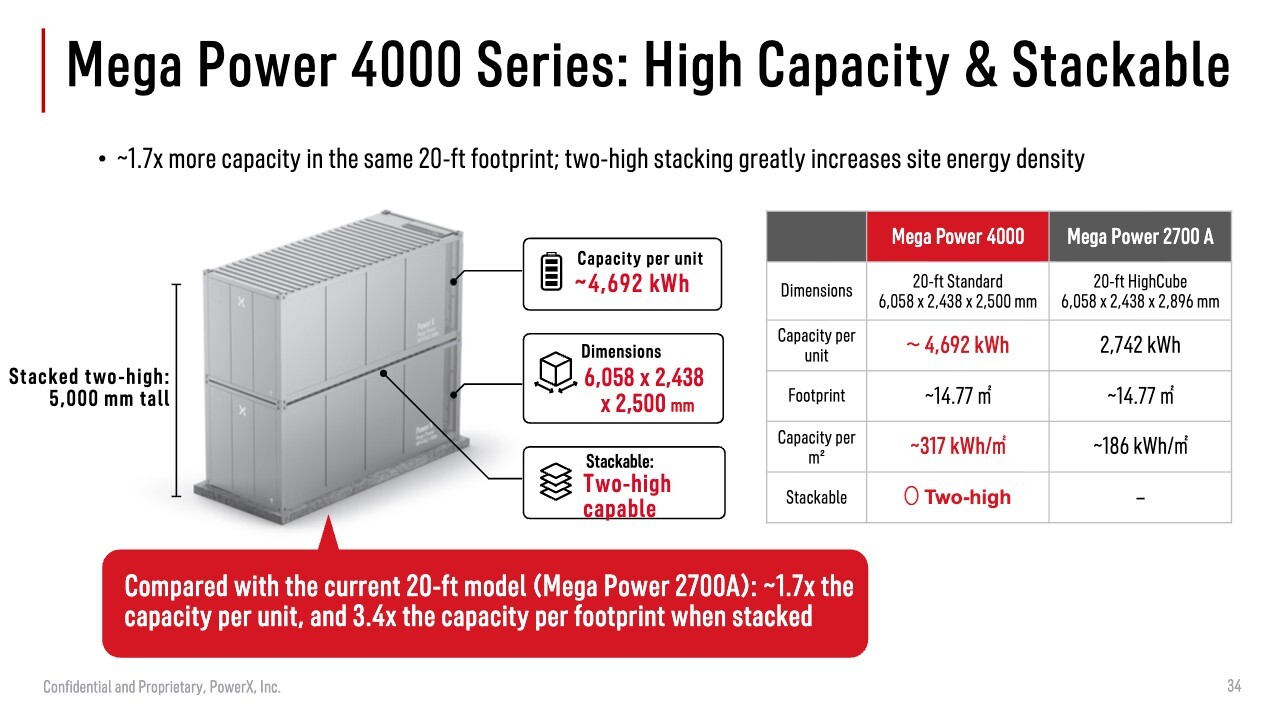
The reason, as shown on the slide, is that the units can be stacked. Stacking allows the system to fit into limited spaces, such as narrow sites or the edges of factory premises.
In fact, a project we won in Vietnam and will deliver shortly is located in an industrial park. The specifications are designed to accommodate the installation of many units in space-constrained locations such as industrial parks and solar power plants.
Mega Power 4000 Series: High-density, stackable design optimized for extra-high-voltage BESS projects
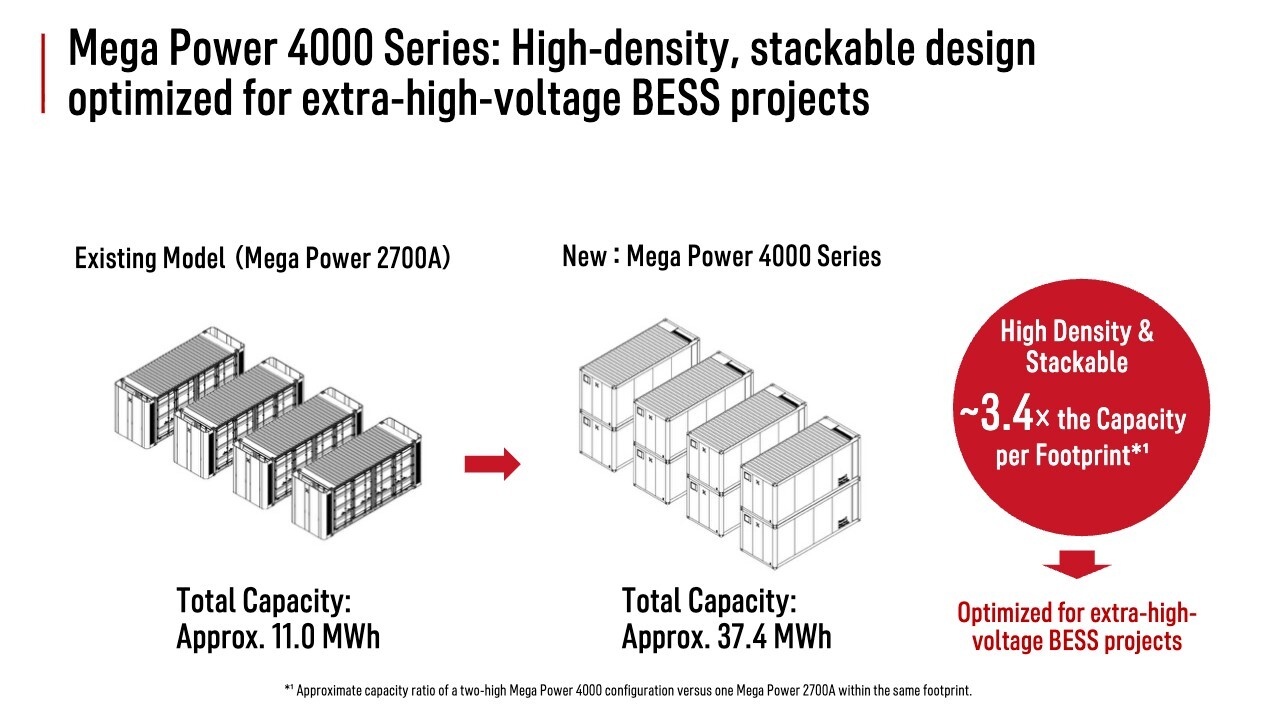
When stacked two-high, the new product provides approximately 3.4 times the capacity per footprint of our current model. Put simply, the same capacity can be installed in roughly one-third of the space. Securing sufficient land can be extremely difficult for very large projects that require hundreds of units, and this product helps solve that problem.
The product is highly compact and offers greater energy density, delivering approximately 9 MWh per 20-foot footprint when stacked two-high. It is fully competitive with overseas products in terms of both international standards and overall product performance. It also remains price-competitive as a next-generation product.
PowerX Grid Connector for BESS
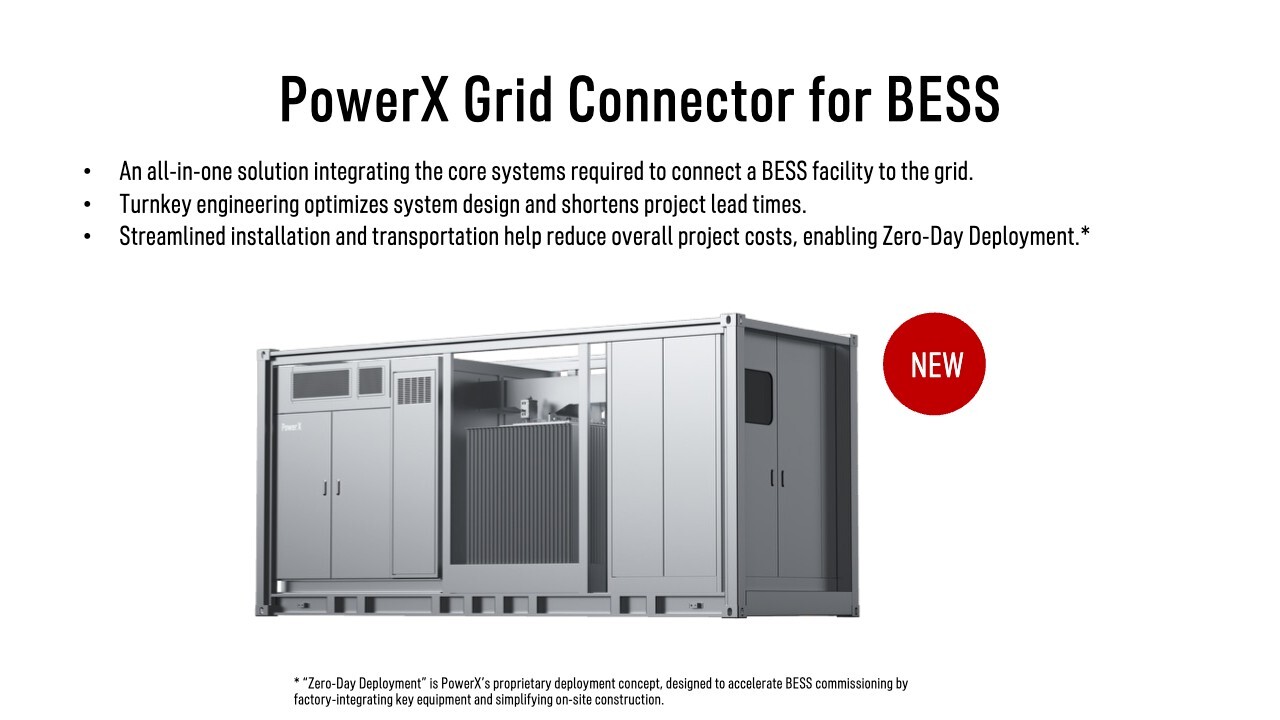
This is the Grid Connector for BESS.
Grid Connector for BESS: Zero-Day Deployment for Reliable, Cost-Effective Grid Connection
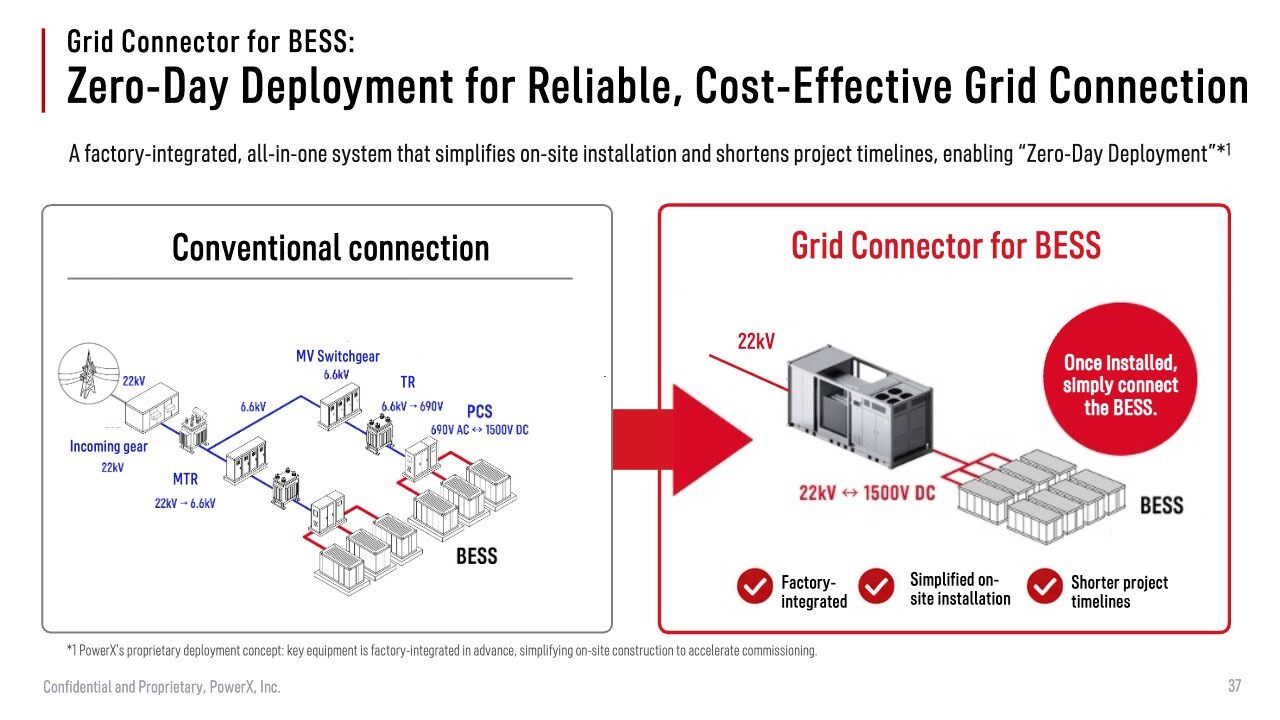
To connect batteries to the grid, the voltage environments are completely different: the batteries operate at 1,500 V DC, while the grid operates at 22 kV AC. Various circuit breakers, transformers, and other power-conversion equipment are required to avoid damaging the grid.
At PowerX, we procure all of this equipment for our customers. To be candid, however, we are procuring and delivering equipment that generates very little gross profit for us.
In addition, each time we do this, we have to create drawings for the battery power plant and carry out construction based on those drawings. High-voltage cables are buried underground, concrete foundations are installed for each piece of equipment, and only after several months of construction can the equipment finally be connected.
Furthermore, because all of the equipment comes from different manufacturers, the software integration required to connect the components also has to be handled on a project-by-project basis. Work of this kind has been one factor increasing the cost of battery storage systems.
We developed Grid Connector to reduce those costs substantially. Grid Connector can convert 22 kV directly to 1,500 V DC. It uses a skid based on the frame of a 20-foot container, allowing the factory-built system to be transported directly by truck and installed quickly on site.
This shortens the construction period and reduces costs. We are also no longer in an era in which only cell manufacturers can lower battery costs. Today, cells account for only about 40% of the total cost of a battery energy storage system.
Instead, to compete successfully, a product now needs to include the peripheral equipment, earthquake and typhoon resilience, security measures, and other functions, while also being easy to install. We developed this new product by focusing precisely on those points.
PowerX Grid Connector for DC
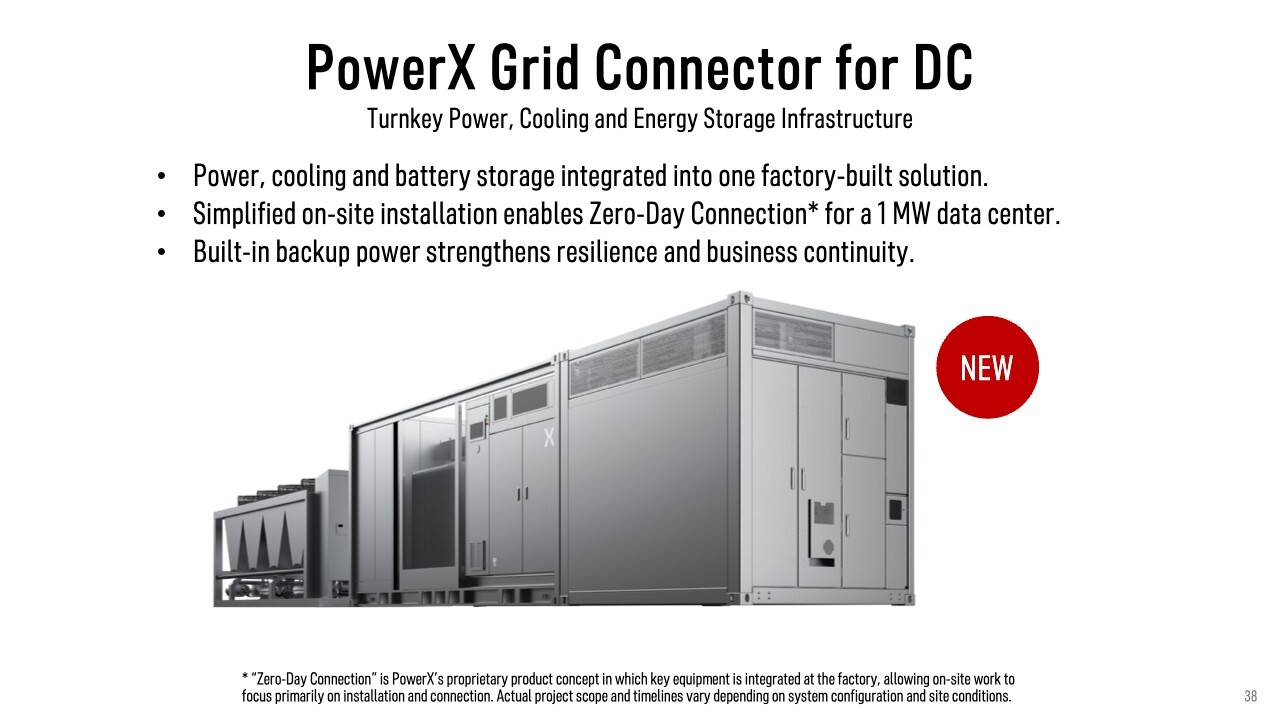
Next is Grid Connector for DC. When we visit customers, particularly overseas, discussions about batteries are almost invariably followed by discussions about data centers. The data center building itself can be constructed, but once all of the water-cooling equipment, emergency power supplies, converters, and other systems needed to support the servers are designed and engineered, the cost becomes extremely high.
Grid Connector for DC: Turnkey Power, Storage and Cooling for Zero-Day Connection*
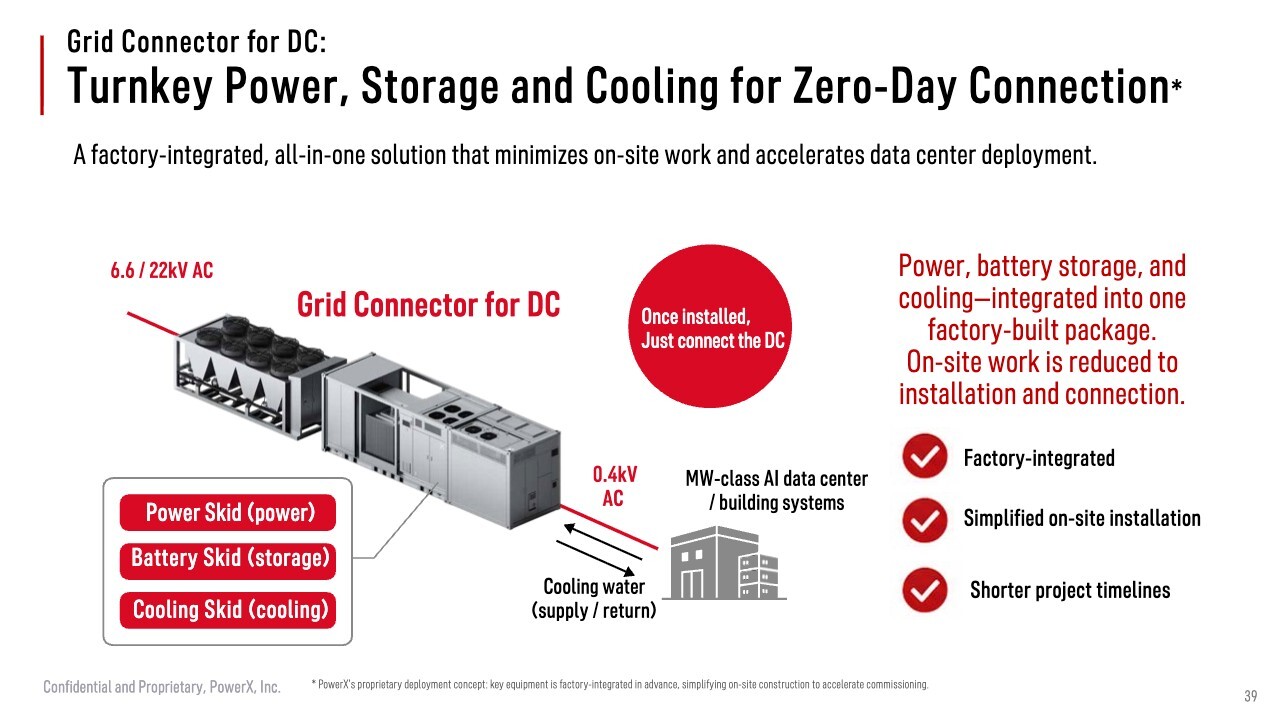
Let me explain this product in more detail. Like the battery system I just discussed, it is designed for data center applications. It incorporates a Mega Power 2500, our large grid-scale battery system, and is a redundant 2 MW system.
The system can output 1 MW through each of two completely independent circuits. For a 1 MW configuration, the package provides the required chilled-water cooling, 2.5 hours of UPS backup, and all necessary electrical infrastructure. The system can be delivered in just two or three truckloads, enabling rapid data center deployment. We are receiving many inquiries for this product and will work hard to secure orders for next fiscal year.
We are in fact making a certain level of investment in this area, which is one reason we did not revise this fiscal year’s profit forecast upward. We plan to install the equipment at our factory early in the new year, begin operating it, and actively demonstrate it to customers. We cannot generate sales without a first unit to show customers, so we intend to invest properly in this area.
Grid Connector for BESS: Components
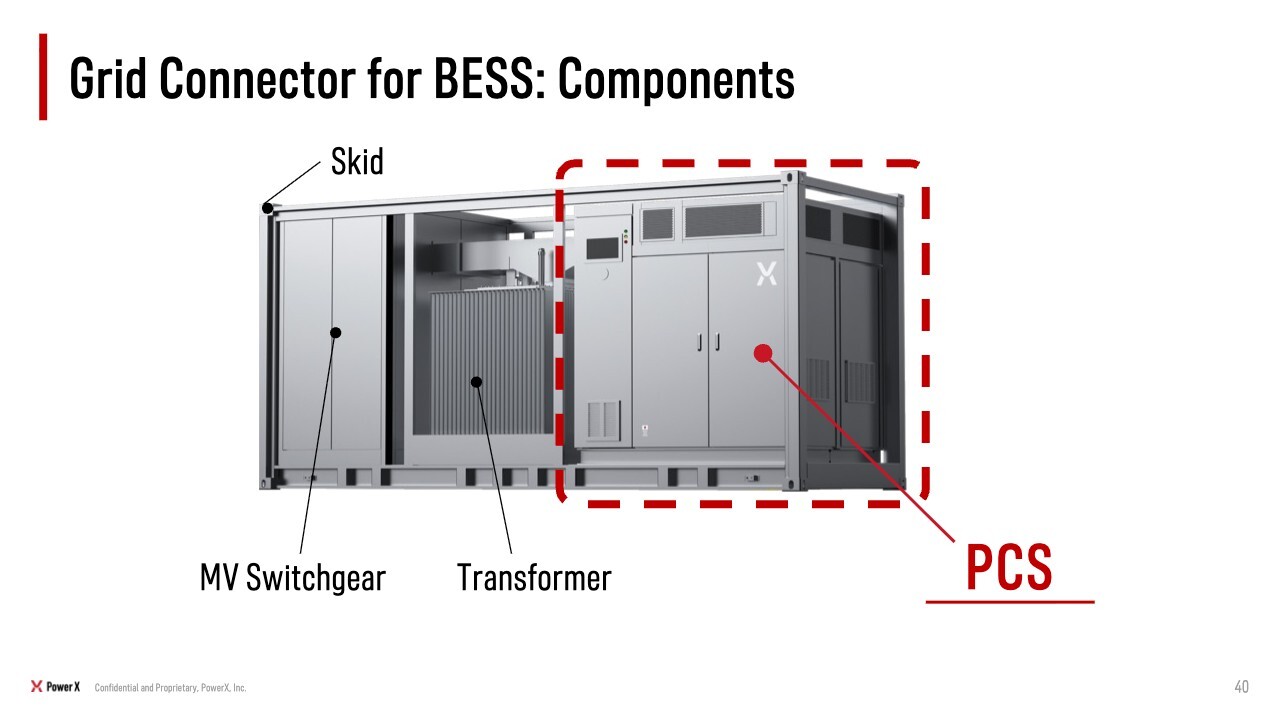
These systems include a power conditioning system, or PCS. The area inside the red dotted line around Grid Connector on the slide is PowerX’s in-house PCS. The PCS can also be purchased on a stand-alone basis, so of course we are selling it separately as well.
In-house PCS for Increased Efficiency and Profitability
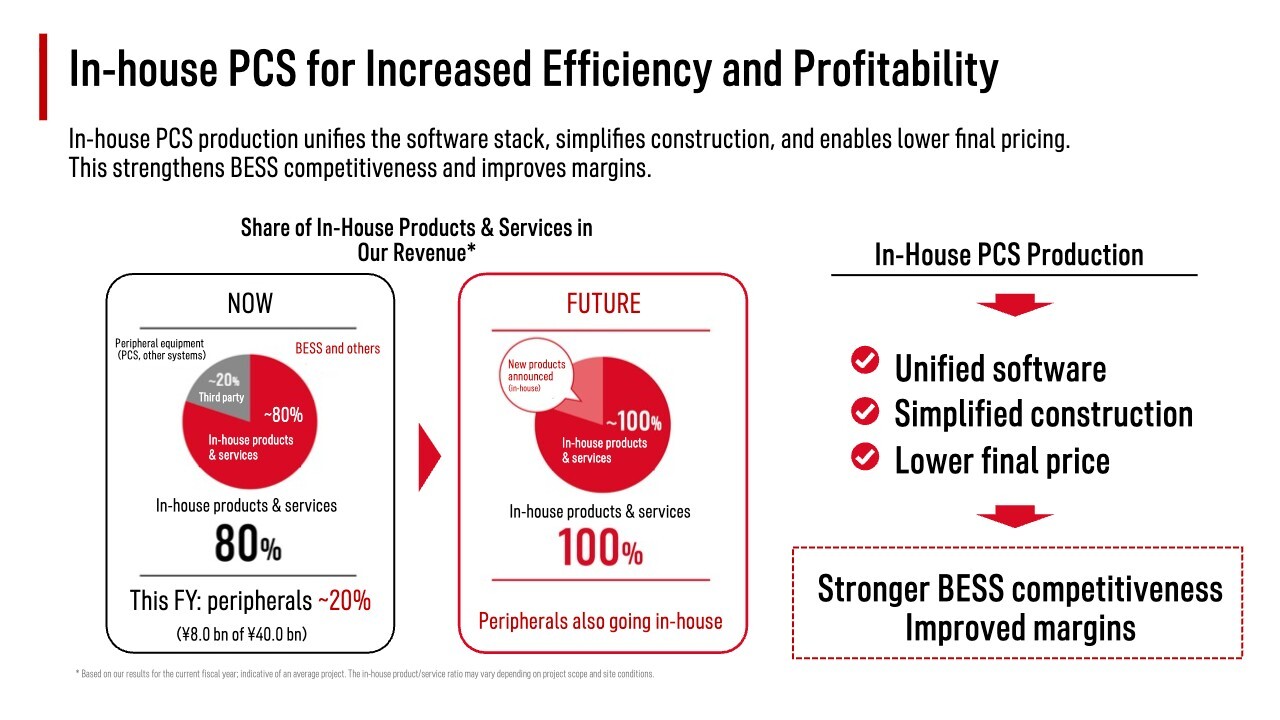
As you can see on the slide, we currently procure a variety of peripheral equipment, including the PCS I just described, but our plan is to bring all of these products in-house going forward. The PCS therefore plays a very important role. Compatibility with batteries and data centers is important, and we also determined that software offers significant scope for differentiation, which is why we developed the PCS ourselves.
Japan Grid-Scale BESS PCS: ¥90-100 Billion Annual TAM by 2030
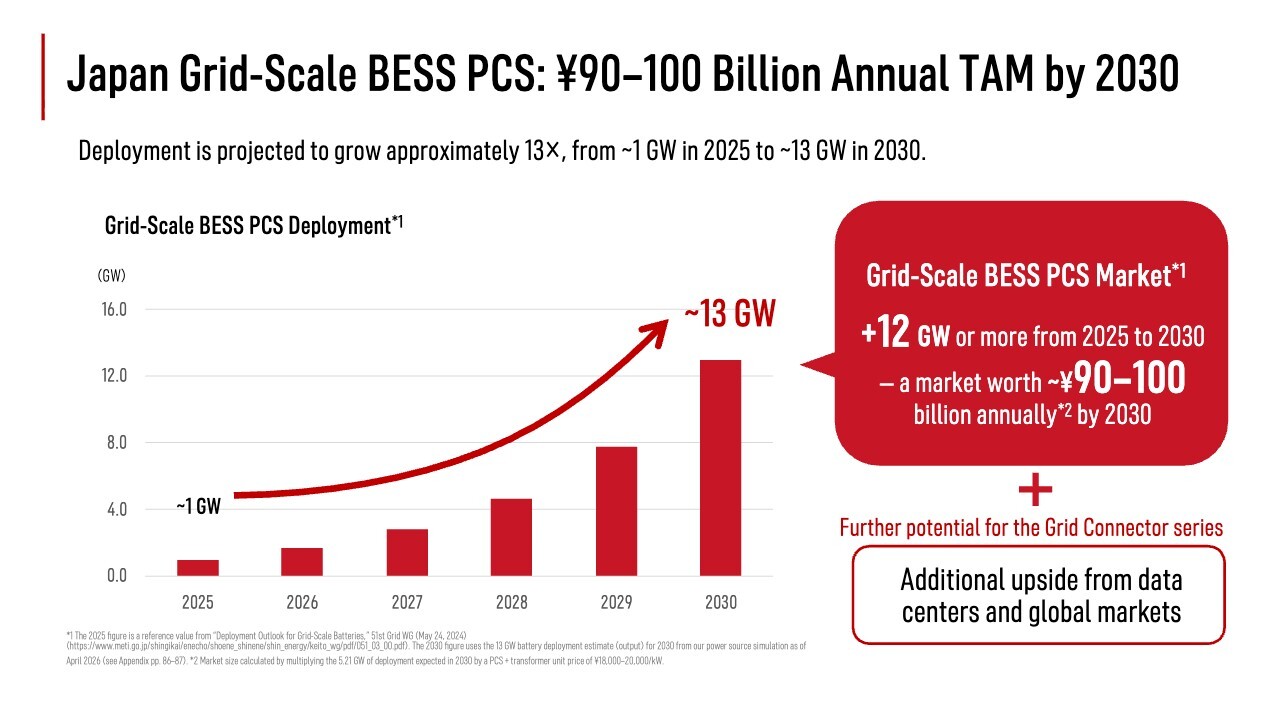
There is also a sizable TAM in Japan for the PCS alone. The market is approximately ¥100.0 billion annually, meaning that these large-scale PCSs alone offer substantial revenue potential. We therefore intend to establish this area firmly as a new segment.
BESS Deliveries and Installations Are on Track
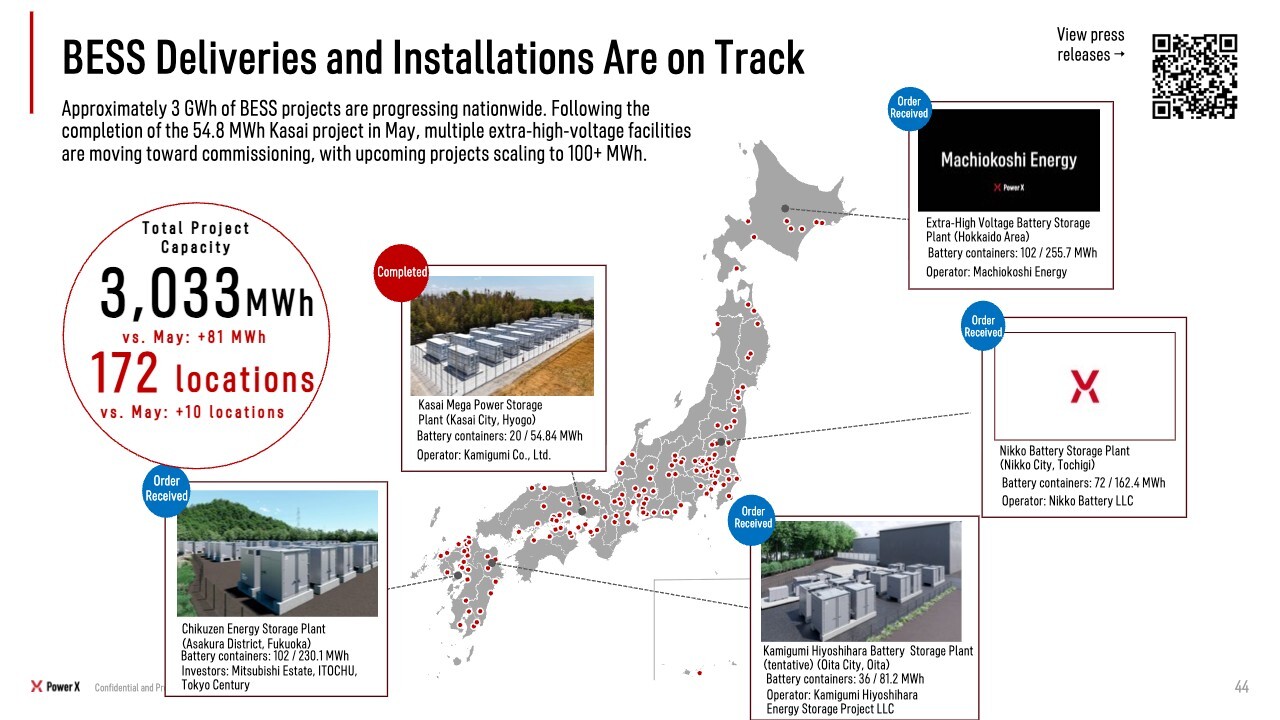
Let me explain the status of our sales operations and the BESS Business. Battery deliveries have now reached the 3 GWh scale and are being made to 173 locations on an ongoing basis. From Hokkaido to remote islands in Okinawa, customers across Japan have contracted for our products, and the systems are operating every day.
We are very pleased that our products are serving as important infrastructure. We will continue to advance this business steadily.
Large-Scale BESS Deliveries and Installations Are on Track
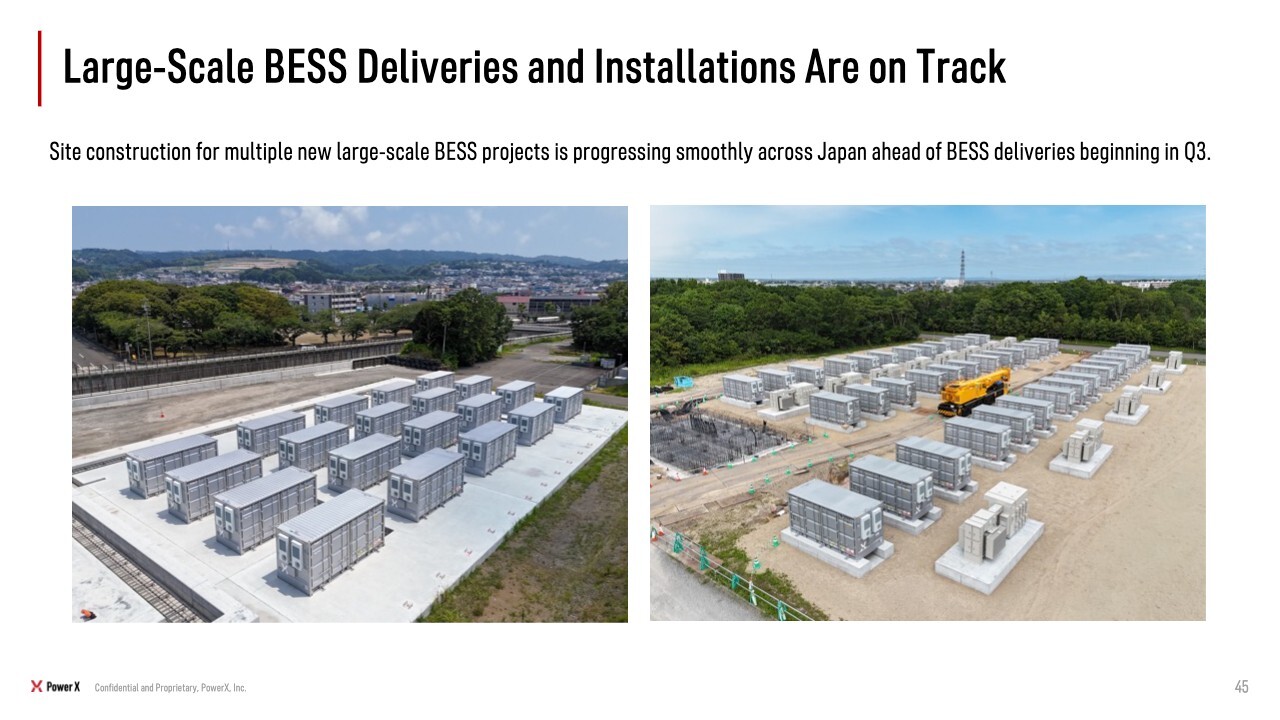
The photos on the slide were taken in August. Earlier I explained the flow from receiving orders and manufacturing products to delivering them to customers and recognizing revenue, and I mentioned that many deliveries take place in the third and fourth quarters. These two photos show projects where customers specifically asked us to bring the equipment in August. We delivered everything at once in the first week of August.
In simple terms, our business model is weighted toward the second half. However, delivery to the site takes only about one to two weeks, so revenue can be recognized very quickly.
Even if a customer has not finished preparing the site, our contracts explicitly state that delivery can take place at our factory or storage facility. Therefore, even if the customer’s preparations are delayed, there is no impact on our revenue recognition, so there is no need for concern.
Everything is currently progressing smoothly.
Power Business: BESS Operation Services Double in Three Months; Equipment Sales Pipeline Reaches 4.9 GWh
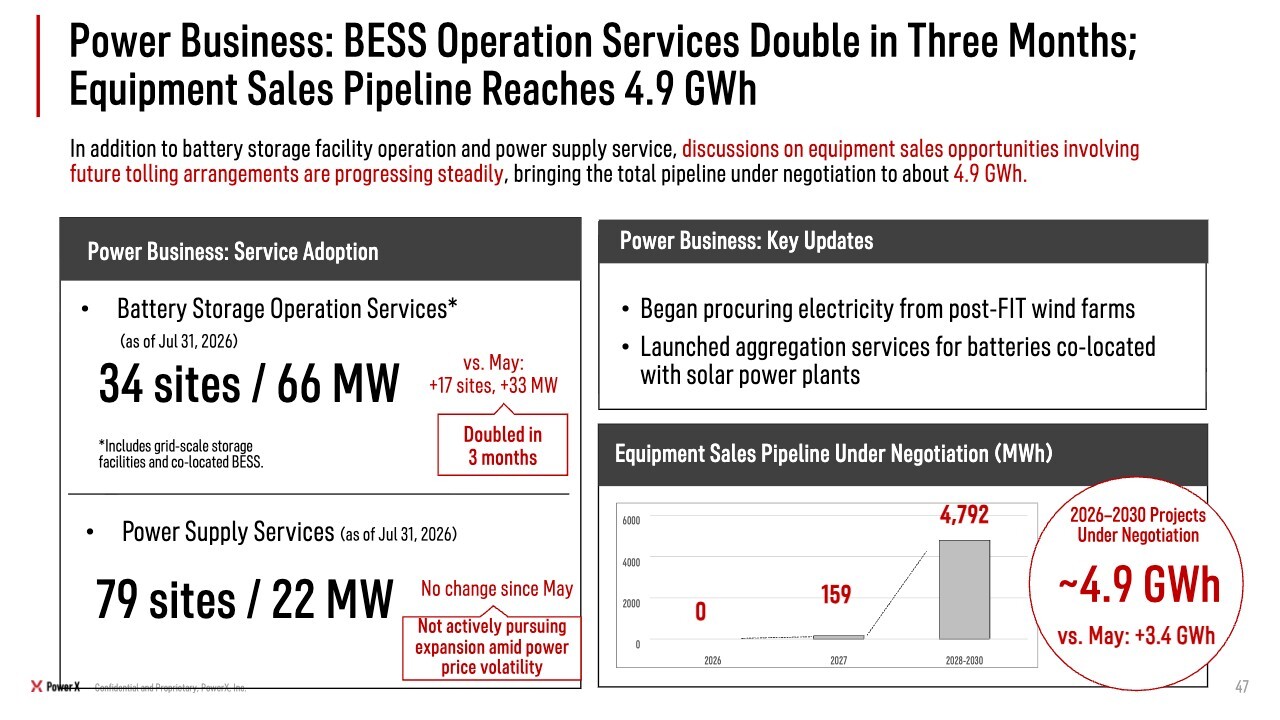
Let me discuss the Power Business. We do not simply sell batteries; we also engage in two activities: electricity sales and battery storage operation.
Our BESS operation services are currently performing very well. In fact, the capacity of batteries under our operation has doubled over the past three months to 66 MW.
Demand is increasing among customers that want PowerX to manage their batteries. Our vertically integrated model—in which customers purchase equipment from us and also entrust its operation to us, generating recurring revenue—is becoming established. This has confirmed that there is significant demand for the model.
Separately, the Power Business maintains its own pipeline for equipment sales tied to our operation services, distinct from the pipeline discussed earlier. This pipeline has reached 4.9 GWh, an increase of 3.4 GWh from May, indicating that demand remains extremely strong.
Next, let me discuss our power supply service. In electricity retail, we are not currently pursuing sales aggressively because of factors such as developments in the Strait of Hormuz. To be candid, bundled sales with batteries and services that include battery operation are more capital-efficient than selling electricity alone, so we are not currently seeking to expand electricity sales.
Balancing Market: Primary Reserve Price Cap to Be Lowered to ¥10/kW per 30 Minutes
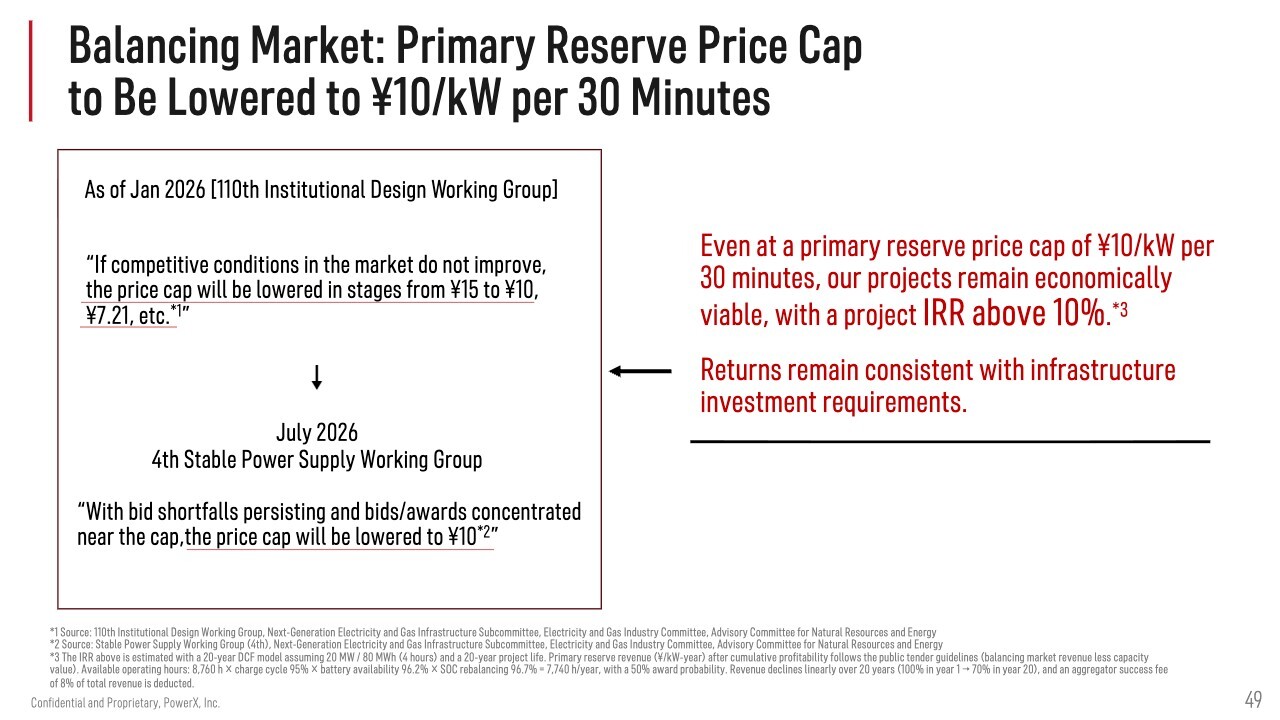
A number of developments in the electricity market have recently attracted attention, so I would like to explain our view. We included this topic in materials at the time of our IPO and in our roadshow materials, but you may not remember the details, so I will go over them again.
There has been discussion that the price cap for primary reserve in the balancing market may have been too high. The cap was set to be lowered in stages from ¥15 to ¥10 and then ¥7.21 per kW per 30 minutes. Even if it fell to around ¥4, comparable to pumped-hydro , we believe projects could still generate a sufficient IRR, or internal rate of return. Even at a price cap of ¥10 per kW per 30 minutes, we expect a project IRR of approximately 10%, which we believe is a fully acceptable level for power companies.
The market did become overheated, and there were cases where battery power plants were built and then resold. However, the market is now returning to a more normal state. We believe that the resulting reduction in grid-connection congestion is a positive development for us.
Battery Arbitrage Opportunities Are Expanding as Imbalance Prices Spike
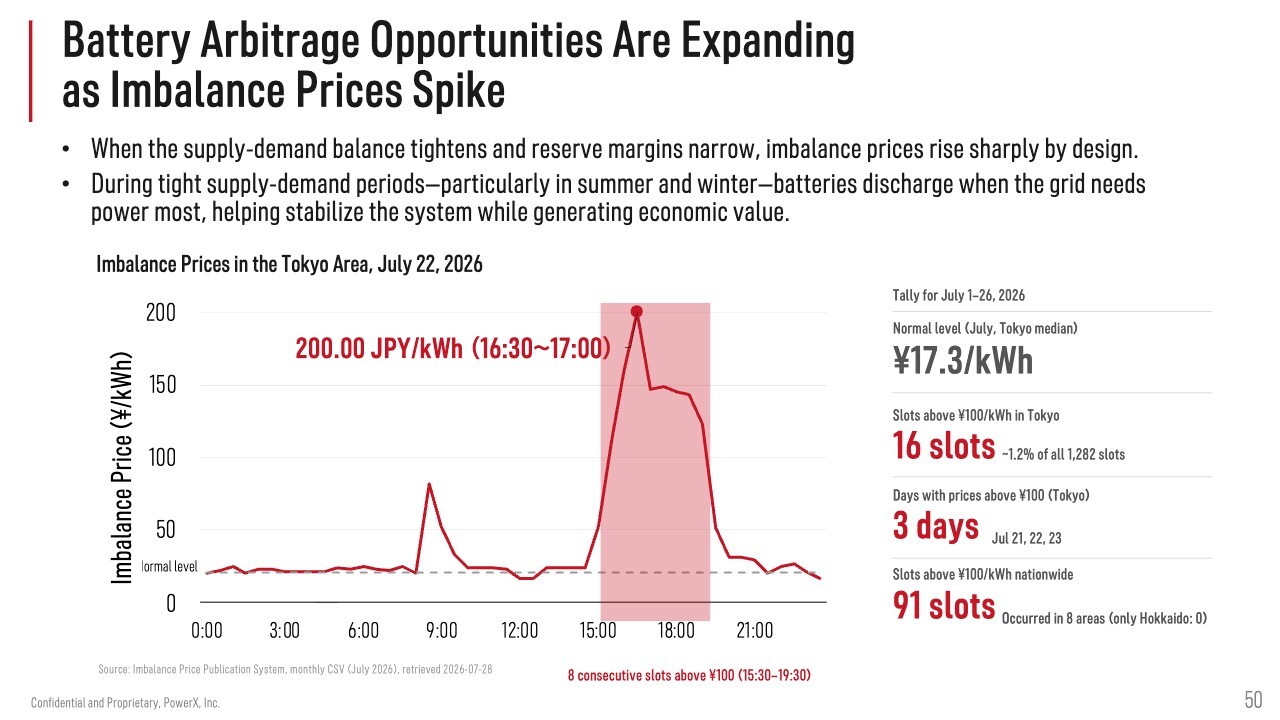
At the same time, electricity price spreads have become very wide. To be candid, I have been somewhat surprised by how frequently electricity has been in short supply for short periods during the summer, and we will probably see the same situation in winter.
The ¥200/kWh price shown here is called the imbalance price. It applies when electricity is still in short supply even though a generation plan was submitted the day before and operations proceeded in accordance with that plan—in other words, when demand exceeds forecasts.
There is a cap on imbalance prices, and it is currently ¥200/kWh. When electricity is in short supply, those who absolutely need it have no choice but to purchase it at that price. To avoid having to buy at ¥200/kWh, participants then bid at even higher prices for the following day, which creates a market tendency for electricity prices and spot prices to rise.
At present, price spreads have widened considerably. Electricity is inexpensive and abundant during the daytime, so batteries can be charged during those periods and then discharged and sold when prices spike, allowing operators to earn a profit.
Earning profit from this price spread is what we call arbitrage. Recently, returns from trades using these spreads have improved. As supply-demand balancing normalizes, we believe the battery storage market is becoming much healthier.
Rising Imbalance Prices Are Expected to Expand Long-Term Battery Arbitrage Opportunities
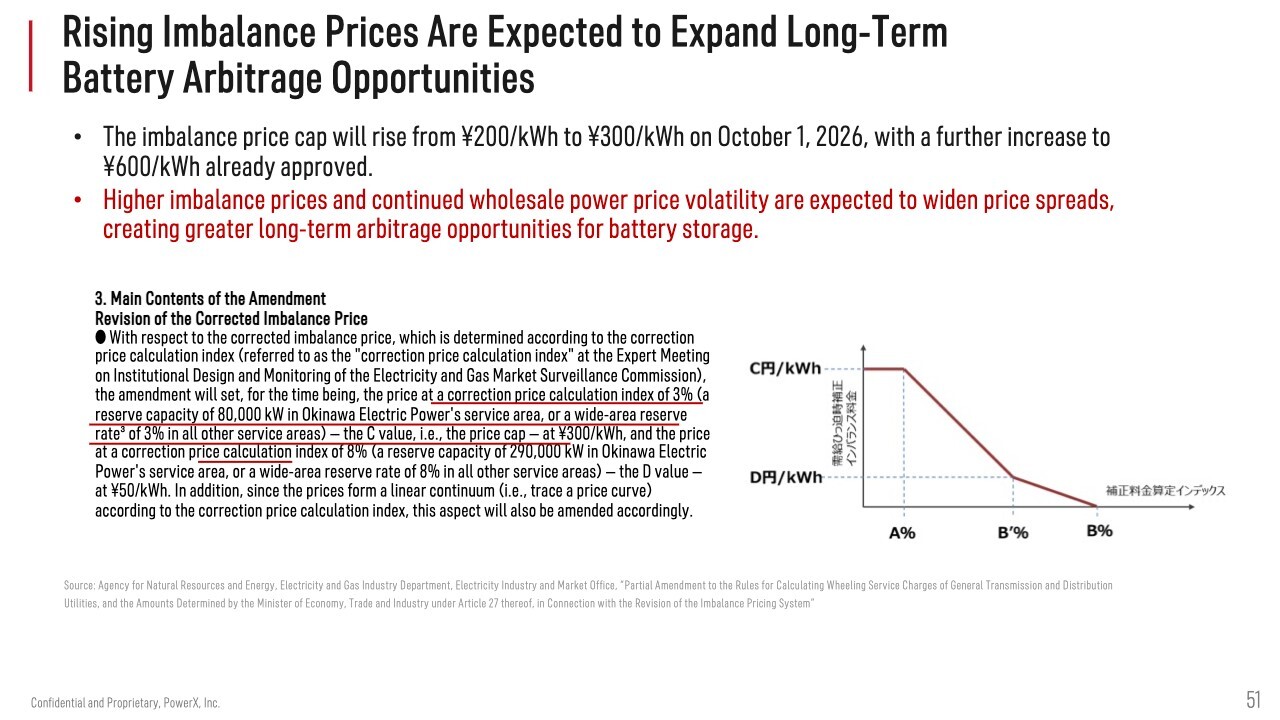
The current imbalance price cap of ¥200/kWh is scheduled to be raised to ¥300/kWh. That alone will have a major impact, and there is also discussion of raising it further to ¥600/kWh in the future, which could become a very significant issue. Against this backdrop, we believe this may be one reason demand is increasing for batteries that help balance supply and demand.
Japan Power Market Trends: Key Takeaways
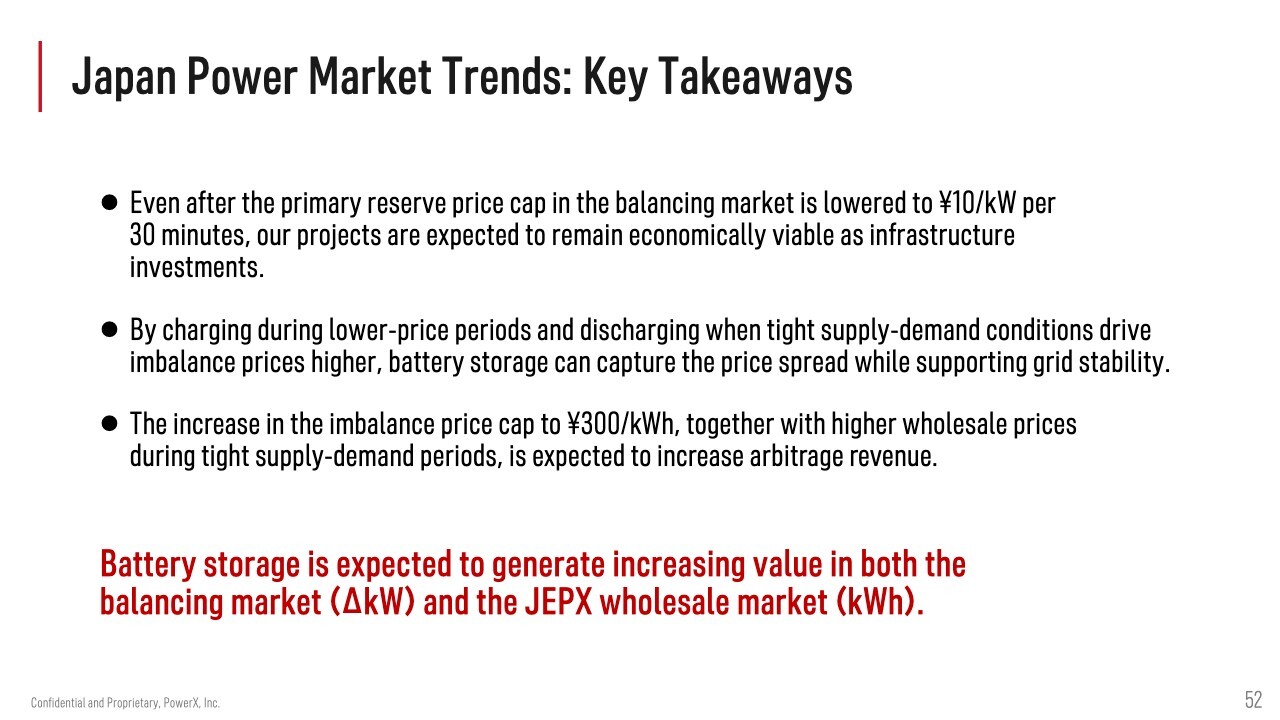
To summarize trends in the electricity market, the market is gradually becoming more balanced. In summer and winter in particular, arbitrage opportunities are substantial and imbalance prices have also been increasing. We believe economic factors of this kind may therefore be one of the drivers of battery storage demand.
International Sales Activities Across Asia
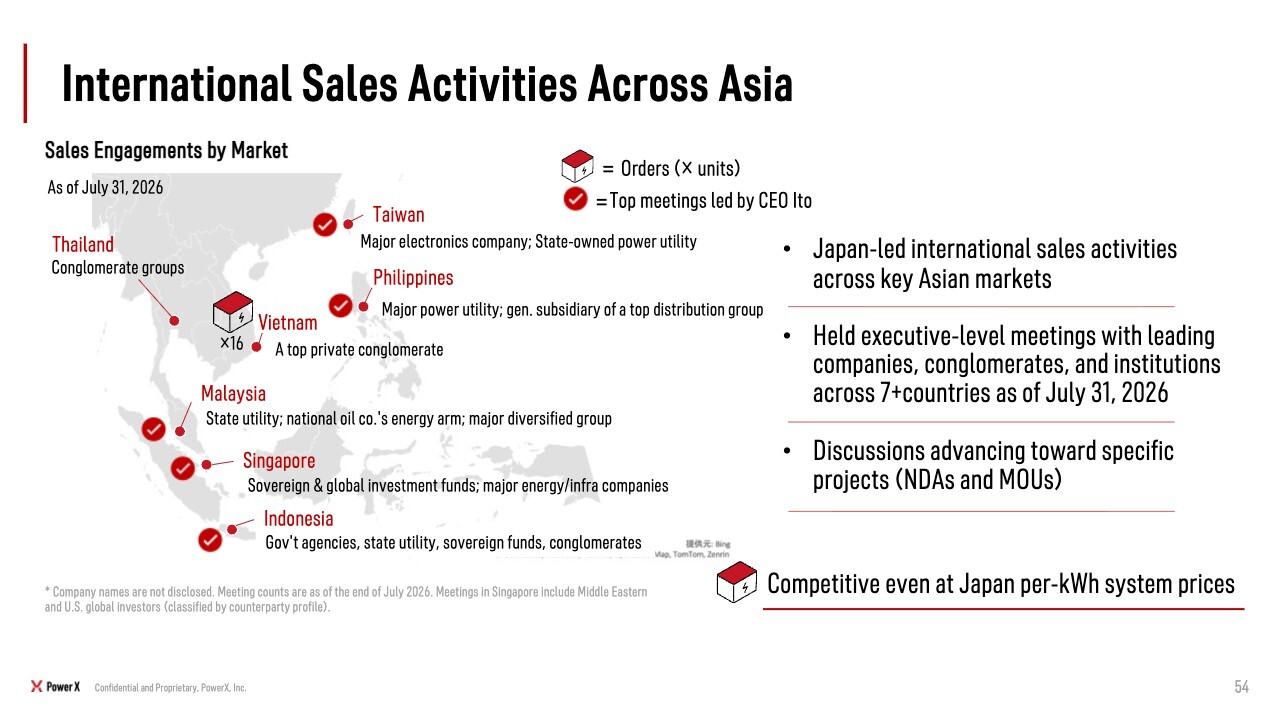
We expect revenue of ¥40.0 billion this year and approximately ¥70.0 billion next fiscal year. We are also working on the basis that next fiscal year’s net profit will reach a solid level. However, the ¥70.0 billion figure for next fiscal year includes only our domestic business.
We believe the potential for overseas demand will expand significantly from here. We have also been focusing more heavily on this area recently.
Over the past three months, I have visited a variety of regions. The check marks on the map indicate places that I have personally visited. I was able to meet with highly influential people, including senior executives and presidents of major electric utilities in each country, as well as owners of oil, gas, coal, and mining companies. In Asia in particular, I had the opportunity to meet with many such leaders.
Through these visits, as I traveled around the region myself, I strongly felt that the number of tender opportunities had increased substantially. We are now actively pursuing these tenders and have once again been struck by the scale of demand in this market.
In this region, there are several stationary battery energy storage systems from Chinese manufacturers, but because they ultimately come from a single country, there is actually not much diversity of supply. When we visit customers, we receive a very positive response because we can offer products with a track record in Japan at a similar price level, and customers tell us that they want to seriously consider our products.
We have already secured orders for 16 large-scale battery units in Vietnam, and we are working with full commitment to use this as a foothold and steadily expand follow-on orders.
Southeast Asia's Energy Landscape: The Urgent Need for Greater Energy Security
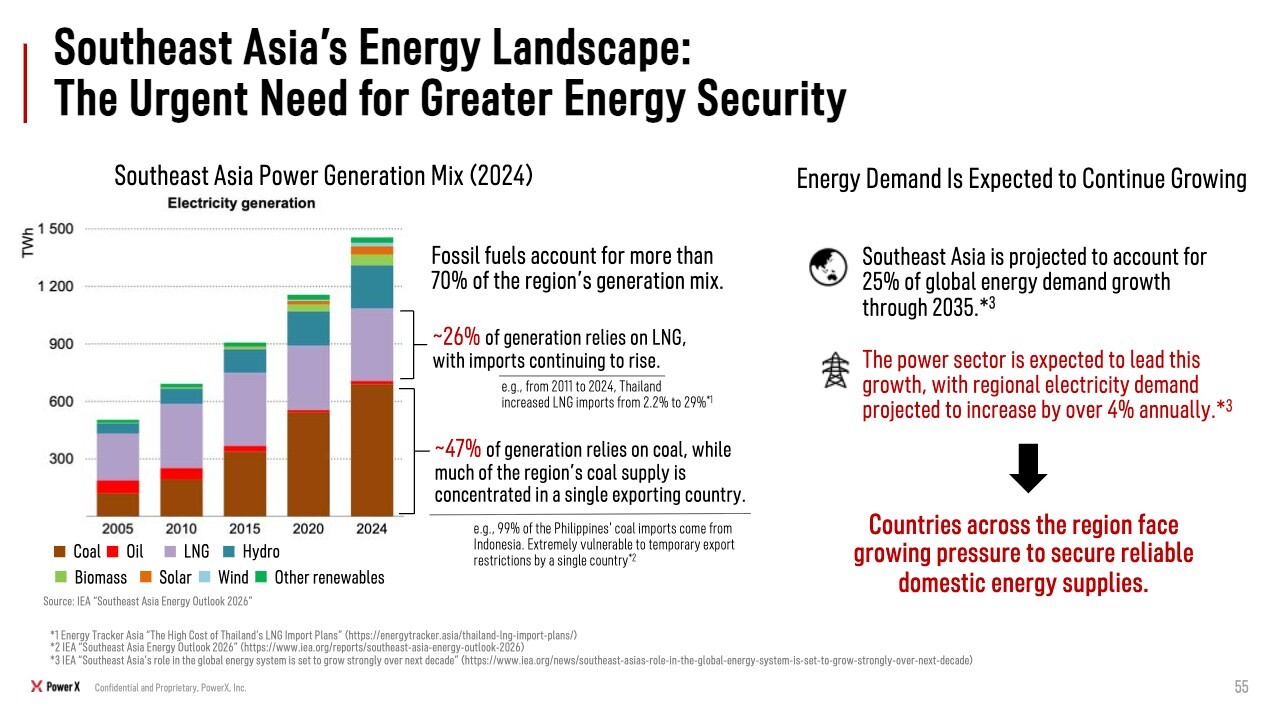
Let me explain the background. Prices for oil, LNG, and coal have yet to return to normal, and many countries are particularly uncomfortable with dependence on a single country—for example, dependence on one country for coal. The same concern applies to battery energy storage systems.
As a result, the need to purchase from a variety of suppliers is increasing, similar to our own approach of procuring modules from multiple suppliers. We believe this situation presents a very large opportunity.
BESS Deployment Potential in Southeast Asia Region
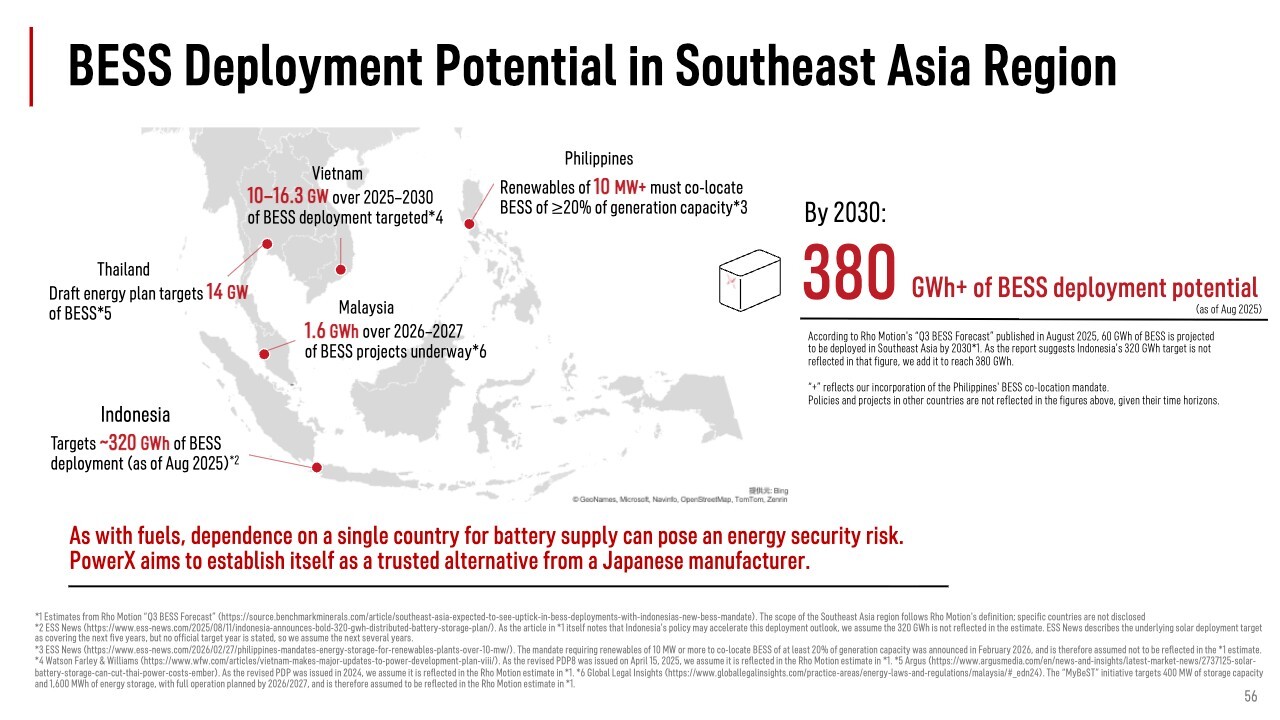
The slide shows how much battery storage could be sold by 2030. The market is on the scale of 380 GWh, while the batteries we are currently discussing with customers total 9 GWh, so you can see that a very large amount of opportunity still remains. The market is extremely large, and we intend to capture a meaningful share of it.
We are also able to sell into these markets at prices comparable to those in Japan. The weak yen is one factor, and I also think the deflation Japan experienced over the past 10-plus years may be contributing.
For Japanese manufacturers, however, I think an opportunity is opening up to overcome the difficult domestic environment, expand proactively overseas, and earn foreign currency—in a sense, by going abroad to work. We plan to achieve revenue of ¥70.0 billion in the Japanese market next year and generate ¥5.0 billion to ¥6.0 billion of net profit from that business.
Next fiscal year, we also intend to make a concerted effort to develop overseas markets. If all goes well, overseas projects may begin contributing in FY2027. However, we do not want investors to set their expectations too high; we intend to proceed steadily and earnestly.
Montenegro: Update on Discussions with EPCG
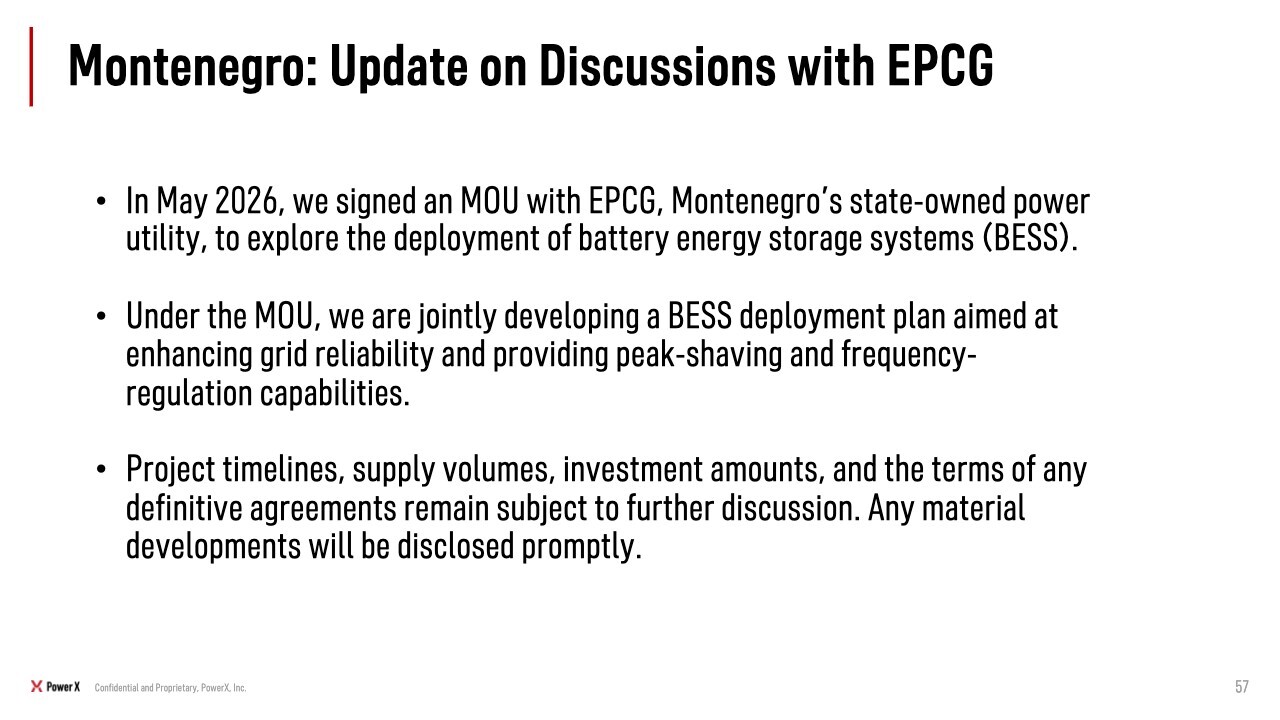
Regarding progress in Montenegro, the nature of government-to-government negotiations means that they inevitably take time. However, the MOU states that a definitive agreement is to be concluded within six months, which would put the timing at around November.
We are currently in a period when many people are taking summer holidays, but discussions are proceeding steadily. Once we have something concrete to report, we will provide a full update. We intend to continue approaching the matter positively.
Our New Mission: Think Sovereign Energy
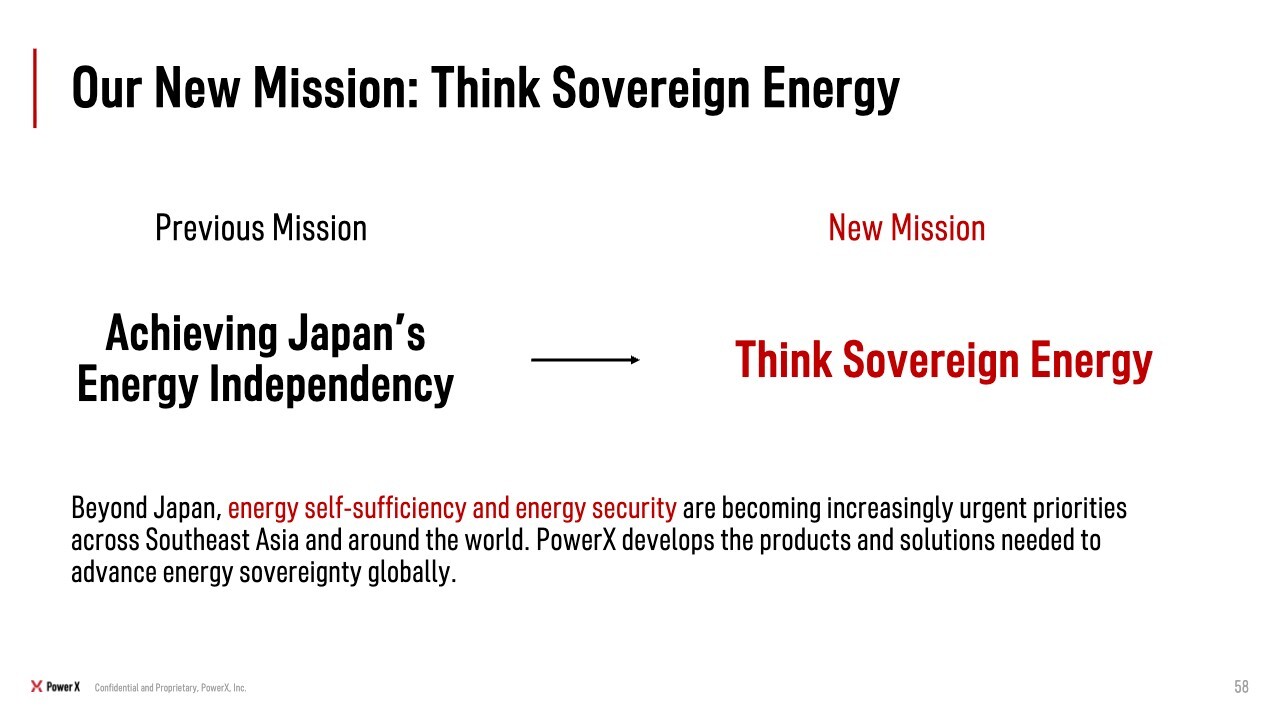
After traveling overseas—and having recently felt the same way in Japan as well—I have been reflecting on our mission. Until now, we have worked under the mission of “Achieving Japan’s Energy Independence.” However, when we go overseas and show that wording in our materials, it naturally feels different in those markets.
When we speak with customers, we find that customers in each country also want to increase their own energy self-sufficiency, which points in the same direction as our mission. There is a strong desire to avoid dependence on coal or oil from a single country and to generate power domestically. Solar power is particularly widespread in Asia, while hydro and wind power are also used in some areas. These countries need to store the electricity generated domestically from those energy sources reliably, which is why battery storage is needed. This is exactly what we mean by Think Sovereign Energy.
We believe PowerX is a company that develops products enabling this kind of sovereign energy—that is, enabling countries to raise their own energy self-sufficiency. This may not be the kind of announcement normally made in this setting, but we are adopting Think Sovereign Energy as our new mission. We want to deliver products that help each country improve its energy self-sufficiency and achieve more prosperous lives.
Application for Transfer to the TSE Prime Market
I have two other items to share. First is the TSE Prime Market. Given insider-trading considerations around the lock-up period, we decided to disclose that preparations were under way so that the fact of those preparations would not remain undisclosed material information. That is why we announced that we were preparing for the transfer.
Preparations continue steadily, and we will provide an update when there is material progress. At present, our plans are unchanged from what we have already disclosed, and preparations are progressing smoothly.
Tokyo Office Relocation
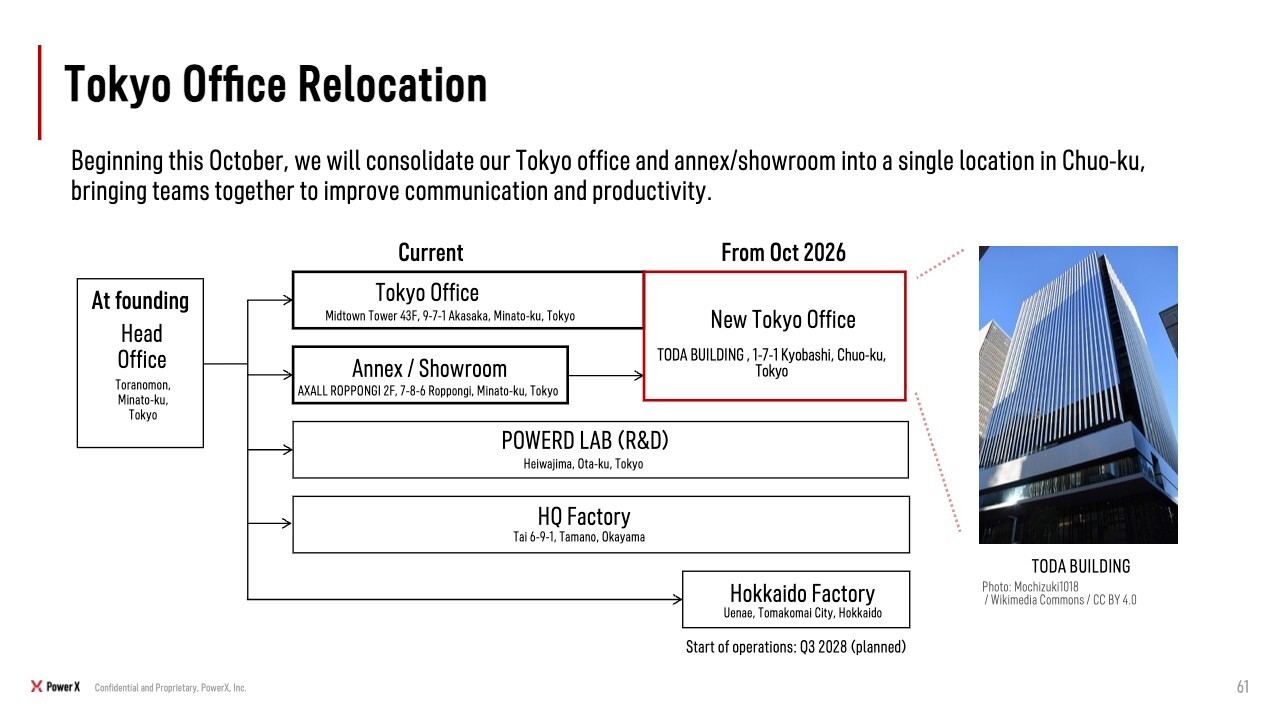
Next is the relocation of our Tokyo office. This is a relatively small relocation, but revenue has doubled from last year to this year while SG&A expenses have declined. We therefore operate with a relatively small team rather than significantly increasing headcount.
That said, because we are a rapidly growing company, ideally we would have consolidated our Tokyo operations in a single location from the beginning, but at present they are dispersed across multiple locations. As a result, it can be difficult to maintain effective communication even with a small team. We are therefore proceeding with a plan to consolidate our Tokyo offices into one location.
The transition period will continue for some time, but our policy is to consolidate the Tokyo office, showroom, and annex in one location to improve management efficiency. The reason I am mentioning this here is that I wanted to explain, in particular, that we are reducing SG&A expenses and controlling costs. During the transition, however, we will inevitably incur overlapping rent for a period of time, and we appreciate your understanding on that point.
Revenue has doubled from last year to this year, and we expect further growth of approximately 70% from this year's level. Even so, we intend to reduce SG&A expenses and generate solid free cash flow.
There is also no need to be concerned about our business model. Production of batteries corresponding to 60% of this year's revenue plan had already been completed as of June, and revenue will increase as shipments progress. We therefore do not have any major concerns.
Looking at KPIs, we believe the key items going forward are growth in the order backlog, winning overseas projects, and improving margins. Ultimately, the amount of ordinary profit we can generate will be important.
Summary - A Stronger Foundation for the Next Phase of Growth
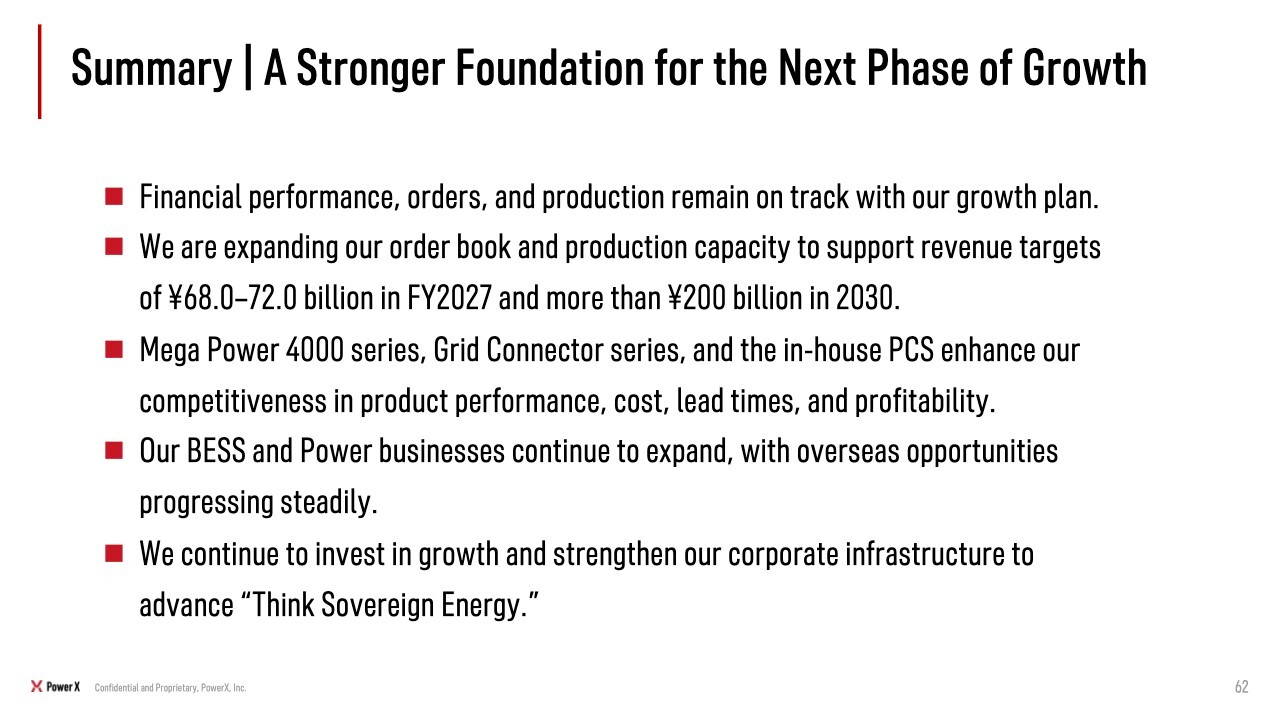
I personally feel that the Company is now entering its next phase. We intend to redouble our resolve as we take on the next stage.
Thanks to your support, orders are strong and production is progressing smoothly without disruption. The batteries we have delivered to customers are also steadily entering operation; we have completed the initial rollout and confirmed that the systems are operating reliably.
To grow the business several times over from here, I believe we need to build the necessary systems and processes. We have improved both product quality and our lineup, and now have products that are competitive enough to take on overseas markets in earnest. We are therefore ready to begin expanding more actively.
In the next phase, with Think Sovereign Energy at the core, we want to shift our perspective from Japan to overseas markets, renew our mission and vision, and pursue new challenges. We can take on these challenges only because of your support. I would like to express my sincere gratitude to all of our shareholders, and thank you very much for watching this lengthy presentation.
Greetings from Mr. Ito
As I mentioned at the beginning, many of you may have joined partway through, so let me reiterate one point. We have been listed for less than a year, and therefore do not yet have analyst coverage, target share prices, or consensus estimates. As a result, we provide a large volume of materials each time we announce financial results.
Against this backdrop, we are committed to careful and thorough IR activities and are also making use of the latest technologies. If you scan the QR code on the right side of the slide, you can access a lightweight version of the materials designed to minimize misinterpretation by AI. The materials were created specifically for AI use and consume relatively few tokens, so even users of premium plans should not need to worry about excessive token consumption.
If you ask ChatGPT, Claude, or another AI service questions about PowerX, we believe the AI should be able to answer accurately based on the information contained in these materials without misinterpreting the content. We hope you will try this initiative for yourself, and we will continue to conduct our IR activities carefully and thoroughly. I look forward to seeing you again.
Thank you very much for watching our second-quarter financial results briefing. We will continue to work tirelessly, and I hope you will look forward to our third-quarter results as well. We appreciate your time today.