
Consolidated Result Summary
Yuki Katayama (hereafter, "Katayama"): My name is Yuki Katayama, Director, Senior Executive Officer, and General Manager of the Administration Division. I will provide an overview of Micronics Japan Co., Ltd.'s financial results for Q2 FY2026.
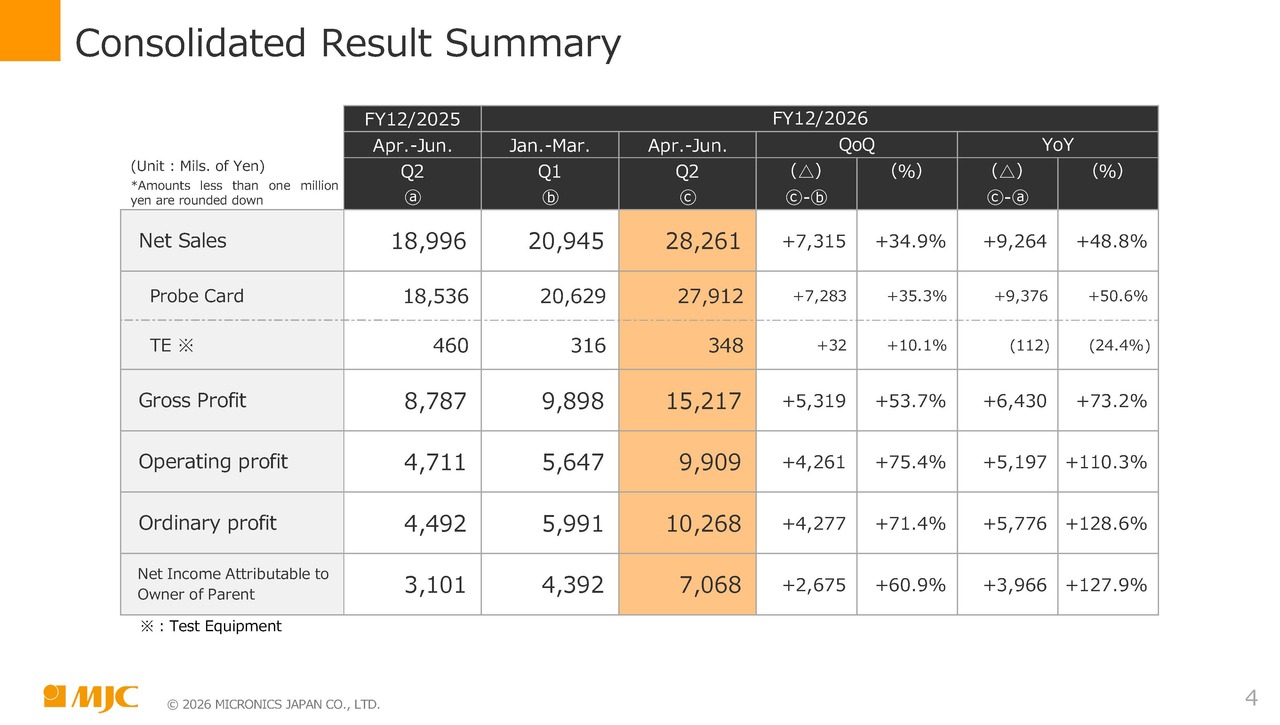
This slide shows our quarterly results, with the orange column representing results for the three months of Q2, from April through June.
Net sales were JPY28,261 million and operating profit was JPY9,909 million. Compared with the immediately preceding Q1, from January through March, net sales increased 34.9% and operating profit increased 75.4%.
Compared with the same period of the previous year, from April through June 2025, net sales increased 48.8%, while operating profit and each subsequent profit measure more than doubled.
Consolidated Result Summary
I will now provide an overview of our financial results for the first half of FY2026.
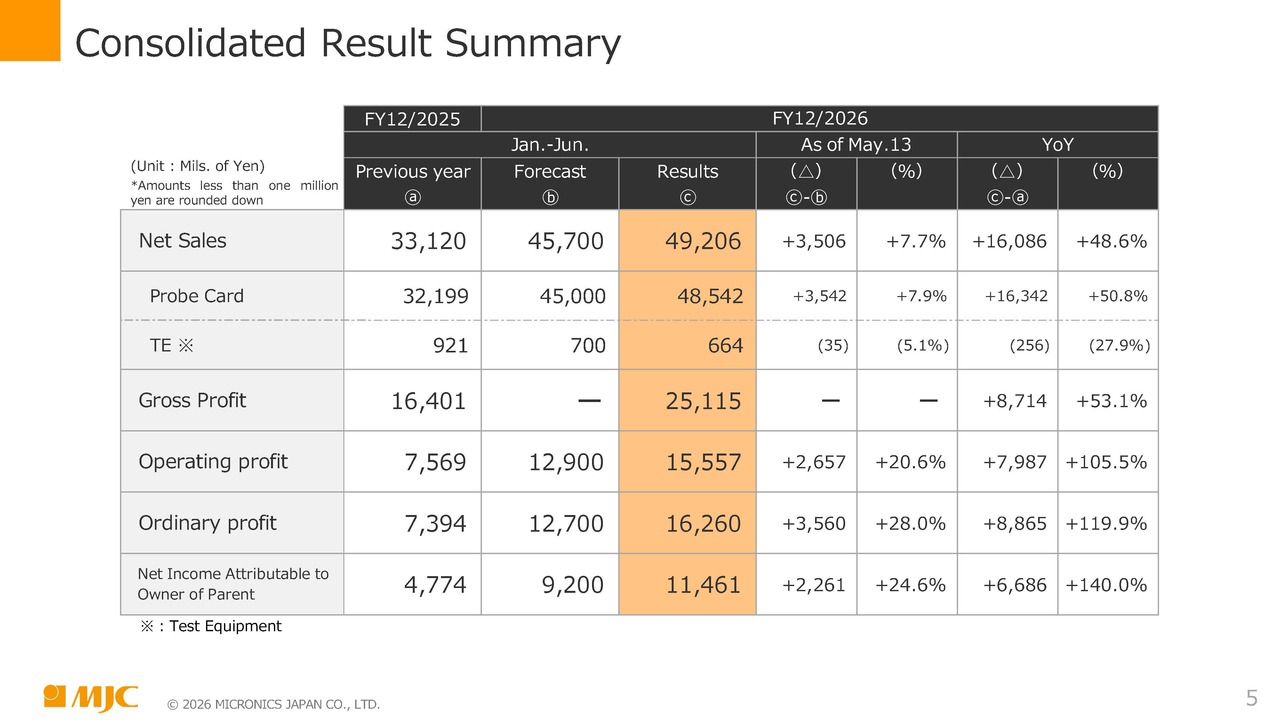
Again, the orange column on this slide shows results for the first half, from January through June. Net sales were JPY49,206 million and operating profit was JPY15,557 million. Ordinary profit was JPY16,260 million, and net income attributable to owners of parent was JPY11,461 million.
YoY comparisons are shown on the right side of the table. Net sales increased 48.6% YoY. Operating profit, ordinary profit, and net income attributable to owners of parent all more than doubled, with increases exceeding 100%.
The gross profit margin was 51%, up 2 percentage points from 49% in the same period of the previous year.
SG&A expenses increased approximately JPY700 million YoY. This was a relatively modest increase of 8% compared with the growth in net sales. The increase mainly reflected higher personnel and R&D expenses, partially offset by a decrease in the provision for product warranties.
Compared with the forecast for the first half of FY2026 announced on May 13, net sales were JPY3,506 million higher, operating profit was JPY2,657 million higher, and net income attributable to owners of parent was JPY2,261 million higher.
President Hasegawa will provide further details later, but yesterday, August 12, we issued a timely disclosure regarding revisions to our full-year financial forecast and dividend forecast together with our quarterly financial results. Briefly, our assumed exchange rate for full-year FY2026, from January through December, is JPY156 to the U.S. dollar. We estimate that a one-yen movement against the U.S. dollar would affect results by just under JPY30 million.
Summary of Q2 FY2026 Results
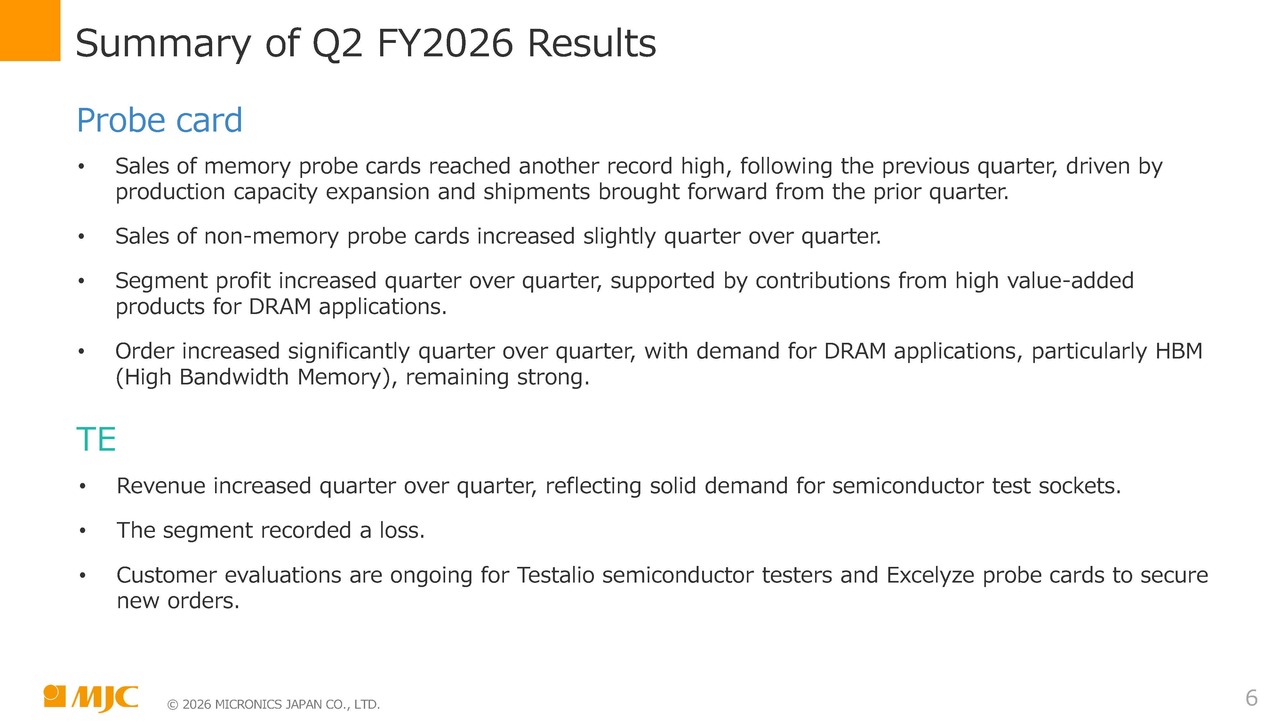
Here are the highlights of our Q2 FY2026 results. In the probe card business, net sales of memory probe cards reached a record high for the second consecutive quarter, driven by sales carried over from the previous quarter and sales brought forward as a result of expanded production capacity.
Net sales of non-memory probe cards increased slightly QoQ. Segment profit increased QoQ, supported by contributions from high value-added products for DRAM applications. Orders received increased significantly QoQ, and demand for DRAM, particularly HBM (High Bandwidth Memory), remained strong.
In the TE business, net sales increased QoQ, supported by solid sales of semiconductor test sockets, while the segment recorded a loss. Customer evaluations of the Testalio semiconductor tester and the Excelyze Engineering Prober are currently underway as we work to secure orders.
Quarterly Financial Result
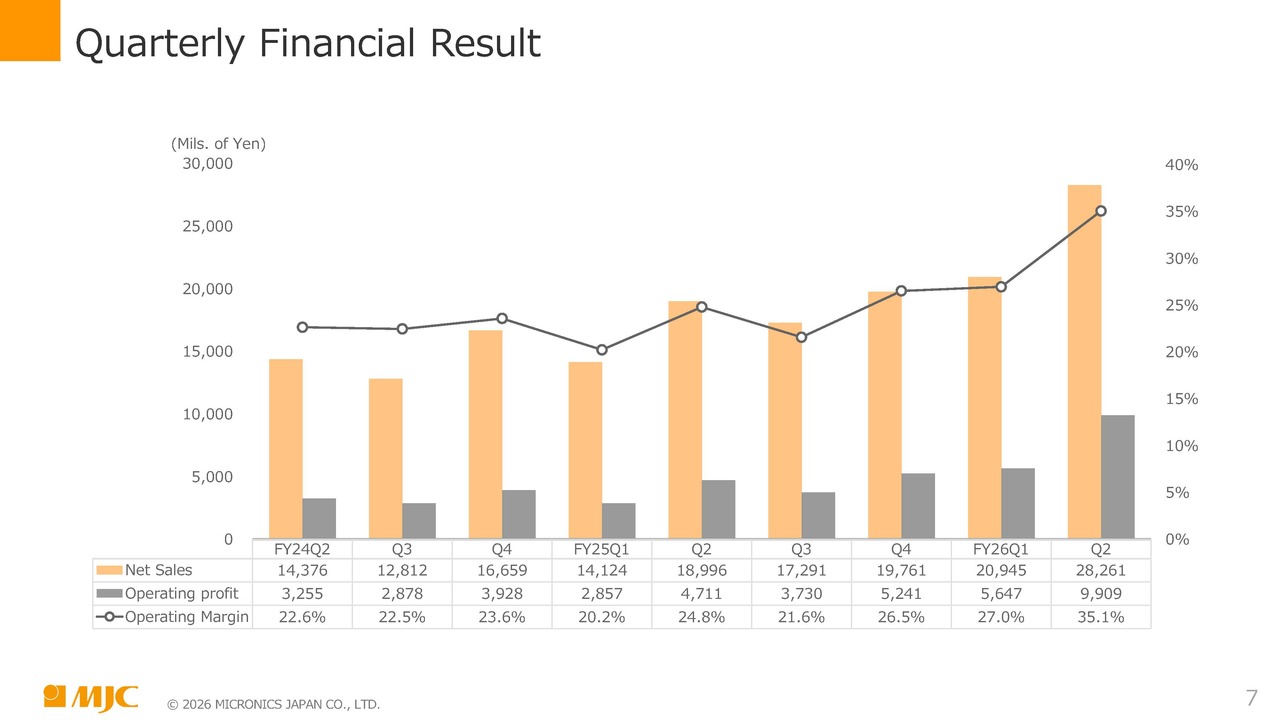
This slide shows our quarterly financial results. The graph presents trends in net sales, operating profit, and operating margin on a company-wide basis.
On a company-wide basis, we have maintained an operating margin of 20% or more in every quarter over the past two years, continuing to generate stable earnings. The operating margin was 35% in Q2.
Quarterly Financial Results by Segment
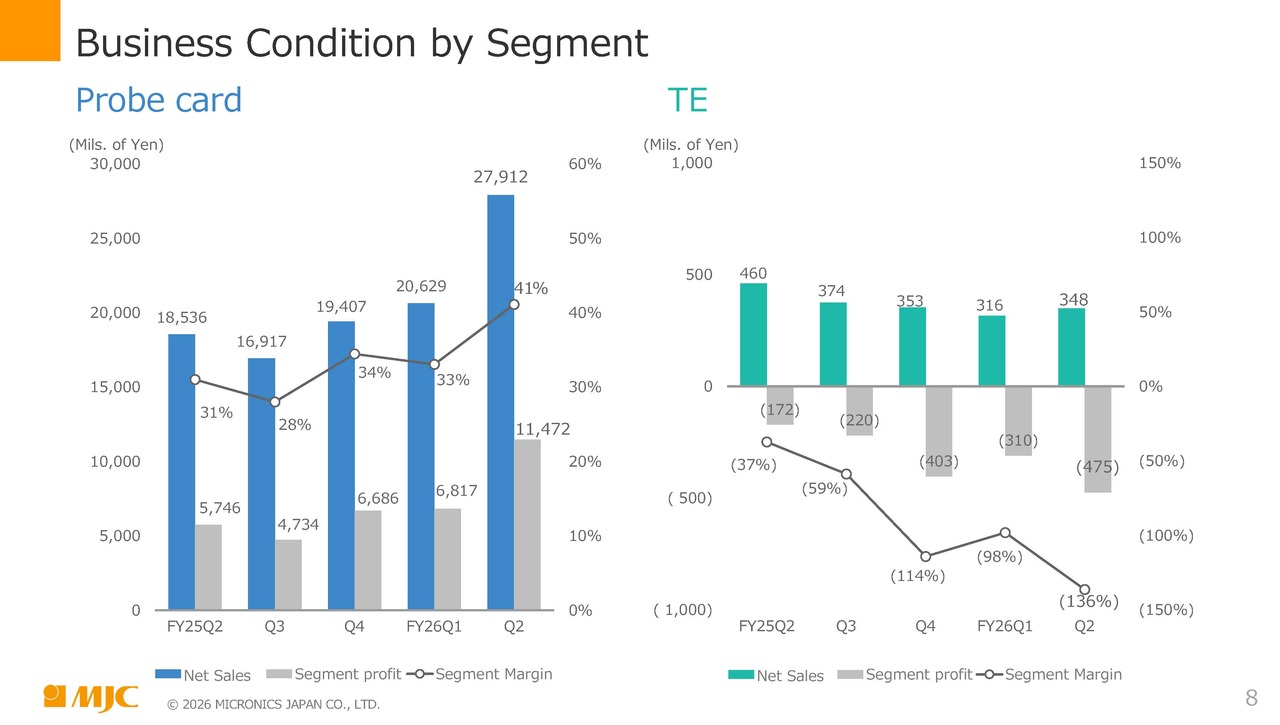
This slide shows quarterly financial results by segment. In the probe card business shown on the left, the segment margin reached a strong 41% in Q2, lifting the company-wide operating margin.
The TE business shown on the right recorded a segment loss of JPY475 million.
Quarterly Net Sales by Product
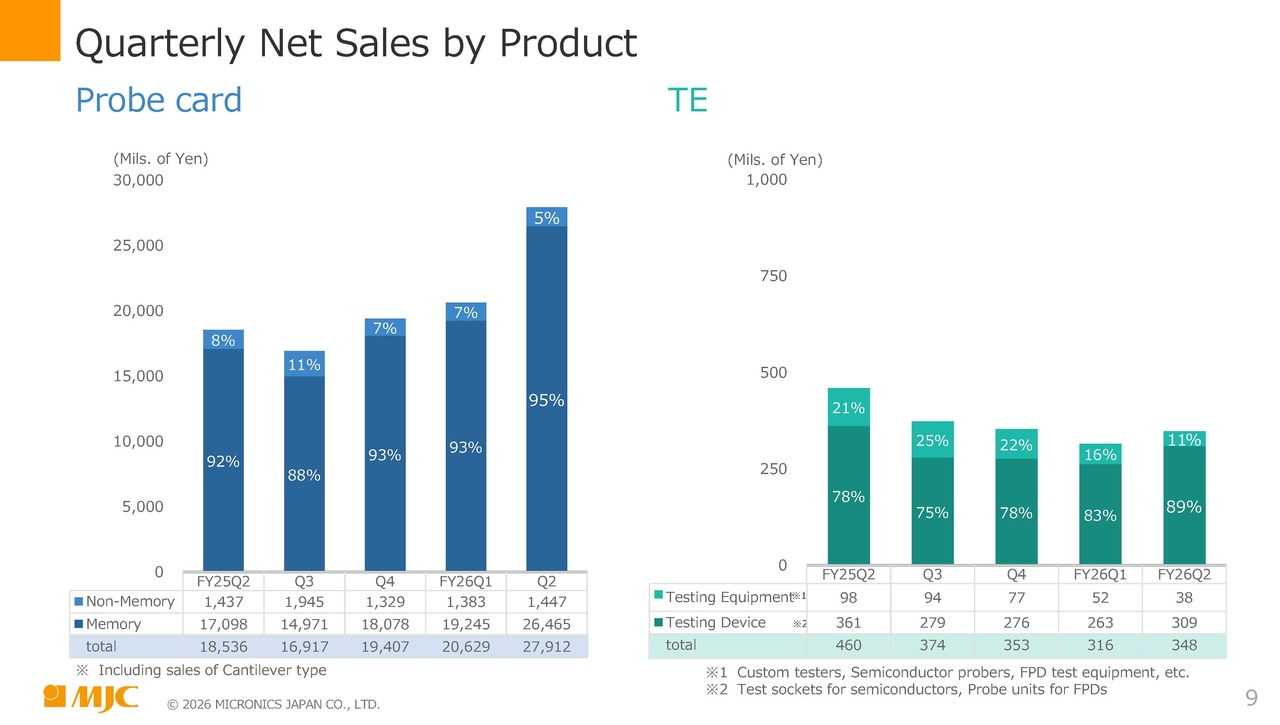
This slide presents quarterly net sales by product. The graph for the probe card business on the left shows the respective shares of memory and non-memory products.
In Q2, memory products accounted for 95% of probe card net sales and non-memory products accounted for 5%. Net sales of memory products increased approximately JPY7.2 billion from the previous quarter, rising to nearly 1.4 times the Q1 level.
In the TE business shown on the right, sales continued to be driven primarily by test sockets for semiconductor test equipment.
Quarterly Net Sales by Region
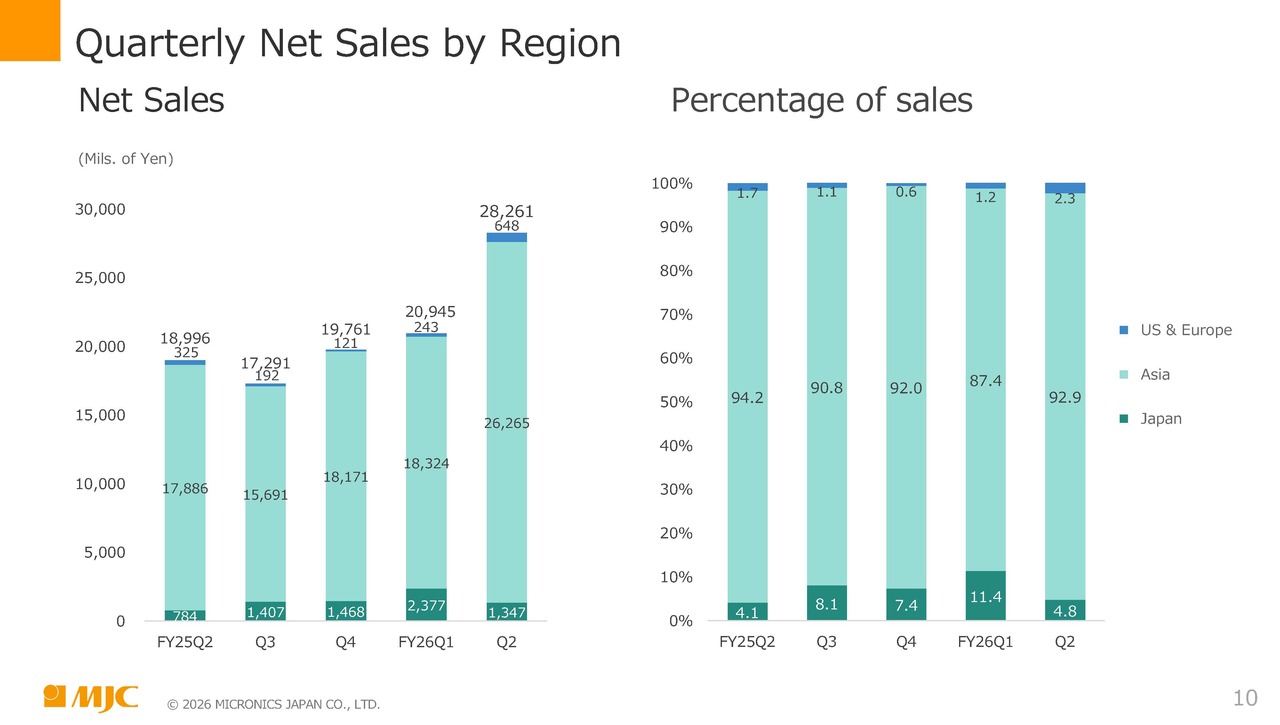
This slide shows quarterly net sales by region. The graph on the left presents sales amounts. Net sales in Q2 were JPY28,261 million.
Within this total, net sales in Japan decreased by approximately JPY1.0 billion from the previous quarter. As a result, Asia accounted for 92.9% of Q2 net sales.
Consolidated Balance Sheet
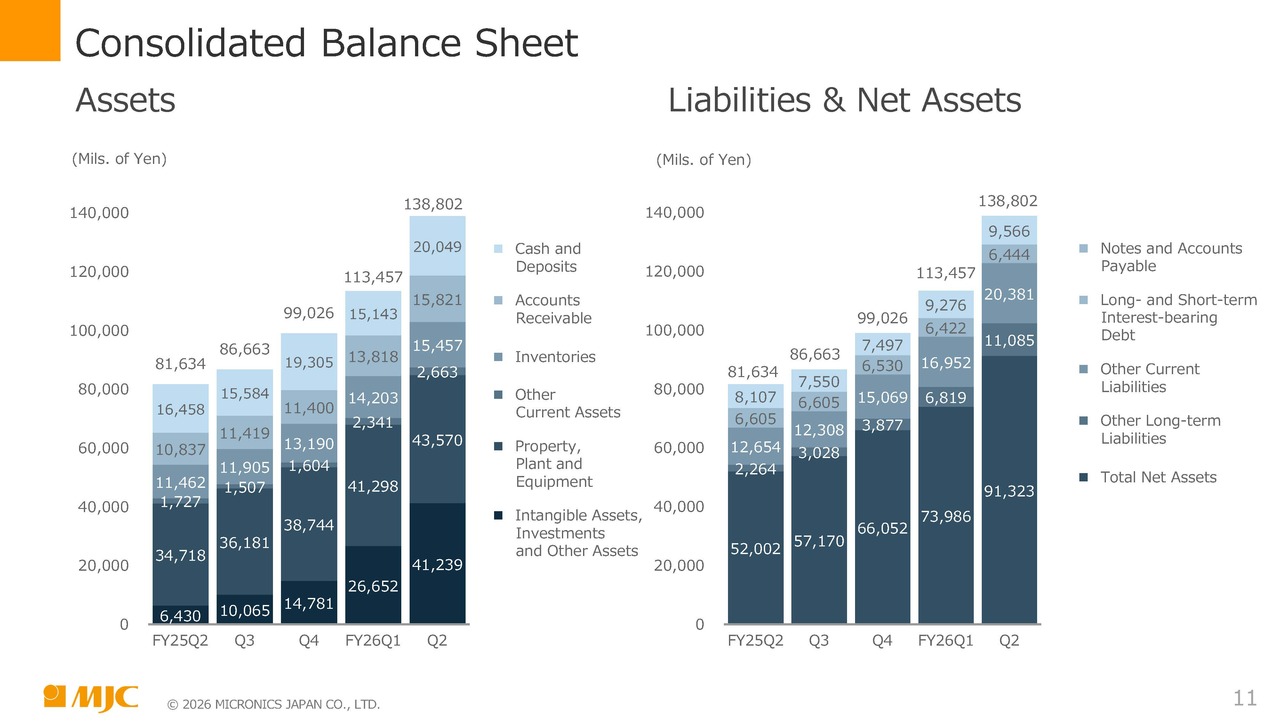
This is the consolidated balance sheet. The left side of the slide shows assets. Total assets at the end of Q2 were JPY138,802 million. Cash and deposits were JPY20,049 million, accounting for approximately 14% of total assets. With interest-bearing debt of JPY6.4 billion, net cash stood at JPY13.6 billion.
Intangible assets, investments and other assets totaled JPY41,239 million, an increase of JPY14.6 billion from the previous quarter. The increase primarily reflected a rise in the value of investment securities due to mark-to-market valuation, rather than additional share purchases.
The right side of the slide shows liabilities and net assets. Other current liabilities, the third item from the top of the graph, increased approximately JPY3.4 billion from the previous quarter, mainly due to an increase in income taxes payable in line with earnings growth.
Net assets, shown at the bottom of the graph, were JPY91,323 million, and the equity ratio was 65.8%.
Investments/Cash Flows
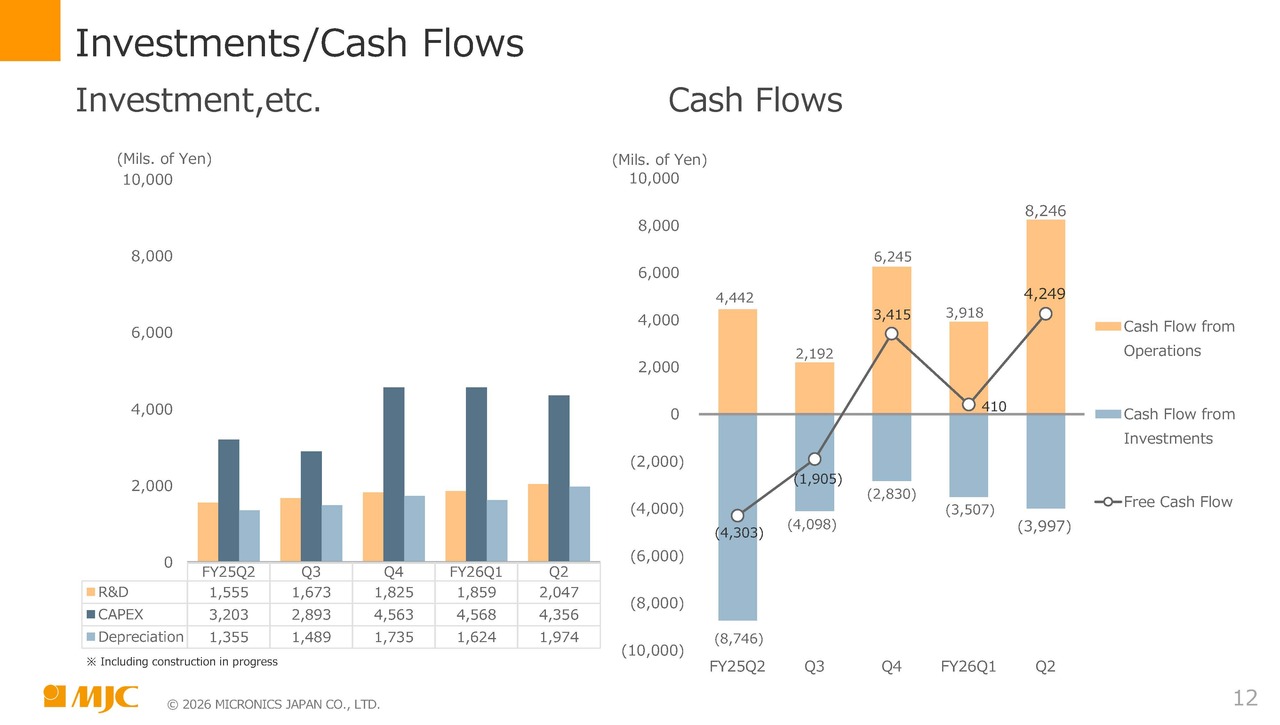
This slide shows investments and cash flows. The section on the left presents quarterly R&D expenses, capital expenditures, and depreciation.
R&D expenses increased by just under JPY200 million from the previous quarter to JPY2,047 million. Cumulative R&D expenses for 1H totaled JPY3,906 million. Capital expenditures in Q2 were approximately JPY4,356 million, consisting mainly of investments in machinery and equipment.
I will now explain the cash flows shown on the right. Cash flow from operations in Q2 was JPY8,246 million, cash flow from investments was negative JPY3,997 million, and free cash flow was positive JPY4,249 million.
Although we continue to make substantial capital expenditures, free cash flow has remained positive, and we made no additional borrowings during 1H.
Business Environment
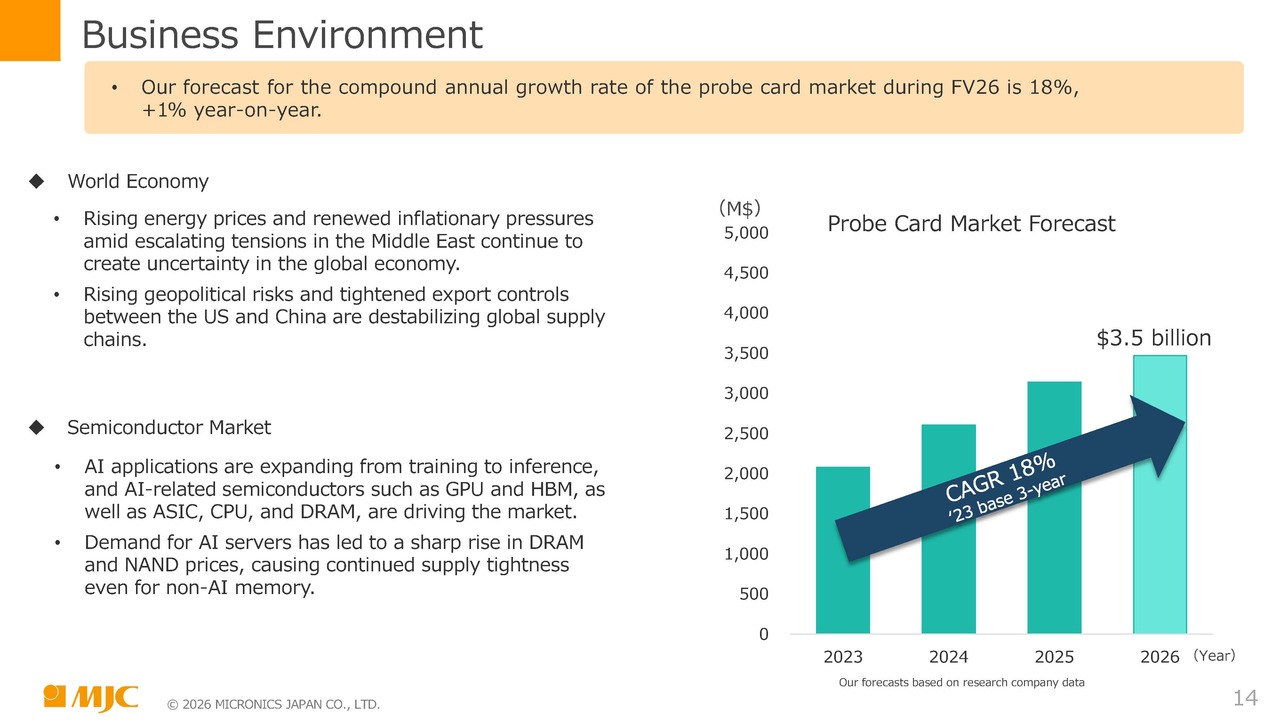
Masayoshi Hasegawa (hereafter, "Hasegawa"): My name is Masayoshi Hasegawa, President and Representative Director. I will discuss the business environment. We are currently implementing our medium-term management plan, FV26, which concludes in 2026.
We now forecast a CAGR of 18% for the probe card market from 2023 through 2026, up 1 percentage point from our forecast last year.
Turning to the global economy, however, uncertainty persists due to rising energy prices associated with escalating tensions in the Middle East and renewed inflationary pressures. Growth has been achieved amid destabilizing factors affecting global supply chains, including heightened geopolitical risks and tighter export restrictions between the United States and China.
In the semiconductor market, AI applications have expanded from training to inference, and AI-related semiconductors such as ASICs, CPUs, and DRAM are driving the market alongside GPUs and HBM. Demand for AI servers has also driven sharp increases in DRAM and NAND prices, resulting in continued supply constraints even for non-AI memory.
Financial Forecast (FY2026 3Q YTD)
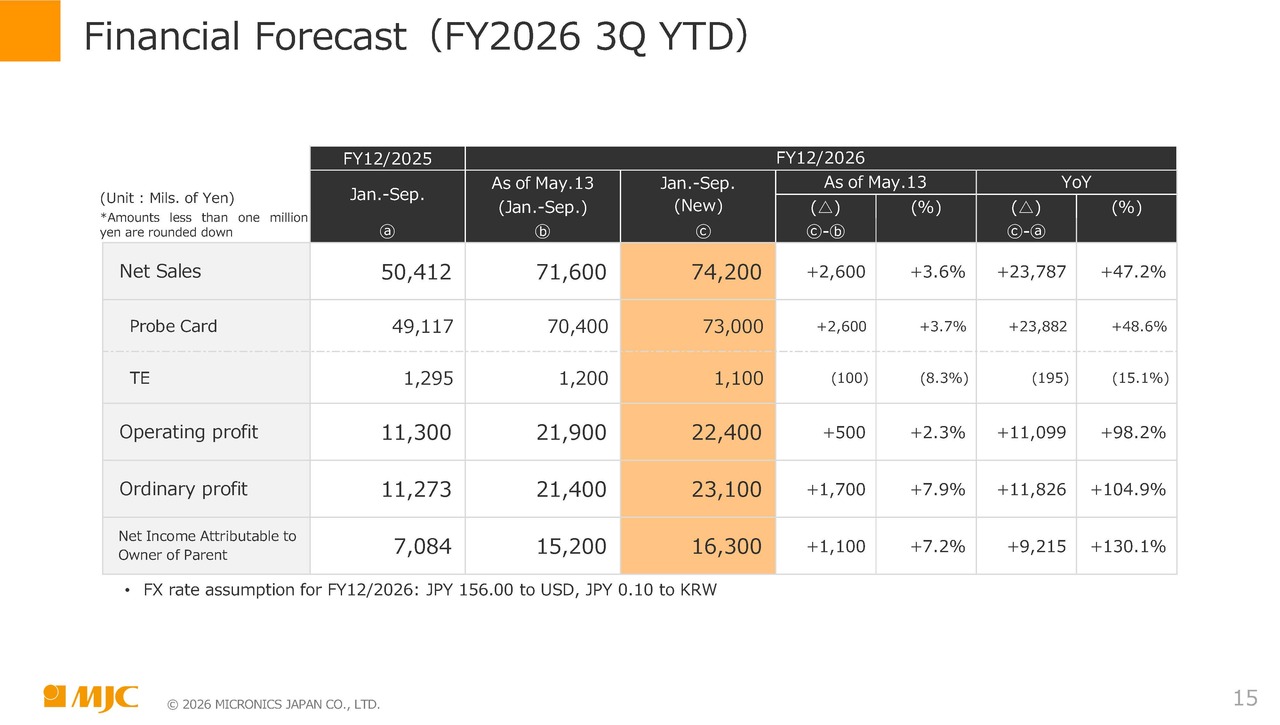
I will now discuss our financial forecast. First, I will cover the forecast for the first nine months of FY2026. The orange section shows the forecast for the first nine months of FY2026 announced on August 12.
Net sales are projected at JPY74.2 billion, JPY2.6 billion higher than the forecast announced on May 13. By segment, the probe card business forecast has been raised by JPY2.6 billion to JPY73.0 billion, while the TE business forecast has been lowered by JPY100 million to JPY1.1 billion.
Operating profit is projected at JPY22.4 billion, JPY500 million higher than the previous forecast. Ordinary profit is projected at JPY23.1 billion, and net income attributable to owners of parent at JPY16.3 billion.
Financial Forecast (FY2026 Full Year)
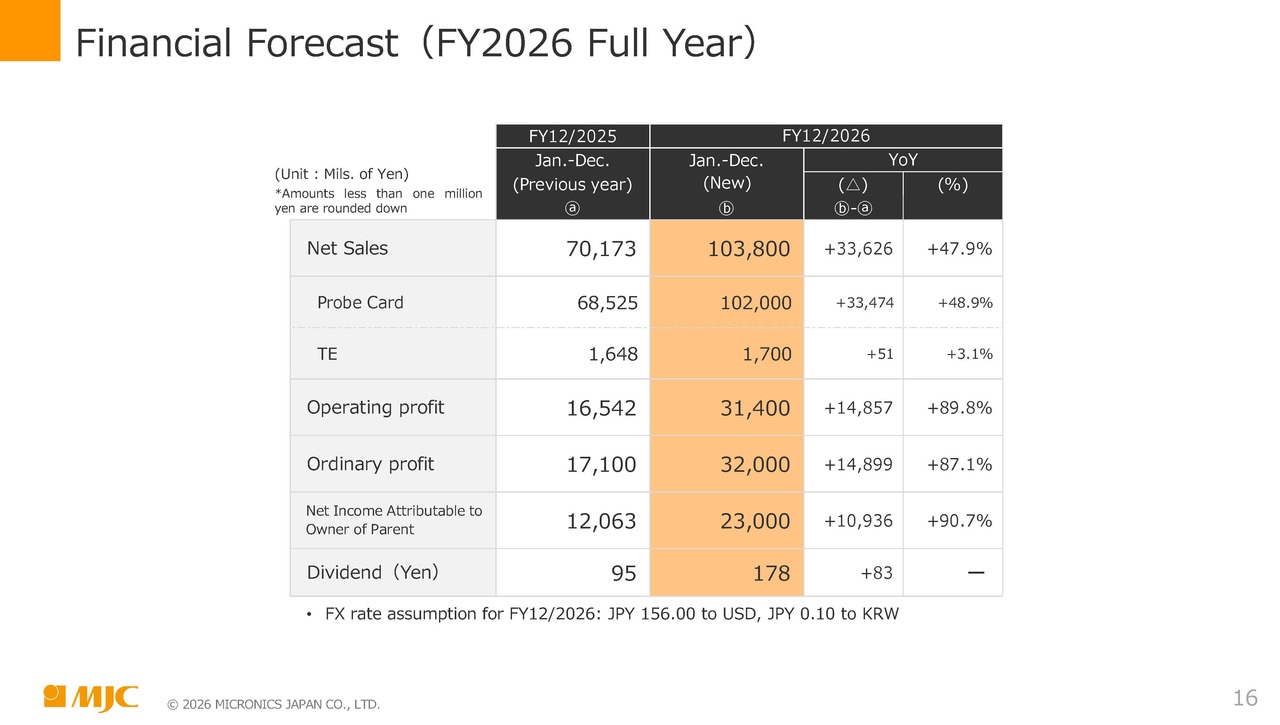
Because we announce forecasts two quarters ahead, I will also present our full-year forecast.
We forecast full-year net sales of JPY103.8 billion, comprising JPY102.0 billion in the probe card business and JPY1.7 billion in the TE business. Operating profit is projected at JPY31.4 billion, ordinary profit at JPY32.0 billion, and net income attributable to owners of parent at JPY23.0 billion, all representing increases from the previous year.
We have raised our dividend forecast to JPY178 per share from JPY95 in the previous year, an increase of JPY83.
Forecasts for R&D, Capex and Depreciation
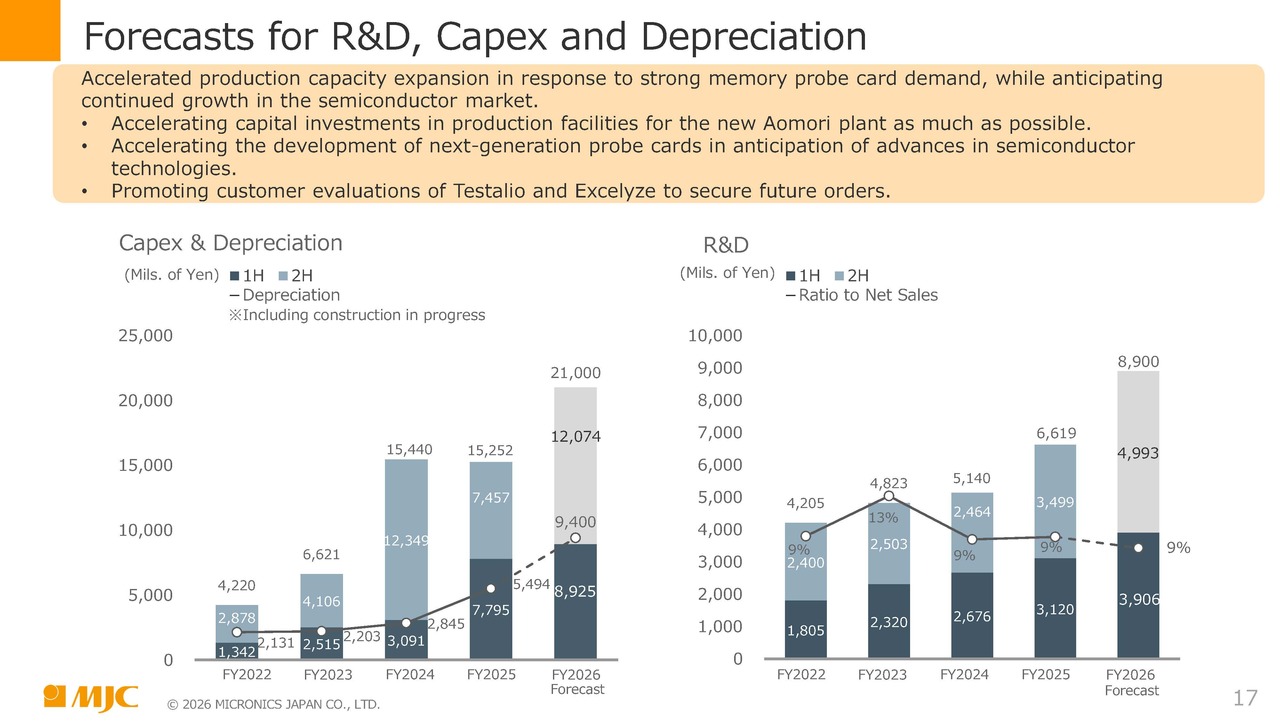
I will now discuss capital expenditures and R&D investment. In anticipation of medium- to long-term growth in the semiconductor market, we are proactively bringing forward plans to expand production capacity in response to the current robust demand for memory probe cards.
We are bringing forward investment in production equipment for the new Aomori plant building, completed in December 2024, to the greatest extent possible.
We are also accelerating the development of technologies for next-generation probe cards in anticipation of advances in semiconductor technology. Specifically, we are developing vertical-type probe cards.
Testalio and Excelyze are, respectively, a tester and a prober currently under development. Customer evaluations are underway as we work to secure orders.
As shown in the lower left of the slide, we plan full-year capital expenditures of JPY21.0 billion. R&D investment, shown in the lower right, is planned at JPY8.9 billion.
Progress of FV26
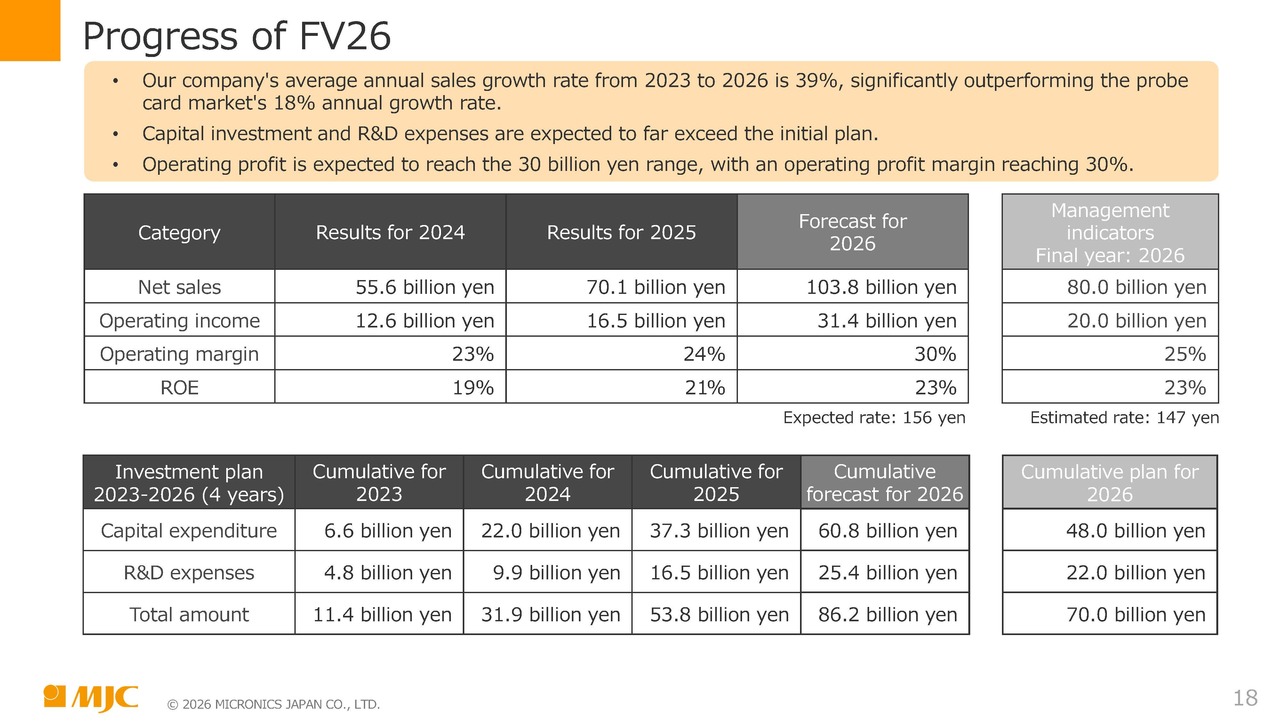
I will now discuss the progress of FV26. Net sales have grown at a CAGR of 39% during the current medium-term management plan, which began in 2023, significantly outperforming the probe card market CAGR of 18%.
Capital expenditures and R&D expenses are expected to substantially exceed the initial plan. This reflects the need to bring forward capital expenditures and accelerate development work to support customers' new products.
Operating profit is expected to reach the JPY30 billion range, with the operating margin reaching 30%, significantly exceeding our initial assumptions.
Thanks in part to the additional production capacity created by bringing forward capital expenditures, we expect full-year net sales to exceed JPY100 billion for the first time in the Company's history.
Medium- to Long-term Business Environment (Semiconductor Market)
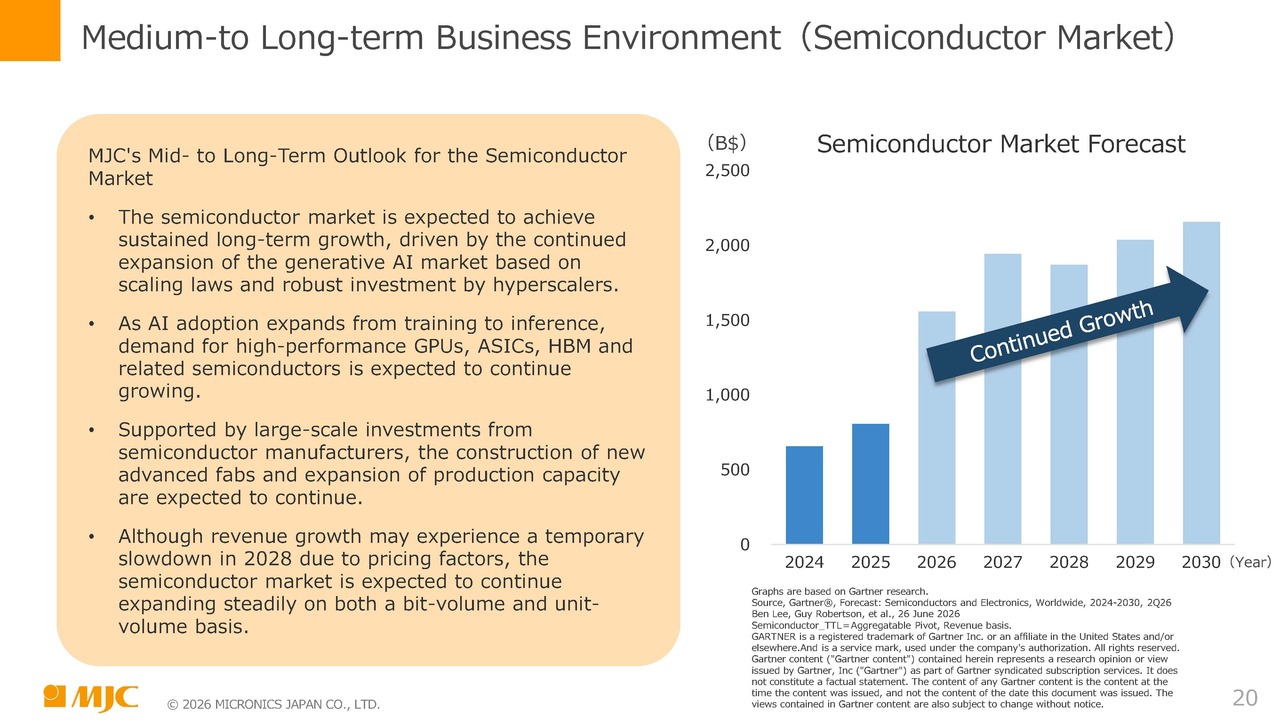
I will now discuss our medium- to long-term outlook for the business environment and the semiconductor market.
We believe the generative AI market is the key driver of the semiconductor market. The generative AI market continues to expand in line with scaling laws, and robust investment by hyperscalers is expected to support medium- to long-term growth in the semiconductor market.
AI adoption is expanding from training to inference, driving continued growth in demand for high-performance GPUs, ASICs, HBM, and related semiconductors. As AI evolves into physical AI, we expect applications in robotics and other fields to expand, generating further growth.
In addition, large-scale investment by semiconductor manufacturers is driving the construction of new advanced fabs and the expansion of production capacity.
Although revenue growth may temporarily level off in 2028 due to pricing factors, we expect the semiconductor market to continue expanding steadily on a bit-volume and unit-volume basis.
Although 2028 is expected to mark a temporary plateau in revenue growth, major memory manufacturers are scheduled to start up new plants and begin mass production around that time. Revenue growth is therefore expected to slow only temporarily as price increases level off.
Because probe card demand is driven more by unit volumes than by prices, we expect the probe card market to continue growing steadily.
Medium- to Long-term Business Environment (Memory Semiconductor Market / Non-Memory Semiconductor Market)
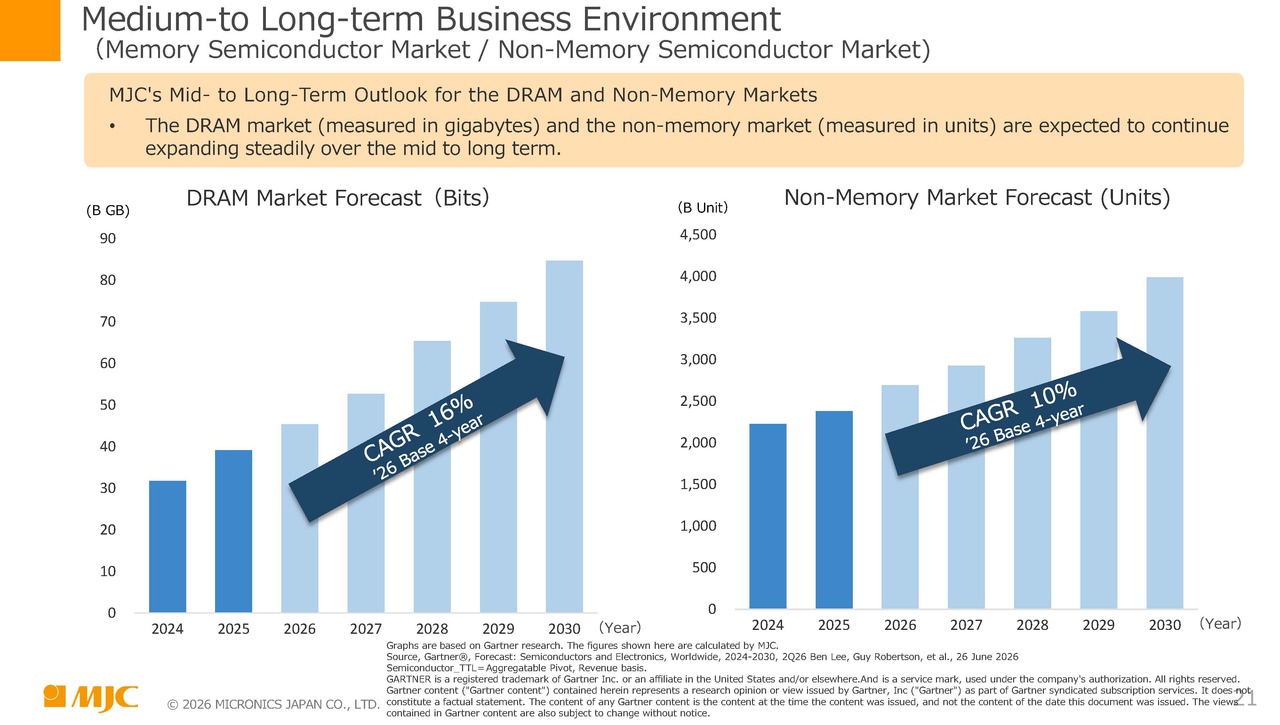
I will now discuss the medium- to long-term business environment for the DRAM and non-memory semiconductor markets.
The DRAM forecast is presented on a bit-volume basis, while the non-memory forecast is presented on a unit-volume basis. Both therefore represent volume forecasts rather than price forecasts and are expected to trend upward. The forecasts are based on Gartner research, with the figures calculated by the Company.
In our medium- to long-term outlook, the DRAM market is expected to grow at an average annual rate of 16% from 2026 through 2030, while the non-memory market is expected to grow at 10%.
Medium- to Long-term Business Environment (Probe Card Market)
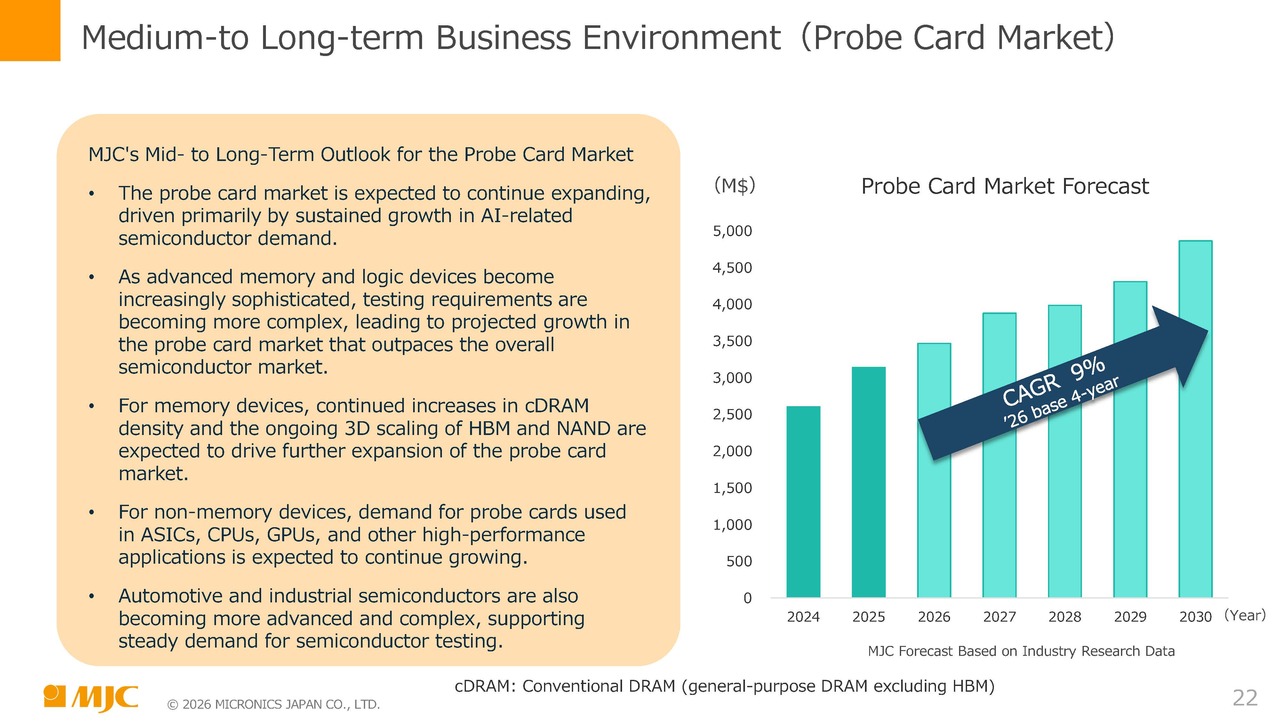
The green bar chart on the right shows the probe card market forecast. Because the overall market includes both logic and memory applications, its average growth rate is 9%. We expect growth in the memory segment to exceed this rate.
In our medium- to long-term outlook, the probe card market is expected to continue expanding, driven by AI-related semiconductors. As advanced memory and non-memory semiconductors become more sophisticated and testing becomes more complex, we expect the probe card market to outpace the overall semiconductor market.
For memory semiconductors, rising cDRAM prices and the continued 3D scaling of HBM and NAND are expected to drive further growth in the probe card market.
For non-memory semiconductors, we expect the market for probe cards used in ASICs, CPUs, GPUs, and other applications to expand further.
Automotive and industrial semiconductors are also becoming more sophisticated and complex, supporting solid demand for testing. We are confident that this trend will extend beyond generative AI ICs to automotive applications and industrial robots, lifting growth in these fields as well.
Overview of Business
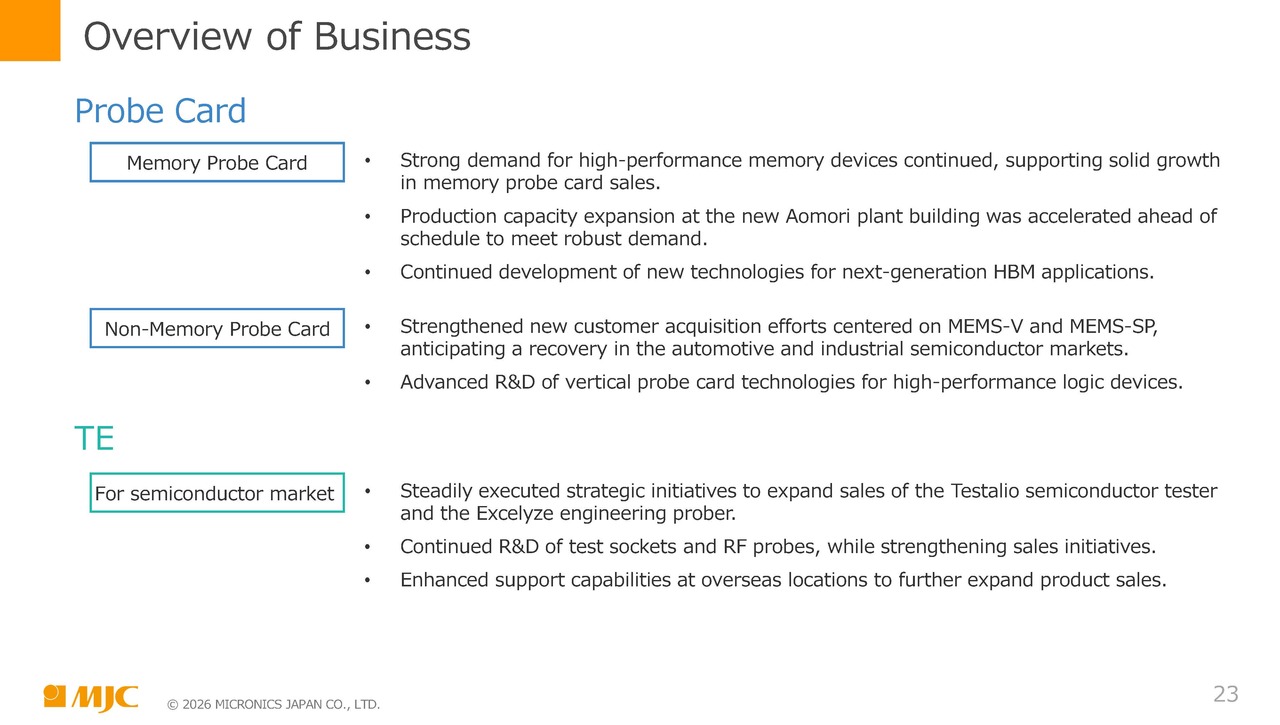
This slide provides an overview of our business.
In the probe card business, robust demand continues, particularly for high-performance memory, and memory probe cards remain strong. We are accelerating production capacity expansion at the new Aomori plant building ahead of schedule to meet this demand. We will also continue developing new technologies for next-generation HBM.
For non-memory applications, we will strengthen new customer acquisition efforts centered on MEMS-V and MEMS-SP, in anticipation of a recovery in the automotive and industrial semiconductor markets.
We view the development of vertical-type probe card technologies for high-performance logic devices as an urgent priority. Because vertical-type probe cards are also expected to expand into memory applications, we intend to place particular emphasis on their development.
In the TE business, we will steadily implement strategic initiatives to expand sales of the Testalio semiconductor tester and the Excelyze engineering prober. These two products were originally expected to contribute to net sales and profit during FV26. Development took somewhat longer than planned, however, and the products have only recently reached the customer evaluation stage. We hope you will look forward to their future growth.
We will also continue R&D and sales enhancement initiatives for test sockets and high-frequency RF probes. These RF probes can be sold together with the Excelyze engineering prober, and we intend to focus on these areas. To further expand product sales, we also need to enhance support capabilities at our overseas locations. Sales of testers and probers naturally require after-sales support, and we intend to steadily increase net sales and profit in this area as well.
Q&A: Production Capacity and Expansion Plans
Questioner: You have expanded production capacity ahead of the industry and are steadily gaining market share. Could you explain your production capacity? What is the maximum production capacity for probe cards that you expect to have this fiscal year, and at what pace and over what timeframe do you plan to expand it going forward?
Hasegawa: Thank you for that important question. We are building out our probe card production capacity ahead of schedule. We do not disclose capacity in terms of units, but on a sales-value basis, we expect quarterly capacity to be approximately JPY25 billion to JPY30 billion from this fiscal year into the next.
This figure may vary depending on the product mix and customer circumstances, but that is the approximate level when production capacity is expressed on a sales-value basis.
We are currently making capital expenditures to bring forward capacity originally planned for 2027, although the figures may change depending on progress. We expect this investment to begin contributing in 2H 2027, bringing us closer in 2028 to our goal of establishing a structure capable of consistently generating average quarterly sales of around JPY30 billion.
Questioner: Your net sales plan for the probe card business is JPY102.0 billion this fiscal year. If quarterly capacity is JPY25 billion to JPY30 billion, the maximum annual capacity would be JPY120 billion, which feels somewhat underwhelming. Is there room for further growth?
Hasegawa: We are bringing forward investment this fiscal year to meet expectations, so I would ask you to view the figures I just mentioned as a somewhat conservative outlook.
Q&A: Impact of Geopolitical Risks and Other Factors
Questioner: I would like to ask about the impact of geopolitical risks and other factors. As noted in your disclosure materials, the outlook for global conditions, including the situation in the Middle East, remains highly uncertain. The yen also remains weak, while interest rates continue to rise.
Against this backdrop, how do you view increases in raw material, energy, logistics, and personnel costs? Could you also comment on the measures you plan to take to mitigate the impact of geopolitical risks?
Katayama: Regarding the impact of geopolitical risks and other factors on our business, there is little direct impact from energy costs, although we are seeing a slight impact on infrastructure-related expenses.
For example, we use heavy fuel oil to operate our clean rooms, so there is some impact, but it is very limited. Based on our current estimates, the impact is not material and is not expected to reach hundreds of millions of yen.
Turning to personnel expenses, we employ people globally, and labor costs are gradually rising in each country.
We expect to have approximately 2,000 employees at the end of the fiscal year, of whom approximately 1,500 will be employed by the parent company in Japan. Although personnel expenses are rising overall, we therefore believe that higher labor costs in Japan are having a particularly noticeable impact.
On the procurement side, we are placing orders ahead of schedule after carefully reviewing our requirements, taking geopolitical risks and supply chain conditions into account. For key components in particular, we carefully assess the quantities needed and secure them in line with our business activities.
Regarding the weaker yen, our forecast for this fiscal year assumes JPY156 to the U.S. dollar, and we are monitoring the impact on results. As for interest rates, our outstanding borrowings are very limited. We have arranged a flexible syndicated loan facility focused on short-term rather than long-term funding, allowing us to repay or borrow as necessary. The impact of interest rates is therefore largely limited to the short term.
Hasegawa: Some investors may be concerned that rising material costs could reduce profitability in the probe card business. Although raw material prices are currently trending upward, we have not yet reached a point where we need to raise probe card prices.
There could be some issues with the production equipment we plan to install, such as delivery delays or changes in materials. At this stage, however, these issues have not caused any delays to our plans. We therefore believe that any impact on our manufacturing operations remains minimal.
Q&A: Expanding Memory Probe Card Market Share and Production Capacity
Questioner: Looking to the next fiscal year and beyond, and in connection with your next medium-term management plan, you discussed bit growth on the demand side, primarily for DRAM and other memory products. Ultimately, demand will depend on growth in those markets. Testing times are also likely to become longer, which may make manufacturing more difficult.
Your current share of the memory probe card market is estimated at around 40%. As the market expands, do you plan to expand production capacity simply to maintain your current share?
Alternatively, if you aim to expand sales beyond the major customers disclosed in your Annual Securities Report, you would presumably need to increase capacity further. In that case, your market share could ultimately rise as well.
As the market expands, what level of market share are you targeting, and how do you plan to build the capacity needed to support it?
Hasegawa: We hold the No. 1 position as a supplier of memory probe cards. We therefore want to build strong relationships with every memory manufacturer.
At the same time, we recognize that our current capacity is insufficient to meet all demand. We have announced plans for continued investment from the next fiscal year onward, and we intend to bring that investment forward as much as possible.
We recently announced our plans through 2028, but we also need to formulate plans from 2H 2026 through 2027 with the period beyond 2028 in mind.
All DRAM manufacturers have very high expectations for us. We also expect to receive increasingly accurate forecasts of the unit volumes they require. We want to build a structure that enables us to meet those expectations.
Our disclosures divide net sales into Asia, Japan, the United States, and Europe, which may make detailed analysis difficult. However, the relatively low share of sales in Japan indicates that there are still customers in Japan whose demand we are not fully serving.
With that in mind, we believe we must continue making large-scale investments. This is also essential to maintaining our No. 1 position as a supplier of memory probe cards.
Questioner: You currently hold the No. 1 market share, but despite receiving customer requests, demand has grown so rapidly over the past several years that supply has not kept pace. Is it correct to understand that you now intend to step up investment further and strengthen your supply structure?
Hasegawa: From our customers' perspective, I believe we are recognized as a supplier that can provide stable volumes by agreed delivery dates. Customers are continuing to plan and implement investments, but I do not expect our market share to increase sharply in the immediate future.
The 2025 market data show that we maintained a 41% share of the memory segment and retained the No. 1 position. Our production sites continue to operate without any major issues in 2026, and we hope to achieve a higher share than in 2025. We appreciate your continued support and will keep working hard to deliver results worthy of that support.
Q&A: Next Medium-Term Management Plan and Outlook for the Supply Structure
Questioner: Will the next medium-term management plan begin next year and again cover four years? You have also announced the acquisition of land in Oita, but a facility on the site may not be built and become operational until sometime between 2028 and 2030. From an outside perspective, establishing the supply structure for this period appears likely to be one of the themes of next year's medium-term management plan. Is that understanding correct?
Hasegawa: We intend to carefully consider the timing of the next medium-term management plan announcement. When we formulated FV26, which runs through 2026, the plan did not yet assume that HBM would grow in a similar manner across all DRAM manufacturers and expand so rapidly.
Now that new DRAM-based HBM products have been developed, we need to carefully assess how the Company can grow further.
In fact, we initially intended to establish a medium-term management plan through 2025. The plan was originally intended to be FV25, but it ultimately became FV26 because of our commitment to thoroughly examining its content before implementation. We hope you will understand the reasoning behind this approach.
Ideally, we would like to transition seamlessly into the next medium-term management plan beginning in 2027.
Questioner: So, ideally, you would announce the medium-term management plan around February next year, at the start of the new fiscal year. Is that correct?
Hasegawa: I believe that would be the best timing.
Q&A: Profit Margin Level and Future Policy
Questioner: Your profit margin is exceptionally strong. Q2 may have included some highly profitable projects, but even after accounting for substantial increases in depreciation and labor costs, your underlying earnings power appears solid. Are you strongly committed to maintaining a margin of around 30%?
Naturally, you need to meet customer demand, and net sales are also likely to grow accordingly. At the same time, the cost pressures discussed earlier are likely to increase. Can you provide any guidance on the level of profit margin you are aiming to maintain?
Hasegawa: We will work to maintain a margin of around 30%. The Q2 operating margin exceeded 30%, an exceptionally strong result. This reflected several favorable factors: some sales shifted from Q1 into Q2, while other sales were brought forward from Q3 into Q2. We were pleased that the result exceeded our expectations.
Conversely, Q3 will be more challenging, and I expect the ultimate level to settle at around 30%. At the same time, employees on the production floor have gained confidence from seeing how much profit can be generated by operating our plants efficiently. We therefore intend to maintain this level, particularly while memory products remain the main driver of our business.
Questioner: Expectations for your company appear to have risen another notch or two. You have demonstrated through your results what you can achieve, and we now look forward to even stronger performance.
Q&A: Capturing Business Opportunities
Questioner: The business environment currently provides a strong tailwind. The largest South Korean manufacturer is accelerating its investment in HBM, Chinese memory manufacturers are making large-scale investments, and a Japanese NAND manufacturer has resumed investment. Demand for DDR5 probe cards is also expected to increase substantially.
Are you in a position to capture all of these business opportunities? Or could geopolitical or competitive factors prevent you from capturing some of them?
Hasegawa: We believe we are in a position to capture these business opportunities. However, demand is currently so strong that we cannot accommodate every request.
Questioner: In other words, you can serve demand wherever it arises, and there are no issues such as export restrictions or an inability to sell because you do not currently have a business relationship in a particular market. Is that correct?
Hasegawa: That is correct. We are not subject to restrictions that prevent us from selling to third countries.
Q&A: DRAM Demand and Momentum in HBM and Conventional DRAM
Questioner: I would like to ask about demand. I understand that you do not separately disclose orders for HBM and conventional DRAM, but which is seeing stronger demand? Is there any difference in order momentum?
We have heard that some other companies are seeing a slight postponement of HBM orders. Are you seeing no such trend among your customers? We understand that you have received a very high level of orders, but could you comment separately on conventional DRAM and HBM in terms of the change in momentum from Q1 to Q2 and the outlook going forward?
Shigeki Toda (hereafter, "Toda"): My name is Shigeki Toda, General Manager of the Corporate Planning & Strategy Office. I will answer that question.
As you saw earlier, DRAM accounts for the vast majority of our memory-related net sales. HBM represents more than half of DRAM net sales and has remained in the 50% range in quarterly comparisons since last year. Demand for HBM therefore remains strong.
Conventional DRAM and mobile DRAM fluctuate slightly from quarter to quarter, but their overall shares have remained stable while orders received have increased. Because the HBM share has not changed significantly, we believe demand for conventional DRAM and other products is also relatively strong. We expect this trend to continue.
Questioner: Given such strong demand, are you considering price increases?
Toda: We have not raised prices for individual products or implemented an across-the-board increase for probe cards. As I mentioned in discussing the improvement in our profit margin, however, we continue to receive orders for products with a very high degree of technical difficulty. As a result, we are receiving more orders for high value-added products, which is driving an upward trend in the profit margin.
Average selling prices are also rising as a result. Although we have not implemented an across-the-board price increase, the shift toward higher value-added products is effectively producing a similar result.
Q&A: Q2 Market Share Trend and Full-Year Outlook
The next question is: "How did your share of the memory probe card market change during the quarter?"
The reality is that we cannot accurately measure market share on a quarterly basis. Looking at our competitors, however, memory probe card sales are trending upward across the industry.
As explained earlier, our own Q2 net sales also increased substantially. We therefore believe that our market share rose slightly in Q2. We cannot provide a specific figure because we are unable to measure it precisely, but we believe the direction was upward.
Both our competitors' sales and our own fluctuate from quarter to quarter, so market share needs to be assessed over the full year. However, because we are bringing forward production capacity expansion, we believe our share can increase over the course of the year.
Q&A: Future Growth Drivers in the TE Business
The next question is: "Why are you more optimistic about the outlook for the TE business, and which products will drive its growth?"
Hasegawa: Our main earnings driver at present is the test socket that we call a "package probe." Sales of this product are growing very steadily, and we expect further growth in Taiwan, China, and other markets.
Our products focus on high-frequency applications. Although socket unit prices are lower than those of probe cards, we are targeting a relatively profitable segment.
In addition, as I mentioned in my presentation, we expect customer evaluations of the Excelyze engineering prober and the Testalio tester to lead to commercial deliveries. We believe these products will be future growth drivers.
Q&A: Q2 Net Sales and Profit Results and the Q3 Financial Forecast
Toda: The next question is: "Why do you forecast net sales to decrease QoQ in Q3 and increase QoQ in Q4? Also, why is the projected QoQ decline in Q3 operating profit large relative to the decline in net sales, with net sales down JPY3.3 billion and operating profit down JPY3.0 billion?"
I will provide an overview. Q2 net sales included sales carried over from Q1 and sales brought forward from Q3. As a result, Q2 net sales reached a level above what our normal production capacity would ordinarily support.
We had originally expected a large contribution from high-margin products in Q3 and therefore anticipated a very high operating margin for that quarter. However, much of this contribution was brought forward into Q2, and Q2 operating profit significantly exceeded our initial forecast.
In short, sales and profit rose substantially in Q2 primarily because sales were brought forward from Q3.
For Q3, the forecast has been lowered slightly from the previous forecast to reflect these sales brought forward. In addition, because high-margin products were brought forward into Q2, the Q3 operating margin is expected to decline, resulting in a forecast slightly below our initial assumptions.
Q&A: Order Trends and Outlook by Product
The next question is: "What is the level of order inquiries by product - HBM, conventional DRAM, and NAND? How did Q2 orders compare QoQ, and what is the outlook for Q3?"
We stopped disclosing specific order figures from this fiscal year, so I will refrain from commenting on numerical amounts. Qualitatively, however, orders received exceeded net sales in both Q1 and Q2.
We also expect a high level of orders from Q3 onward. We therefore expect orders received to remain very strong and order backlog to continue trending upward.