Table of Contents
Shinichiro Fujisaki (“Fujisaki”): Hello, everyone. I am Fujisaki, President and CEO of AUCNET INC. Thank you very much for joining us or watching today’s financial results briefing for the first half of FY2026.
Following the strong first quarter, I am very pleased that we have again been able to announce very good results for the second quarter. I also feel that the market is paying a great deal of attention to us at present. Today, I hope to explain the results as clearly as possible and answer your questions afterward.
I will now walk you through the materials. The table of contents is on the screen. I will first cover the consolidated results summary for the first half, followed by the performance summary and details for each segment, and then topics.
FY2026 Second Quarter Cumulative Consolidated Financial Results
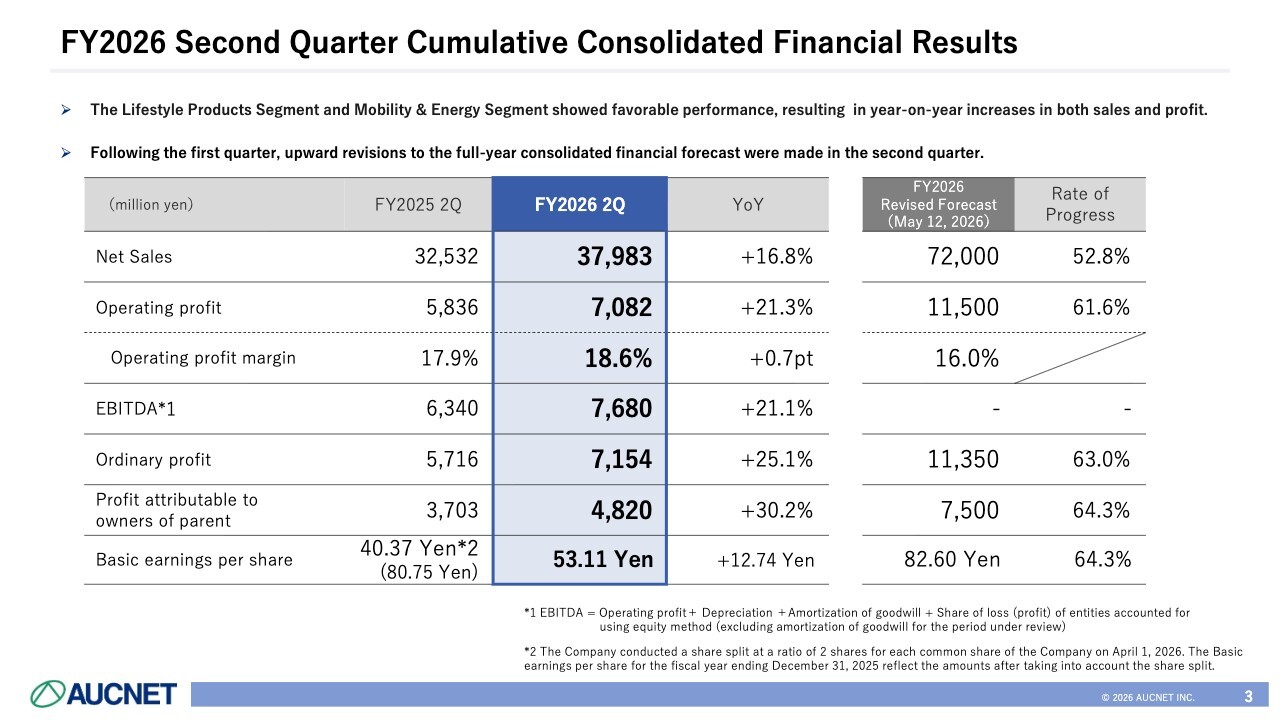
These are our consolidated results for the first half. Both of our major segments, Lifestyle Products and Mobility & Energy, performed well, resulting in year-on-year increases in both net sales and profit.
As in the first quarter, we have revised upward our full-year consolidated financial results forecast in the second quarter as well. I will explain the details later.
First, cumulative net sales through the second quarter were ¥37,983 million, up 16.8% year on year. As of May, before the latest upward revision, our full-year forecast was ¥72,000 million, and the progress rate against that forecast is 52.8%.
Operating profit was ¥7,082 million, up 21.3% year on year. The progress rate against the forecast announced in the first quarter is 61.6%. The operating profit margin was 18.6%, above both the year-earlier level and our forecast.
EBITDA was ¥7,680 million, up 21.1% year on year; ordinary profit was ¥7,154 million, up 25.1%; and profit attributable to owners of parent was ¥4,820 million, up 30.2% year on year.
Basic earnings per share were 53.11 yen, up 12.74 yen from the same period of the previous year.
FY2026 Second Quarter Highlights (Non-Cumulative 3 Month Results)
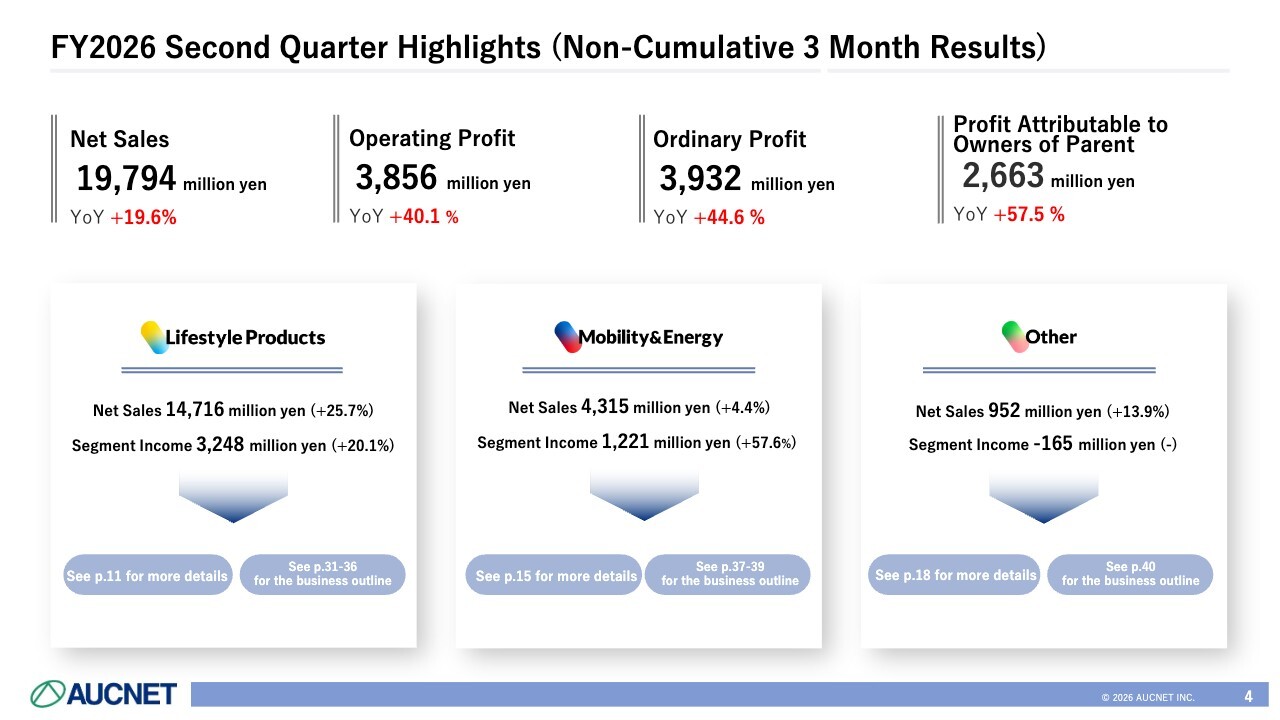
These are the highlights for the latest three-month period. Year on year, net sales increased 19.6%, operating profit increased 40.1%, ordinary profit increased 44.6%, and profit attributable to owners of parent increased 57.5%.
By segment, segment income for Lifestyle Products increased 20.1%, while segment income for Mobility & Energy, centered on used vehicles, increased 57.6%. The Other Segment posted a segment loss of ¥165 million.
The strong growth in Mobility & Energy reflects not only steady growth in the underlying business but also a favorable year-on-year comparison due to the one-time cost related to the stock remuneration plan for employees incurred last fiscal year, when the Company marked its 40th anniversary. Because the business has a very large number of employees, that cost had a significant impact on last year’s earnings and is one factor behind the increase in second-quarter profit this year.
FY2024~FY2026 Consolidated Financial Results by Quarter
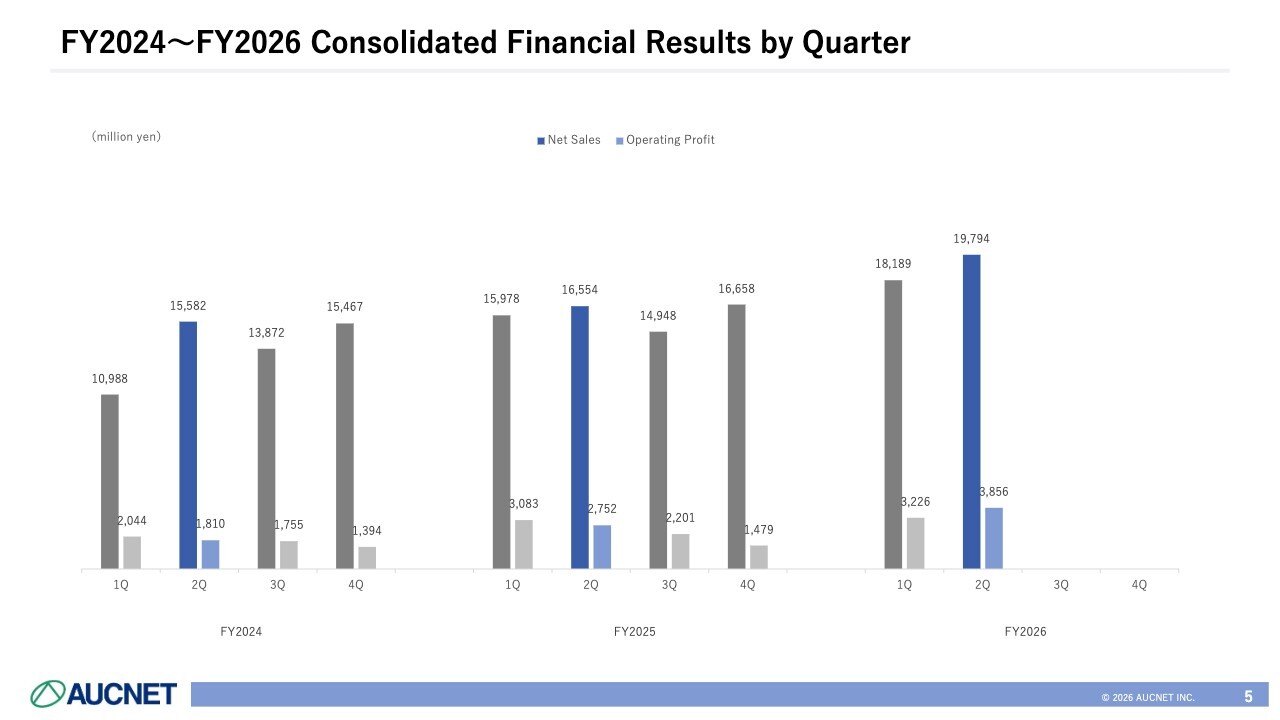
This chart shows our quarterly performance trend. As you can see, both net sales and operating profit have continued to grow steadily.
FY2026 Second Quarter Cumulative Results by Segment
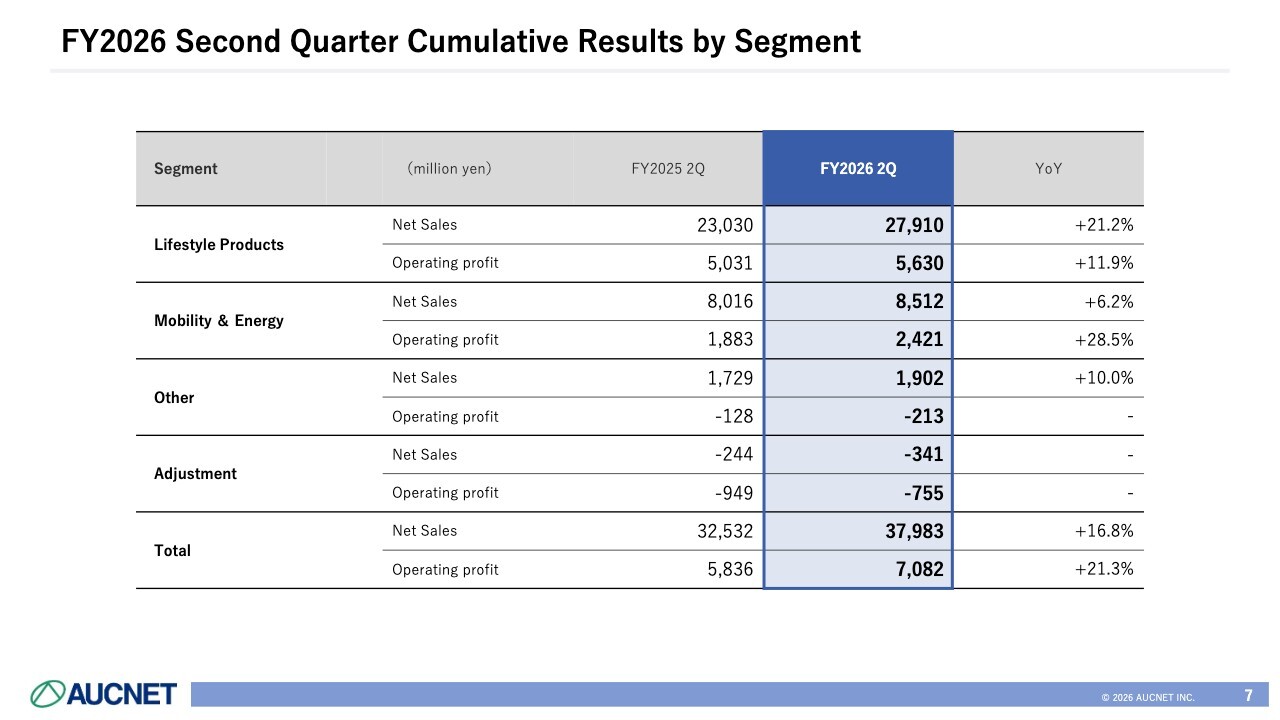
This is our performance by segment. I will start with operating profit. The Lifestyle Products Segment performed very well, with operating profit of ¥5,630 million, up 11.9% year on year.
The Mobility & Energy Segment also performed well, with operating profit of ¥2,421 million, up 28.5% year on year.
The Other Segment, which includes new businesses and the flower business, posted an operating loss of ¥213 million, widening the loss by approximately ¥100 million from the previous year.
After deducting Group-wide expenses and other adjustments, total operating profit was ¥7,082 million, up 21.3% year on year, or roughly 20% growth.
FY2026 Second Quarter Segment Increase/Decrease
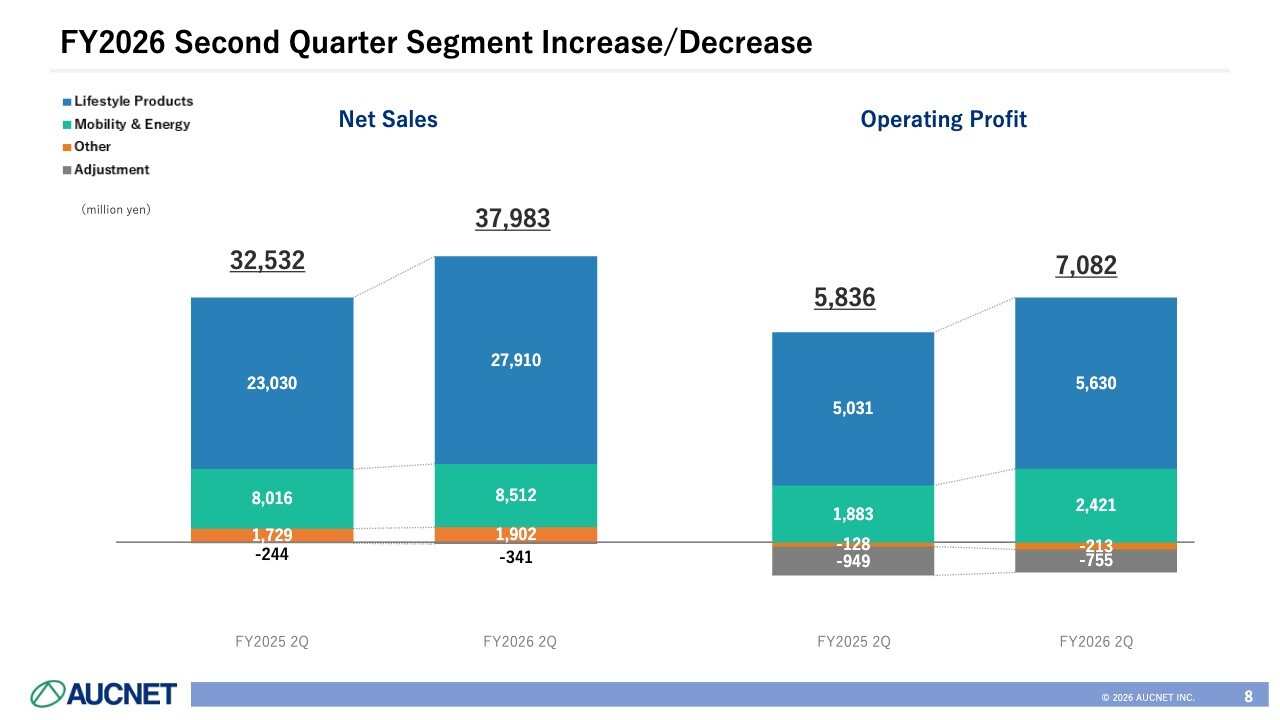
This chart shows the changes by segment that I just discussed. The left side shows net sales. The dark blue section is Lifestyle Products, which includes smartphones and luxury brand items. This segment also includes businesses targeting consumers, where we purchase and sell products, so net sales tend to be more volatile than in the automobile business.
The right side shows operating profit. Lifestyle Products increased 11.9% year on year and Mobility & Energy 28.5%. In amount terms, Lifestyle Products increased by approximately ¥600 million and Mobility & Energy by approximately ¥540 million, so both segments added more than ¥500 million.
FY2026 Second Quarter Cumulative Transaction Amount by Segment
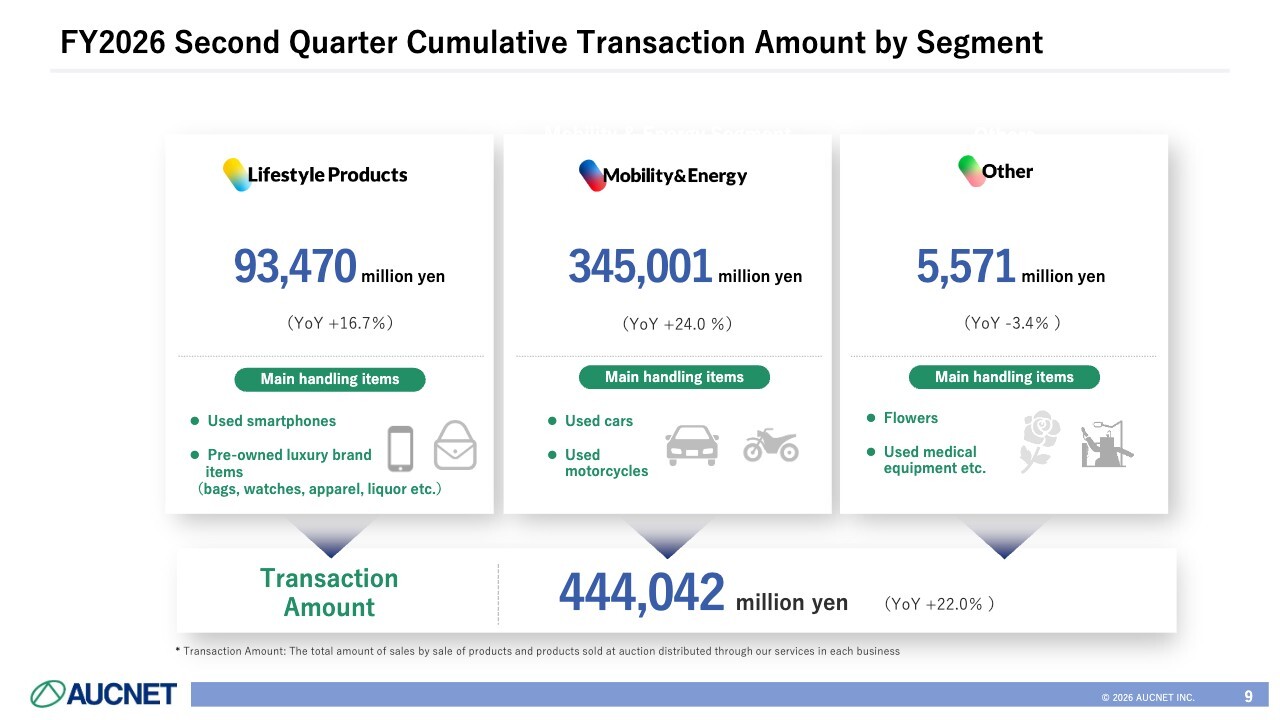
This is transaction amount by segment. Lifestyle Products was ¥93,470 million, up 16.7% year on year; Mobility & Energy was ¥345,001 million, up 24.0%; and Other was ¥5,571 million, down 3.4%.
Combined, total transaction amount for the Company was ¥444,042 million, up 22.0% year on year.
FY2026 Second Quarter Cumulative Results
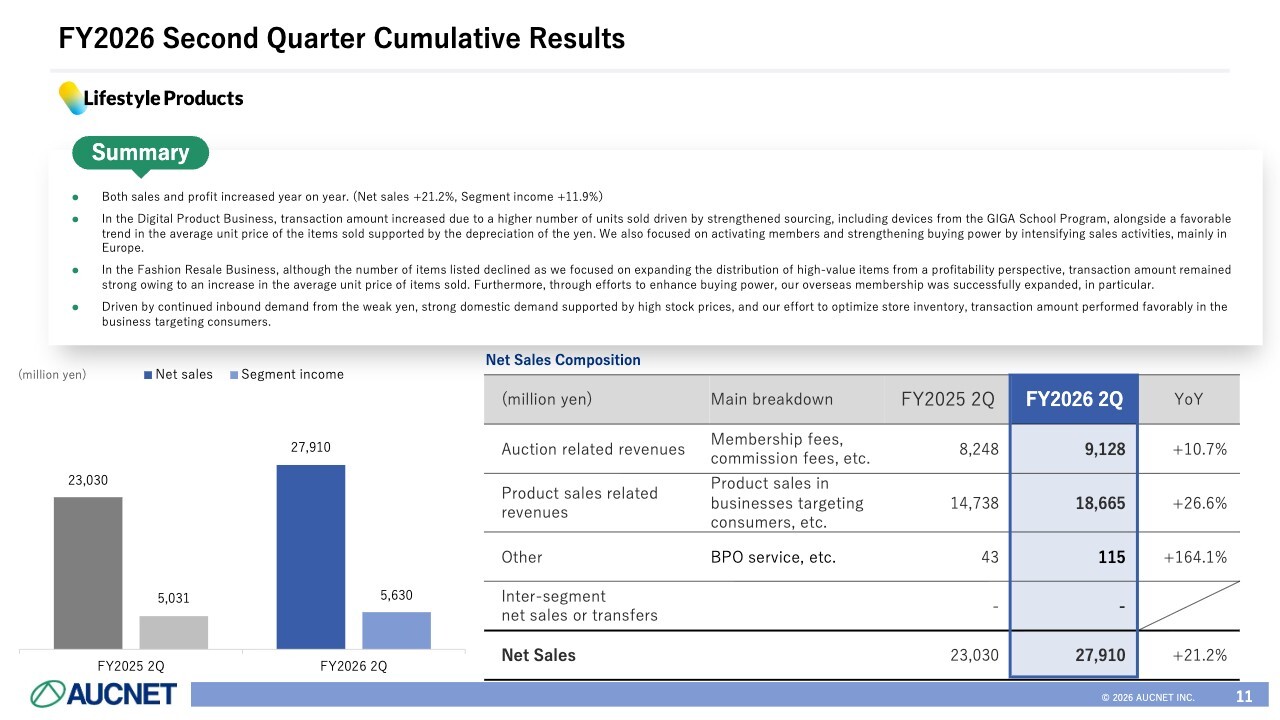
I will now go into the details for each segment. Lifestyle Products recorded year-on-year increases in both net sales and profit, with net sales up 21.2% and segment income up 11.9%.
In the Digital Product Business, centered on smartphones, devices distributed to elementary and junior high schools nationwide under the GIGA School Program, mainly iPads, are now reaching the point where they are being replaced after several years of use. In addition to successfully capturing these returned devices, we strengthened sourcing from new channels outside the GIGA School Program and stepped up sales efforts toward listing sources.
As a result, sales units increased, and foreign exchange movements also had a positive effect. Although the yen has recently strengthened somewhat, the exchange-rate impact was positive for the first half as a whole. With the average unit price of items sold remaining strong, transaction amount increased.
On the buyer side, we have established a base in Europe and are strengthening sales activities primarily there. Rather than simply increasing the number of members, we focused our sales efforts on activating existing members, which further strengthened buying power.
The Fashion Resale Business is our luxury brand goods business. To improve profitability, we focused on increasing the distribution of high-value items rather than lower-priced items.
As a result, although the number of items listed at auction decreased, transaction amount remained strong due to the higher average unit price of items sold.
In terms of buying power, as in the Digital Product Business, we strengthened this area in light of the strong popularity of our auctions among overseas customers. The increase in overseas members has contributed to growth in transaction amount.
In the business targeting consumers, inbound demand supported by the weak yen and domestic demand supported by high stock prices have continued. In addition, we have optimized store counts and inventory levels, and transaction amount has remained very strong.
The lower-right of the slide shows the net sales composition. Auction related revenues, including commission fees, increased 10.7% year on year. As shown in the second row of the table, product sales related revenues increased 26.6% year on year. This was mainly driven by the business targeting consumers, where strong sales of higher-priced items led to significant growth in net sales.
FY2024~FY2026 Results by Quarter
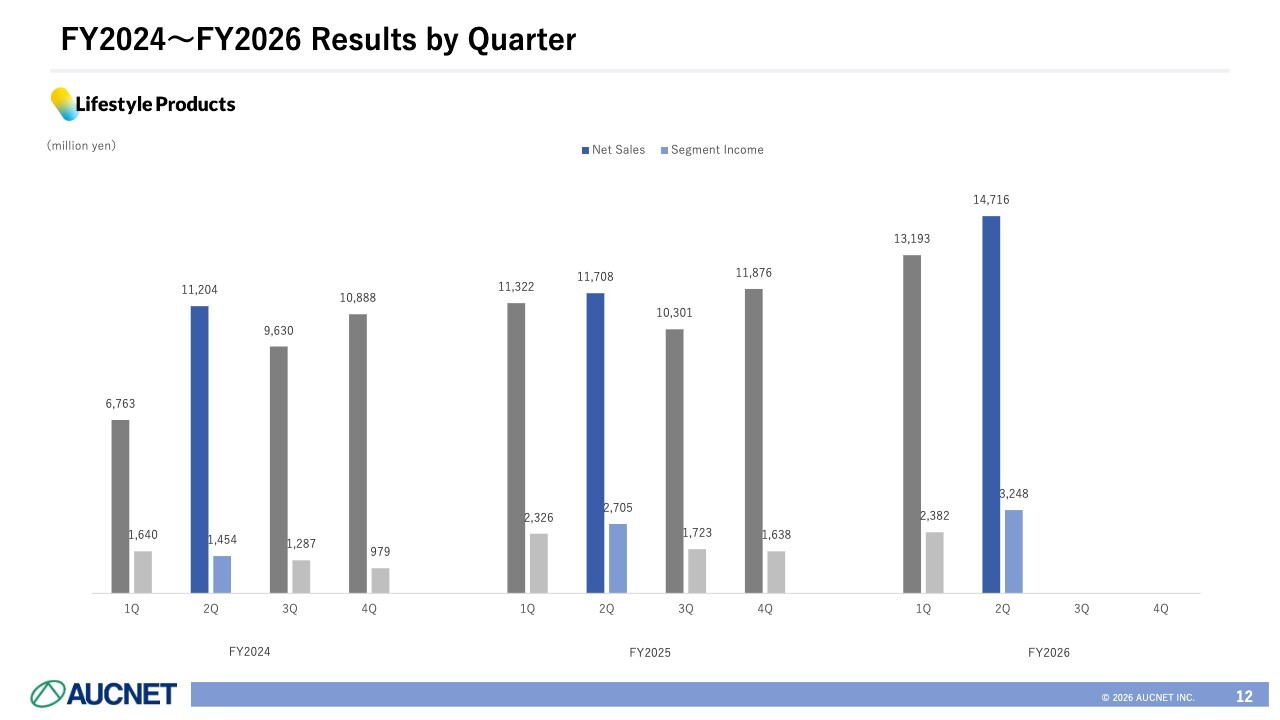
This shows the segment’s quarterly performance trend for reference.
FY2026 Second Quarter Business KPI
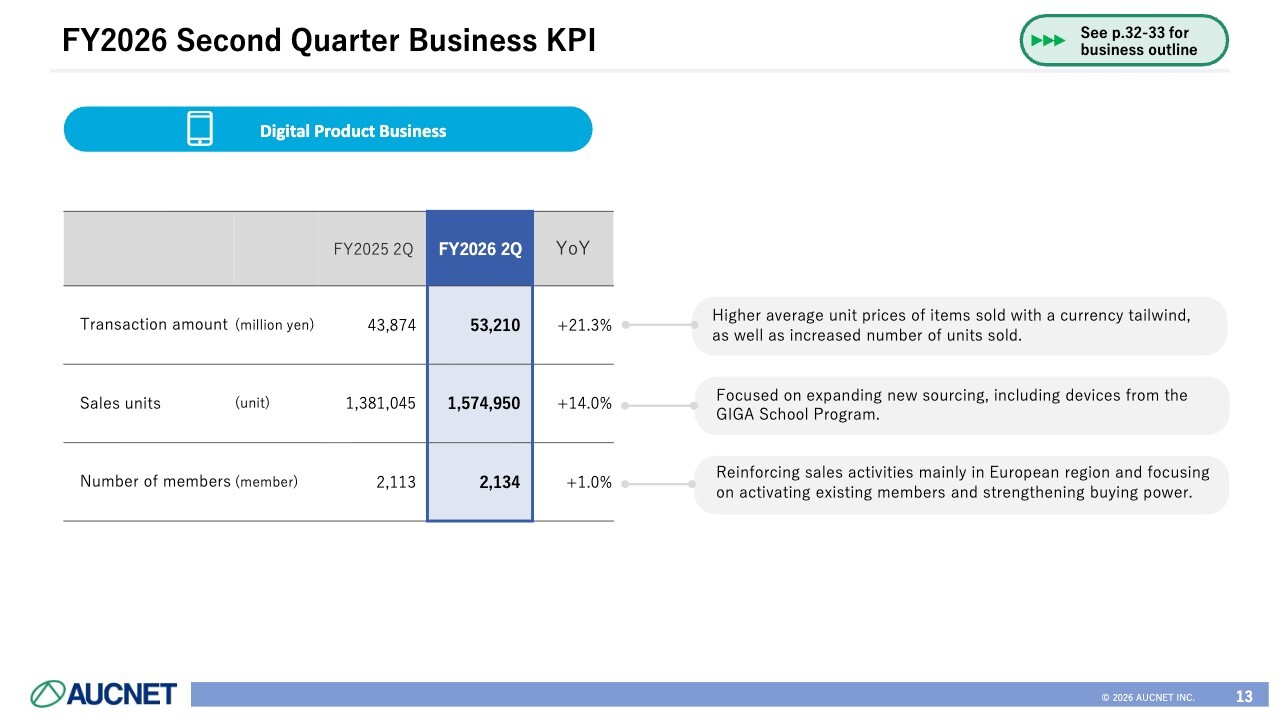
Turning to the KPIs, transaction amount in the Digital Product Business was ¥53,210 million, up 21.3% year on year. Foreign exchange had a positive impact, and the increase in sales units shown in the lower row of the table also contributed. Together, these factors drove transaction amount up by a little over 20%.
Sales units, meaning the number of units handled, were 1,574,950, up 14.0% year on year. As I mentioned earlier, we believe this increase reflects our focus on expanding new sourcing and listing channels, including those involving devices returned from the GIGA School Program.
The number of members, mainly overseas, was 2,134, up 1.0% year on year.
In Europe in particular, many members are retail-oriented businesses and tend to pay higher prices. Although they do not necessarily purchase large volumes, we recruited high-quality members and buyers willing to pay more. We also worked to activate existing members and strengthen buying power.
FY2026 Second Quarter Business KPI
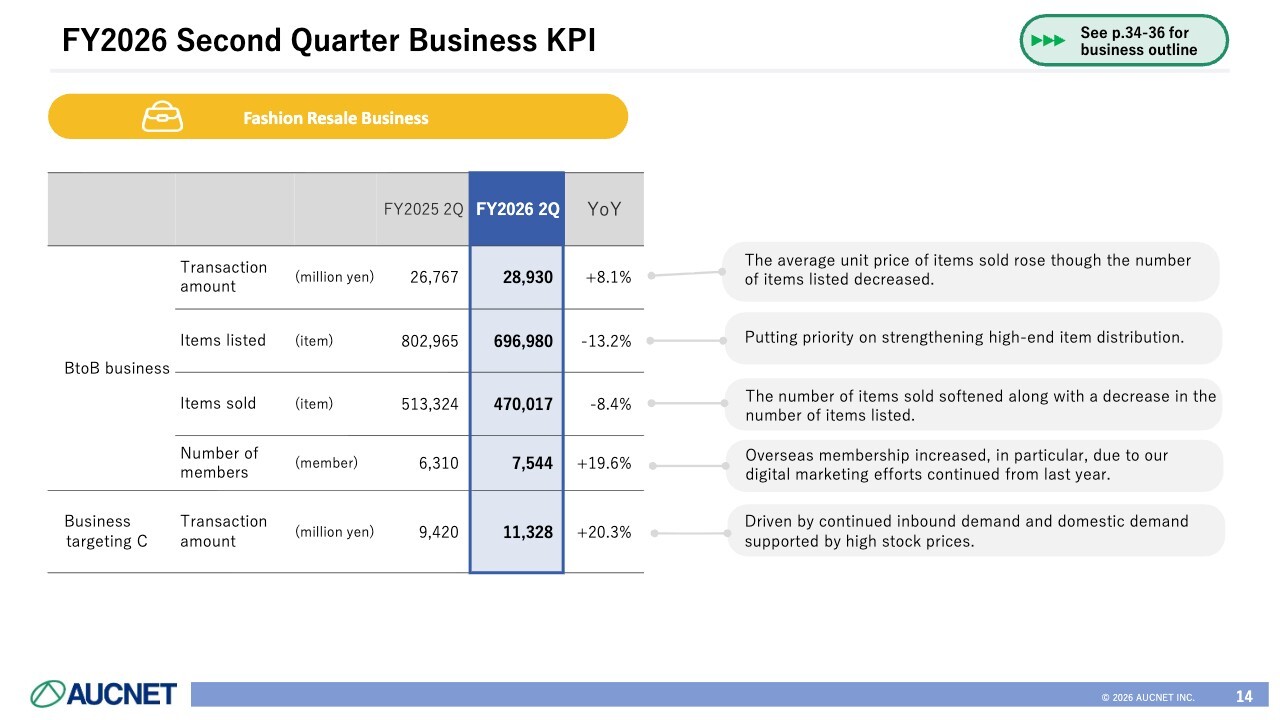
Turning to the Fashion Resale Business, transaction amount for luxury brand items, watches, bags, and similar products was ¥28,930 million, up 8.1% year on year.
The number of items listed decreased, but this was the result of deliberate control. As the average unit price rose, transaction amount, our most important KPI, remained solid.
We listed approximately 700,000 items, focusing on increasing the distribution of high-value items. For relatively low-priced items under ¥10,000, we somewhat restricted listings after considering the costs of product preparation and creating auction listings. By focusing on higher-priced items in this way, the number of items listed declined 13.2% year on year.
The number of items sold was 470,017, down 8.4% year on year. However, compared with the decrease in the number of items listed, the impact on the sell-through rate was relatively limited, which supported the overall sell-through rate and auction quality.
The number of members was 7,544. We are using digital marketing to strengthen sales efforts, particularly overseas. Because our auctions are primarily online, they are highly regarded by overseas buyers, and the number of buyers has increased markedly.
Finally, the business targeting consumers recorded transaction amount of ¥11,328 million, up 20.3% year on year. Continued inbound demand supported by the weak yen and domestic demand supported by high stock prices kept transaction amount solid.
In particular, the GALLERY RARE business, which handles relatively high-priced items, grew significantly and made a major contribution to the increase in transaction amount.
FY2026 Second Quarter Cumulative Results
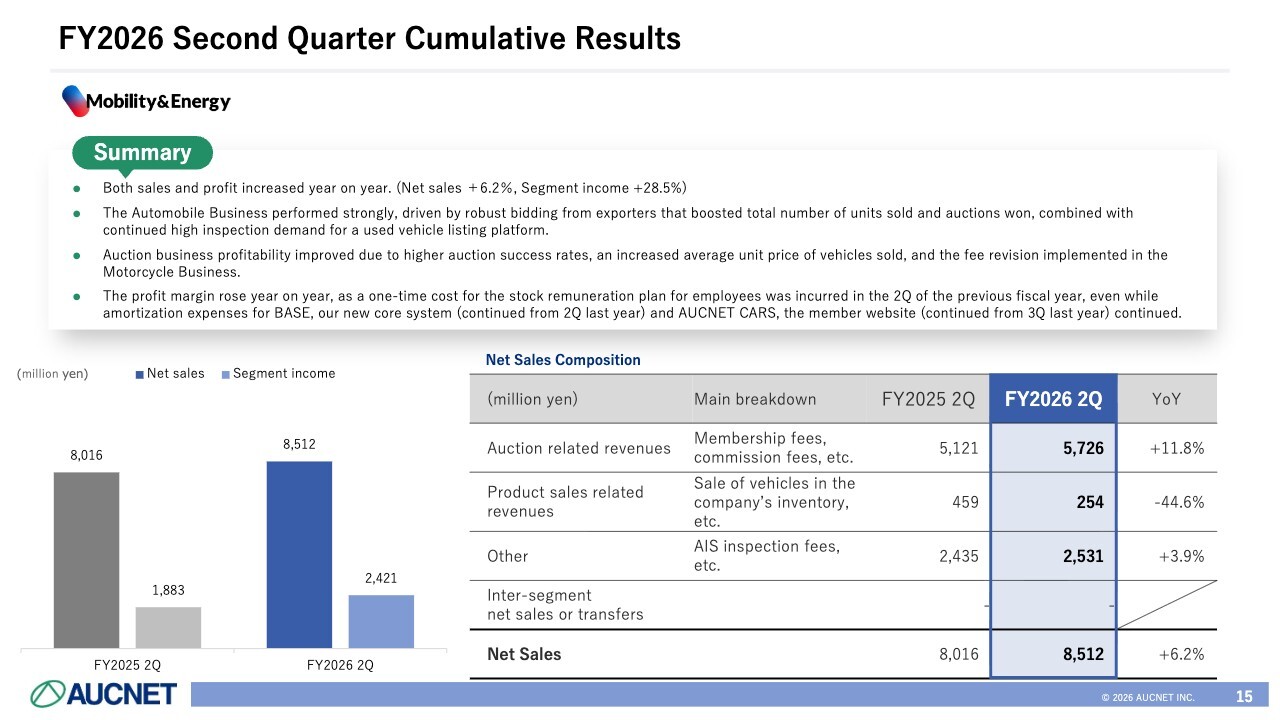
Turning to the Mobility & Energy Segment, this segment centers on the used car and used motorcycle businesses. Net sales increased 6.2%, while segment income rose 28.5%, resulting in year-on-year increases in both sales and profit.
In the Automobile Business, which handles used cars, bidding by exporters was particularly strong. In addition to substantial increases in completed transactions and successful bids, as well as in the number of vehicles matched between buyers and sellers, demand remained high for the used vehicle inspections we provide, including certified inspections for a used vehicle listing platform. As a result, both the auction and inspection businesses performed very strongly.
In the Motorcycle Business, which handles used motorcycles, both the auction success rate and the average unit price of vehicles sold increased. In addition, a fee revision implemented this fiscal year improved auction revenue and profitability.
Last year, we also renewed the core systems for used cars and used motorcycles and the website that members use directly to buy and sell vehicles, making a major investment. This resulted in annual amortization expenses of several hundred million yen. In FY2026, however, the businesses have absorbed these amortization expenses, and performance is improving year on year.
Last year also included a one-time cost related to the stock remuneration plan for employees. Taking these positive and negative factors together, we would like you to understand that the business as a whole is growing.
Auction related revenues, shown in the net sales composition at the lower right of the slide, are the foundation of our business and increased 11.8% year on year, showing very strong performance.
FY2024~FY2026 Results by Quarter
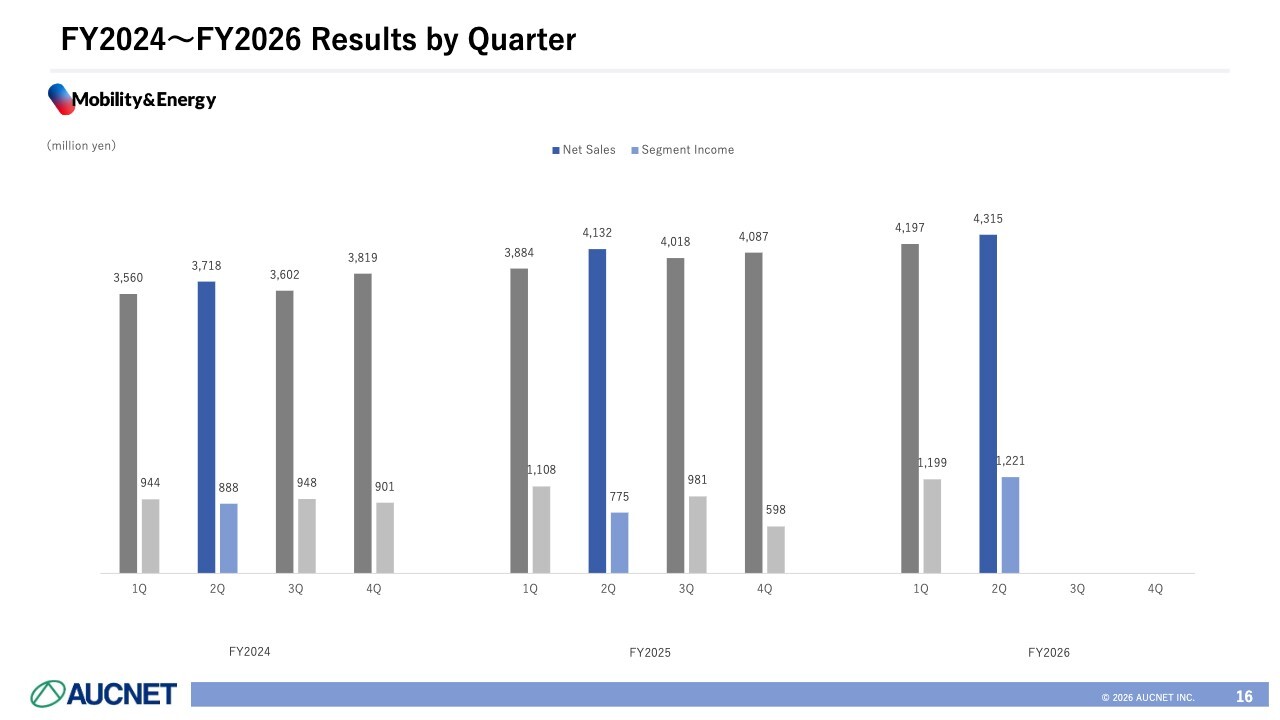
This is the quarterly trend for the Mobility & Energy Segment. Compared with Lifestyle Products, this business has generally been relatively solid and stable, but this year we have seen somewhat stronger growth.
FY2026 Second Quarter Business KPI
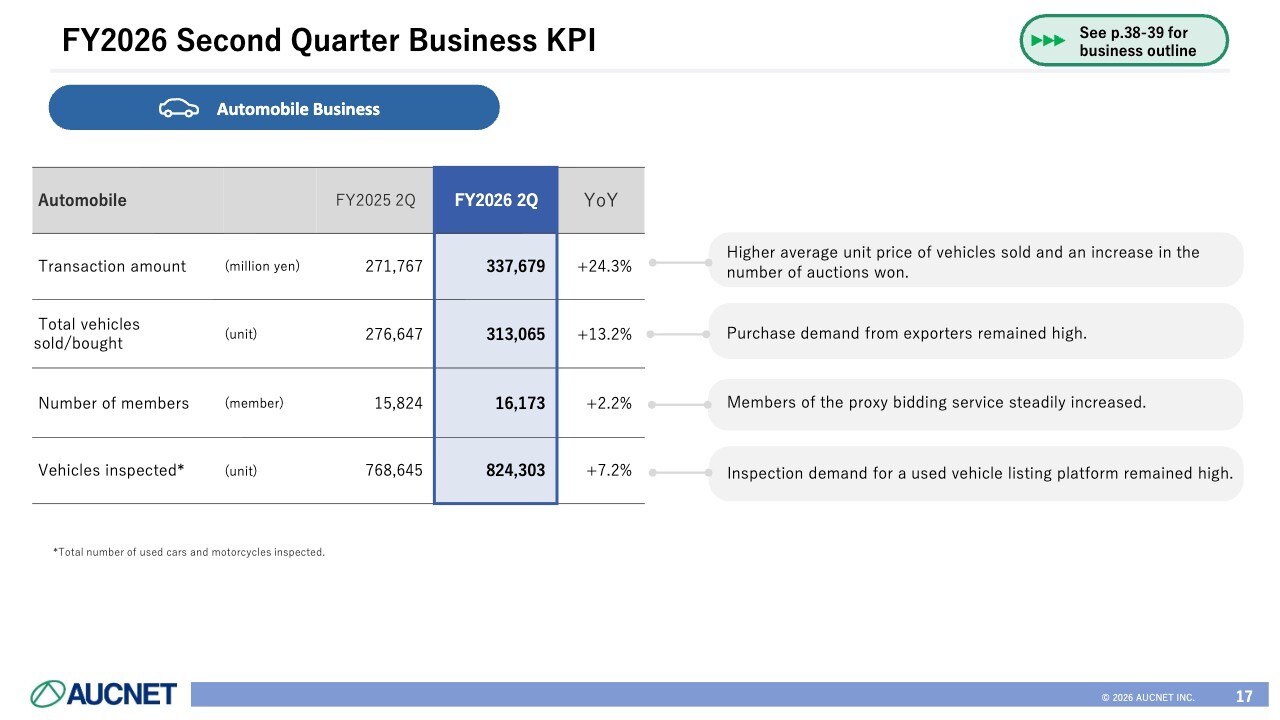
Let me explain the KPIs. Transaction amount in the Automobile Business was ¥337,679 million, up 24.3% year on year. The main driver was a significant increase in the average unit price of vehicles sold. Combined with an increase in the number of auctions won, this led to strong results.
In addition to transaction amount, total vehicles sold/bought also has a direct impact on our business. Total vehicles sold/bought in the first half came to 313,065, up 13.2% year on year, representing a very high volume of transactions.
For the market as a whole, we understand that the number of successful bids increased by around 3% to 4%. By contrast, the number of vehicles bought and sold through our platform increased by more than 10%. Continued strong purchasing demand from exporters has been a major factor, and conditions remain very favorable.
The number of members increased steadily to 16,173, supported by the proxy bidding service provided by our subsidiary i-Auc Inc.
Vehicles inspected exceeded 800,000 in the first half. Demand continues to rise for the certified inspections we conduct in partnership with a used vehicle listing platform, and the number of vehicles inspected continues to grow strongly.
FY2026 Second Quarter Cumulative Results
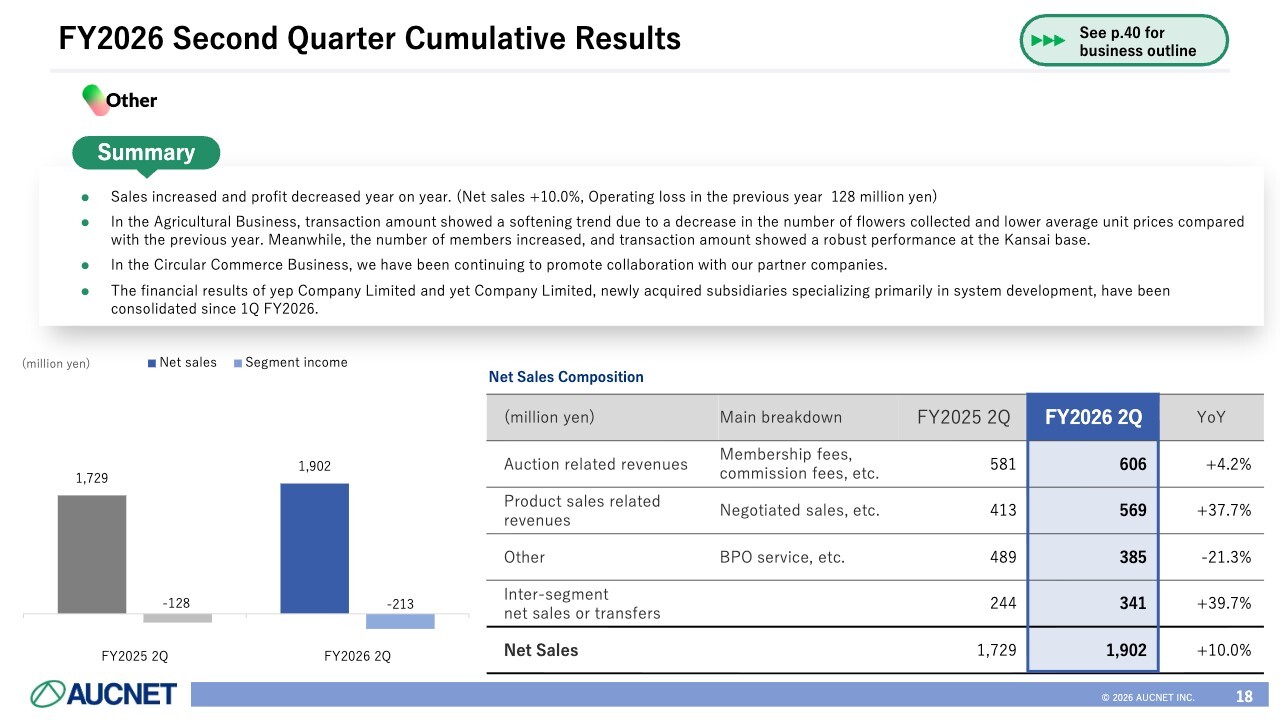
Turning to Other businesses, net sales increased while profit decreased year on year. Net sales rose 10.0%, but the operating loss widened from ¥128 million in the previous year to ¥213 million in the current period.
In the Agricultural Business, which handles flower distribution, both the number of flowers collected and the average unit price were below the previous year, and transaction amount remained soft. Meanwhile, after expanding from a primarily Kanto-based operation into Kansai several years ago, both the number of members and transaction amount at the Kansai base increased year on year.
In the Circular Commerce Business, we continue to promote collaboration with partner companies. We have also consolidated the results of yep Company Limited and yet Company Limited, which handle mainly system development and were acquired through M&A, since the first quarter.
Revisions of Consolidated Result and Dividend Forecasts for FY2026
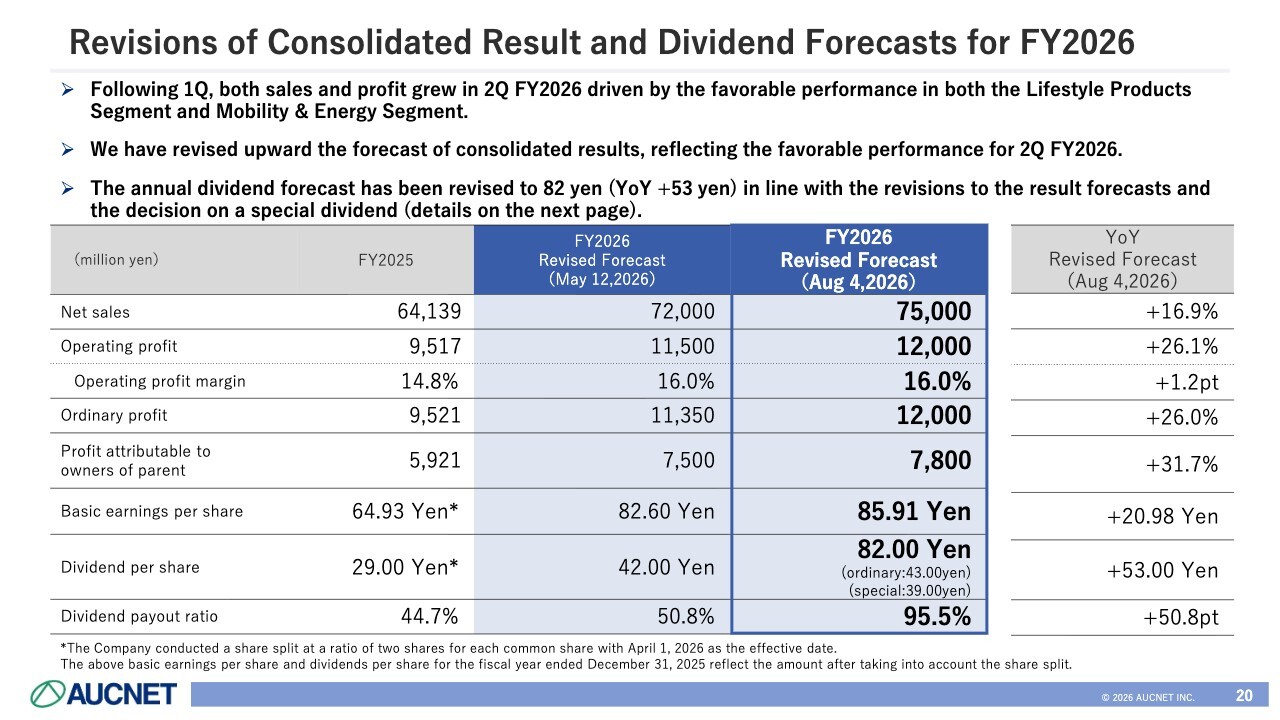
I will now discuss first-half topics. As I mentioned at the beginning, in light of the strong performance across the business, we are revising our consolidated financial results forecast and dividend forecast.
Following the first quarter, both the Lifestyle Products Segment and Mobility & Energy Segment again performed better than expected in the second quarter, resulting in year-on-year increases in both net sales and profit.
We are incorporating the strong first-half performance into an upward revision of the full-year consolidated financial results forecast. The intention is to reflect the first-half outperformance in full.
I will explain the revised forecast and the decision to pay a special dividend in more detail shortly, but we have substantially revised our annual dividend forecast to ¥82 per share, an increase of ¥53 year on year.
We revised our net sales forecast from ¥72,000 million to ¥75,000 million. We also raised the operating profit forecast from ¥11,500 million to ¥12,000 million. This is ¥1,000 million above the initial forecast of ¥11,000 million and 26.1% higher than the prior-year operating profit of ¥9,517 million.
We forecast ordinary profit of ¥12,000 million and profit attributable to owners of parent of ¥7,800 million, with the latter representing a 31.7% increase year on year.
We forecast basic earnings per share of 85.91 yen, up 20.98 yen year on year. We also forecast a dividend per share of 82 yen. Last year’s dividend was 29 yen on a post-split basis. We had originally forecast 42 yen for this fiscal year, and by adding the special dividend, the annual dividend is now planned at 82 yen, an increase of 53 yen year on year.
As for the dividend payout ratio, it was approximately 45% last year, while we had originally planned 50.8% for this fiscal year. In light of the current situation, we have revised it to 95.5%, nearly 100%, an increase of approximately 50.8 percentage points.
Decision to Pay a Special Dividend
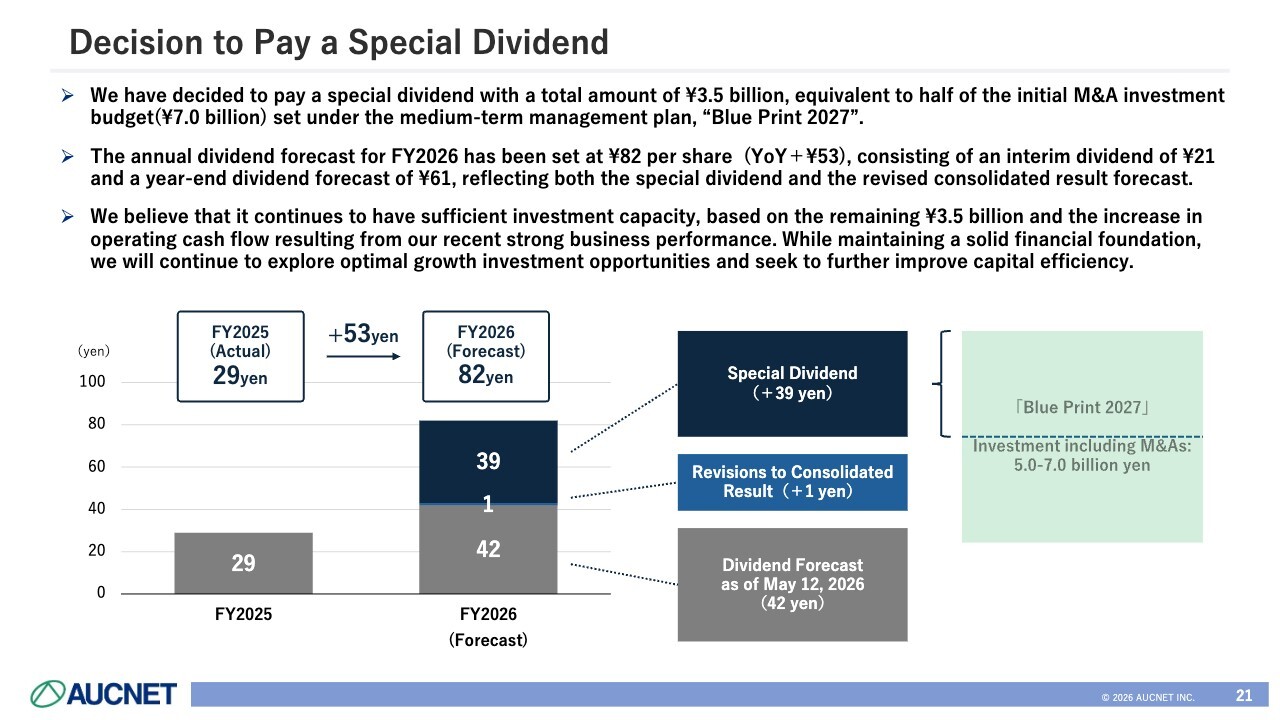
Let me explain the background to the special dividend. We have a three-year medium-term management plan, Blue Print 2027. We are now at the halfway point of that three-year plan, with one and a half years elapsed.
Under the medium-term management plan, we had set aside an M&A investment budget of ¥7.0 billion and said we would deploy that capital. However, considering the M&A opportunities and pipeline currently available and the fact that the only M&A completed to date has been the acquisition of yep Company Limited, we decided to use ¥3.5 billion, half of the ¥7.0 billion budget, to fund the special dividend.
Including the increase in the dividend associated with the revised earnings forecast, the year-end dividend forecast is ¥61. Together with the interim dividend of ¥21, the annual total is expected to be ¥82, up ¥53 year on year.
Because we are using half of the M&A funds for the dividend, the remaining investment allocation is approximately ¥3.5 billion. This is not the end of our M&A activity; we continue to consider the possibility of pursuing larger M&A transactions.
Our operating cash flow has increased steadily with the strong performance of the past few years, so even if a large M&A opportunity arises, we believe we retain sufficient investment capacity to respond. We therefore intend to continue actively considering growth investment opportunities. We also aim to further improve capital efficiency.
Implementation of a Special Shareholder Benefit Program
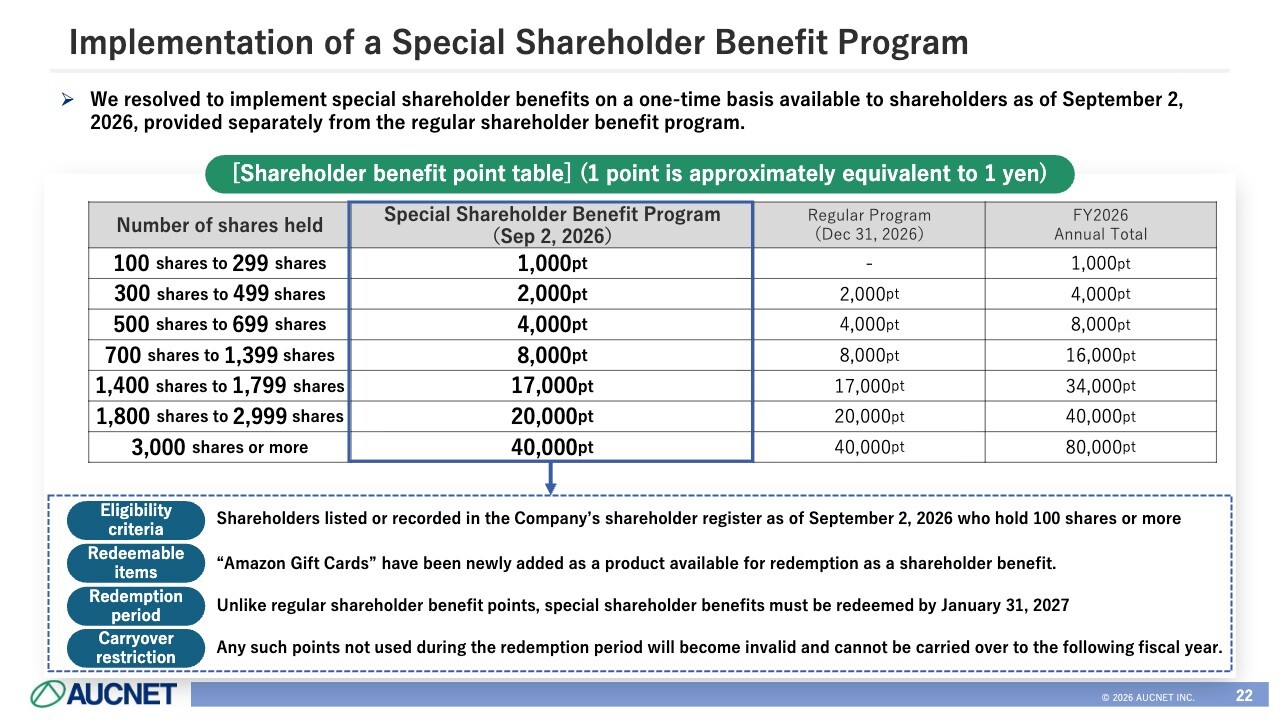
We will also implement a special shareholder benefit program. In addition to our regular shareholder benefit program, we will offer a special benefit to shareholders as of September 2, 2026, to strengthen returns to shareholders over the medium to long term. This is a one-time additional benefit on top of the regular program.
Please look at the table on the slide. The right side shows the regular shareholder benefit program, under which shareholders holding 300 shares or more receive benefit points. We are adding the benefits shown in the box on the left.
Specifically, shareholders holding 300 to 499 shares will receive an additional 2,000 points on top of the regular 2,000 points, for a total of 4,000 points.
We also want shareholders with smaller holdings to receive benefits, so shareholders holding 100 to 299 shares will receive 1,000 points.
In addition, to make it easier to redeem points for benefit items, we have added “Amazon Gift Cards” to the available items starting with this program.
We believe we have been able to announce very strong results this time. This reflects both the continued tailwinds in the reuse market in which we operate and the steady acceptance in the market of the new services and initiatives we have been pursuing.
We will continue to invest and take on new challenges for further growth, and we hope you will continue to look forward to AUCNET’s growth.
Q&A: Sustainability of Growth in the Used Car Business
Moderator: We have a question: “Could you explain in more detail why the Automobile Business is performing so well? Is this growth sustainable?”
Fujisaki: I am very pleased that our used car business, where AUCNET has its roots, has shown particularly strong growth this fiscal year.
As I mentioned earlier, market-wide auction listings are up a little over 1%, and the number of vehicles sold is up 3.6%. So the overall market continues to grow, albeit modestly. Within that market, the number of vehicles sold through our platform has grown by more than 13%.
Looking more closely at the used car market, roughly half of used cars are currently purchased by exporters for overseas markets. Our platform allows exporters to efficiently buy and sell large volumes of vehicles, including through successful auction bids, and is highly valued by them.
Last year, we carried out a major system update. On the UI/UX side, we made changes based on customer feedback to make the system easier for exporters to use. I think the substantial growth in this area is one important outcome of that work.
We have also recently received many questions about conditions in the Middle East. Certainly, when the situation deteriorated, there was a period of temporary turmoil across the market, but conditions are now very calm.
There is a substantial flow of vehicles through the Middle East, particularly the UAE, for onward shipment to Africa and elsewhere. For a time, vehicles could not be transported to the port in question. However, exporters have now found and are using alternative ports, so we believe the impact on the overall market is limited.
As for whether the growth is sustainable, the used car market itself remains very active. In addition, our major system update did not substantially change the site’s specifications; rather, we renewed the back-end system. We believe this has made the site flexible enough to add a wide range of services.
By making further UI/UX improvements and updates and enhancing functionality, we expect that we can further expand our market share.
Q&A: Impact of iPhone Price Increases on the Reuse Market
Moderator: We have a question: “How would increases in iPhone prices, or a change in the timing of new product launches, affect the Digital Product Business?”
Fujisaki: In smartphone distribution, a core service within Lifestyle Products, iPhones have higher unit prices than Android devices, depreciate much less when they enter the used market, and tend to trade at high prices. iPhone trends are therefore very important to our business. The current situation is probably much as you are all seeing it.
Of course, foreign exchange also has an impact, but I understand the question here is about the increase in the price of the iPhone itself.
This is a general trend across the reuse industry, not just smartphones: when new product prices rise, used product prices tend to rise with them. In the reuse market we serve, higher new-product prices therefore lead to higher used-product prices and a higher average unit price per device. The same pattern applies to products that are two or three years old, so we expect average unit prices to rise.
On the other hand, higher prices could reduce the number of people buying new devices. In that case, unit prices would rise but sales units could decline, and replacement demand could slow. We therefore see both positive and negative effects.
Next, I will discuss replacement timing. As many of you know, new iPhone models are released each year in early autumn. When we first entered this distribution business, sales units would surge around the launch period, while the rest of the year could be relatively quiet.
In recent years, however, those fluctuations have become much more even. Purchase timing has become more dispersed, particularly around April, when carriers step up activity for the start of the new fiscal year, and because of two-year device replacement programs. As a result, volumes are becoming more even throughout the year. Therefore, even if replacement timing shifts, the impact on our full-year business is not particularly large.
Q&A: Rationale for the Upward Revision and the Second-Half Forecast
Moderator: We have a question: “Regarding the upward revision, you said it reflects the first-half outperformance. Does that mean the second-half plan is unchanged?”
Fujisaki: As I mentioned briefly earlier, the amount of this upward revision essentially reflects the portion by which first-half results exceeded our initial assumptions.
Current performance is certainly very strong, but we have not simply carried that strength into the second-half forecast and raised it accordingly.
In addition to developments in the Middle East and U.S. tariff policy, foreign exchange rates in particular can have a certain impact on our business. We arrived at this forecast revision after properly factoring in these risks.
Q&A: Dividend Policy for FY2027
Moderator: We have a question: “Regarding dividends, you said that in FY2026 you are using part of the M&A investment budget to fund a special dividend. Could you explain how you are thinking about dividends for FY2027?”
Fujisaki: Let me address our dividend policy for the next fiscal year. At present, our basic policy is to target a dividend payout ratio of at least 50% and to continue paying dividends on an ongoing basis.
At the same time, we intend to maintain a solid financial foundation while investing proactively whenever growth opportunities arise, so that we can capture those opportunities.
Going forward, we will continue to emphasize both shareholder returns and growth, striking an appropriate balance in light of our circumstances and business trends, and pursue a dividend policy that meets shareholder expectations.
Q&A: Return of GIGA School Devices and Response Measures
Moderator: We have a question: “Could you update us on progress in handling returned GIGA School devices?”
Fujisaki: GIGA School was an initiative implemented by Ministry of Education, Culture, Sports, Science and Technology beginning in 2020, under which large numbers of devices used by students, including iPads, Windows devices, and tablets, were introduced. Enough time has now passed since their introduction that these devices are reaching the replacement stage. As a result, the second phase of GIGA School has been decided, and device replacement is now accelerating.
Returned devices cannot simply be placed in our auctions as-is; they require a product preparation process that includes grading and data erasure. Anticipating this, since last year we have been expanding our product preparation center and putting in place the necessary operating structure, including staffing.
As a result, the structure has come together smoothly, and we believe we reached an initial peak in the first half. These devices have also made a certain contribution to the roughly 20% increase in transaction amount in the Digital Product Business that I mentioned earlier.
Many companies handle returned GIGA School devices. Because volumes are large, there was concern from the outset that releasing them directly into the domestic market would disrupt supply and demand, leaving demand unable to absorb the supply and some devices without a destination.
AUCNET’s strength lies in its overseas buyer network and distribution capabilities, and this has been well received. We handle a large share and volume of these devices, and we believe we have been able to make a substantial contribution to the distribution of returned GIGA School devices.
We expect more GIGA School devices to return in the future, so we will continue to focus on ensuring their distribution, increasing volumes and improving earnings in our business.
Q&A: Funding Source for the Special Dividend and Financial Capacity for Growth Investment
Moderator: We have a question: “Cash and deposits were ¥28,903 million at the end of June, while total dividends for this fiscal year will be ¥7,400 million, which implies a substantial cash outflow. Will this create any constraints on future M&A or other investments?”
Fujisaki: I understand the concern is whether, given the large total dividend, we will have enough funds available for growth investments. Under our medium-term management plan, we originally set aside a ¥7.0 billion buffer for M&A.
We are now one and a half years into the plan, or halfway through the period, and we are using ¥3.5 billion of that allocation as the source for this special dividend. The remaining M&A allocation is ¥3.5 billion. In addition, our performance has been very strong in recent years—over roughly the past one to three years—and operating cash flow has also remained solid.
Accordingly, we maintain a financial structure that allows us to respond flexibly when attractive growth or investment opportunities arise. Even for an investment of ¥7.0 billion or ¥10.0 billion, we would have sufficient capacity to handle it.
Taking into account our equity ratio and level of borrowings as well, we retain adequate capacity to respond appropriately to growth opportunities. We do not expect this to create any impediment, so there is no cause for concern.