FY2026 Q2 Overview of Results
Shinsuke Tsuchiya (“Tsuchiya”): Hello, everyone. I am Shinsuke Tsuchiya, President, CEO & COO of Daitron Co., Ltd. Thank you for joining our financial results briefing today. I will now briefly walk you through the key points based on the financial results presentation materials.
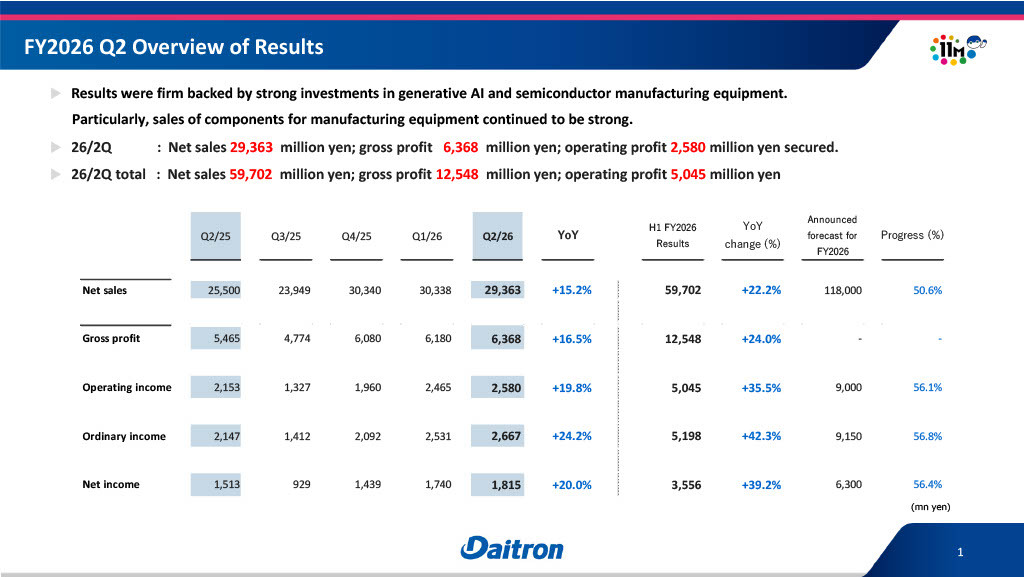
First, let me explain the overview of results for the second quarter of FY2026. Results remained firm, supported by strong investment in generative AI and semiconductor manufacturing equipment. Strong sales of components for manufacturing equipment were a major contributor.
In Q2, net sales were ¥29,363 million, gross profit was ¥6,368 million, and operating income was ¥2,580 million.
For H1, or the cumulative period through Q2, we recorded net sales of ¥59,702 million, gross profit of ¥12,548 million, and operating income of ¥5,045 million. The other figures, including ordinary income and net income, are shown in the table on the slide. All figures shown increased YoY, reflecting solid results.
FY2026 Q2 Product Portfolio and Financial Performance
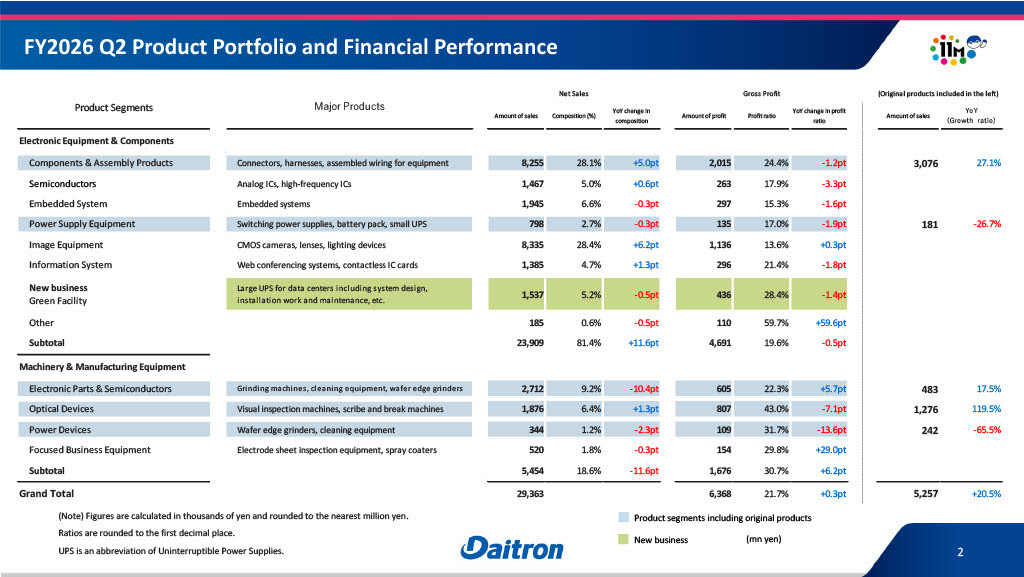
This slide summarizes our product portfolio. Please focus on the light-blue highlighted areas and the profit amounts and profit ratios.
The segments highlighted in light blue include our original products. In Electronic Equipment & Components, Components & Assembly Products and Power Supply Equipment are the segments that include our original products.
The profit ratios for the light-blue highlighted segments, which include our original products, are generally above 20%, indicating that we maintain high profitability. The profit ratio for Power Supply Equipment, however, is slightly below 20%.
We believe this reflects higher costs for materials and components, as well as somewhat lower volume. By contrast, the other areas are achieving very high profit ratios.
The area shown in green is Green Facility, a new business we are developing. This business provides large uninterruptible power supply (UPS) systems for data centers, together with technical services, and generated a very high level of profit in Q2.
FY2026 Q2 Net Sales and Gross Profit
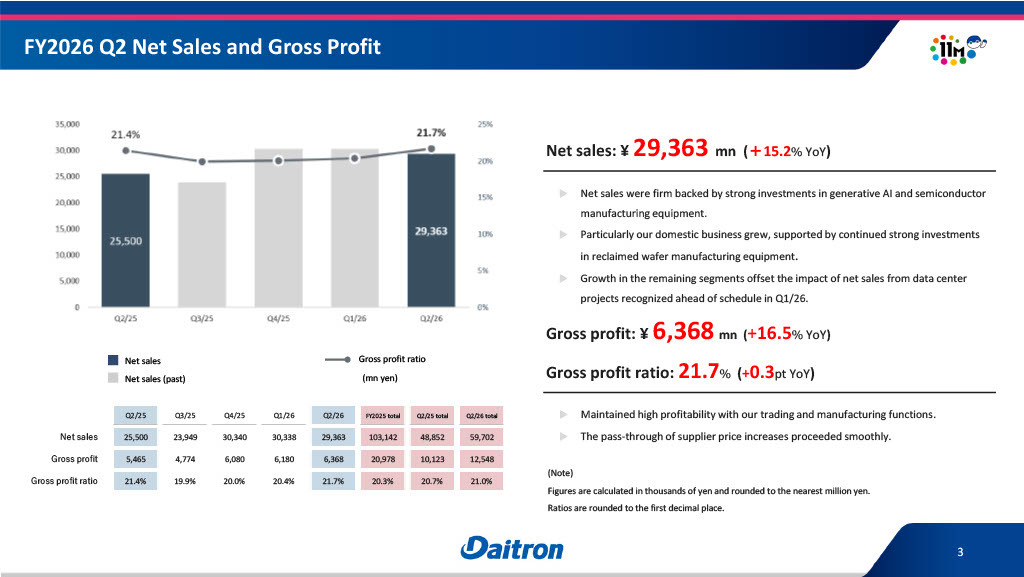
The bar chart on the slide shows quarterly net sales and gross profit.
Net sales remain firm, supported by strong investment in generative AI and semiconductor manufacturing equipment. In addition, continued strong investment in reclaimed wafer manufacturing equipment has driven growth mainly in our domestic business.
On the other hand, some net sales from data center projects were recognized ahead of schedule in Q1 FY2026. This makes some of the quarterly figures appear lower, but the other segments are performing very well, and we believe overall net sales are being maintained at a solid level.
Gross profit followed a similar trend, with the gross profit ratio reaching 21.7%, enabling us to maintain a very high level of profitability.
FY2026 Q2 Operating Income
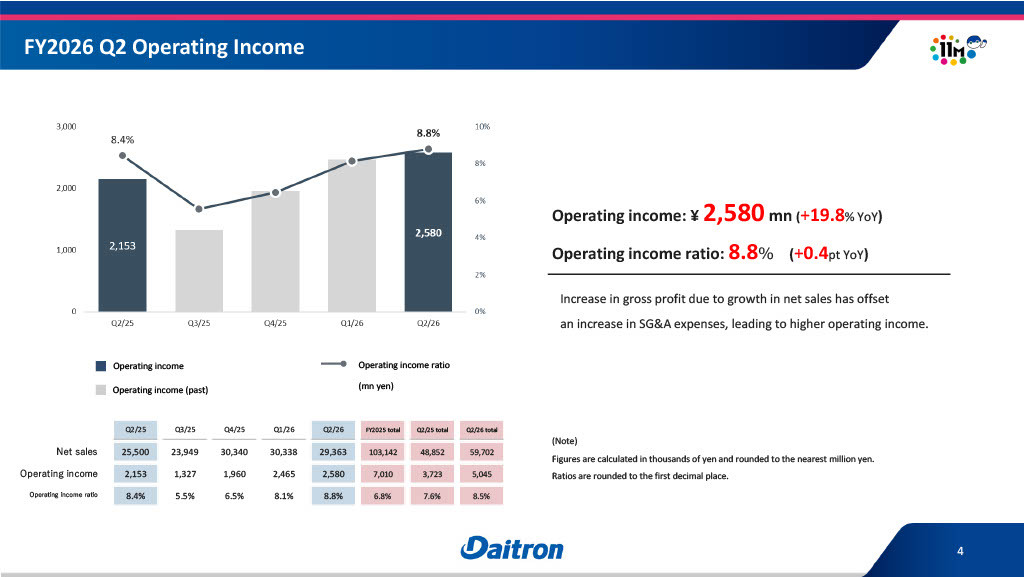
Q2 operating income is shown on the slide. The increase in gross profit from higher net sales absorbed the increase in SG&A expenses, resulting in higher operating income.
FY2026 Q2 (total) Factors for Changes in Operating Income
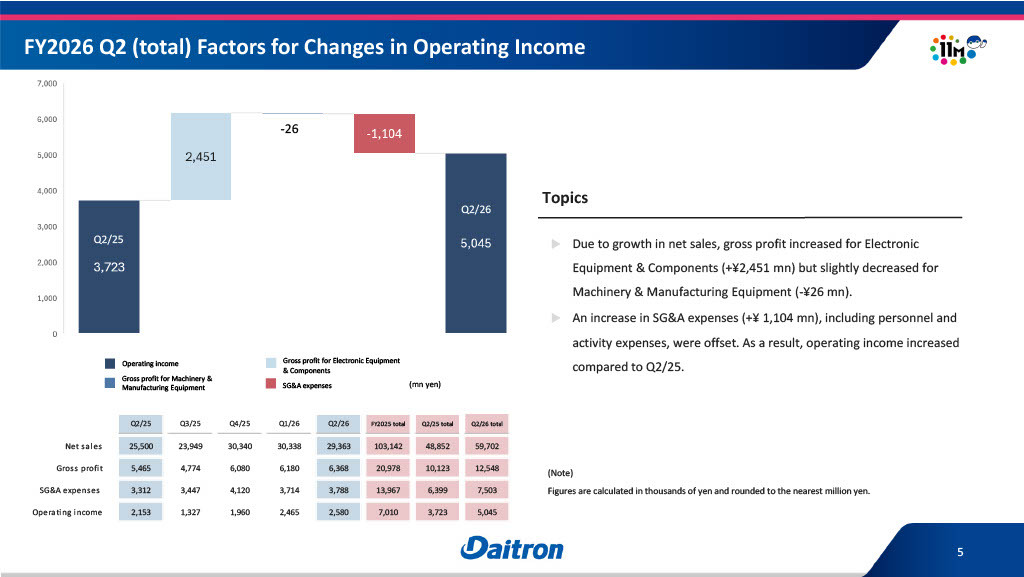
Let me explain the factors behind the change in operating income. The increase in gross profit absorbed the increase in SG&A expenses, which was driven mainly by higher personnel and activity expenses. As a result, operating income increased overall.
FY2026 Q2 Changes in Net Sales of Original Products
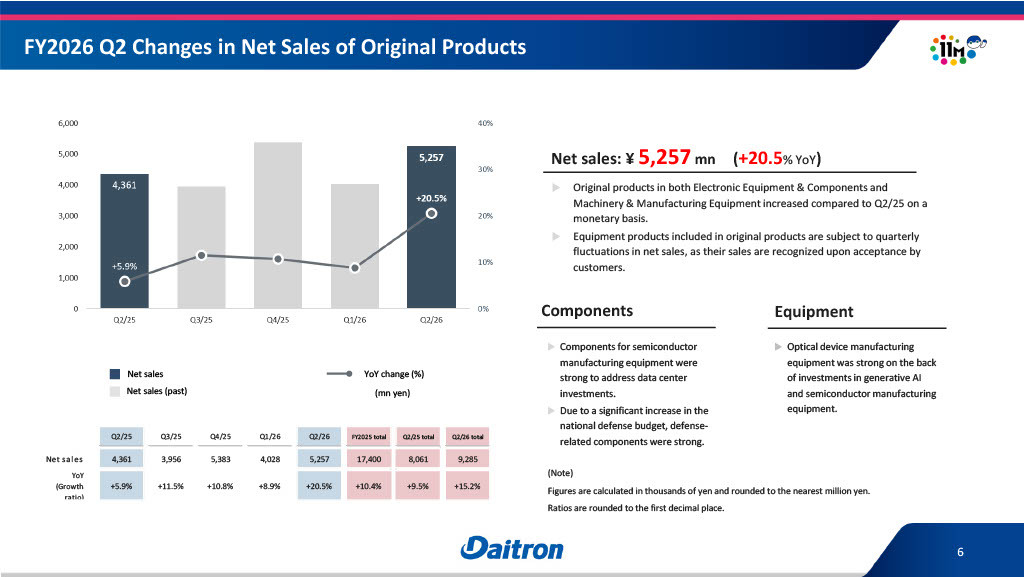
This slide shows changes in net sales of original products. The graph shows quarterly net sales. Net sales were ¥5,257 million, up 20.5% YoY.
Among our original products, net sales of equipment products are recognized upon customer acceptance, so quarterly net sales fluctuate. Overall, however, performance remains strong.
FY2026 Q2 Sales Change by Region
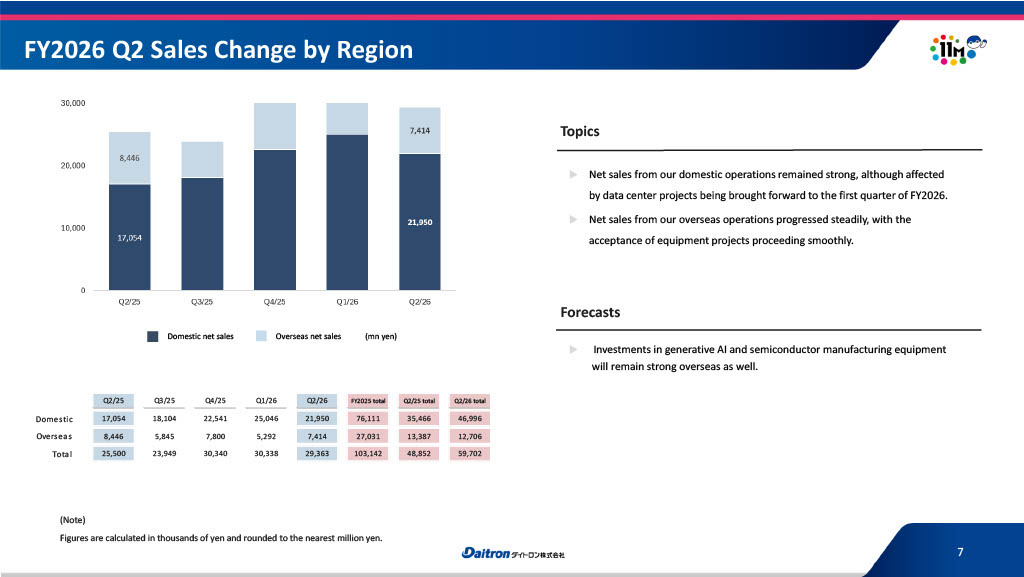
This slide shows changes in net sales by region. The bar chart shows the mix of domestic and overseas net sales. Overseas net sales increased from the previous quarter as equipment projects moved smoothly through customer acceptance.
Domestic net sales, meanwhile, were somewhat affected by the early recognition of data center project sales in Q1, but we believe domestic sales are performing well overall.
FY2026 Q2 Sales Change by Overseas Region
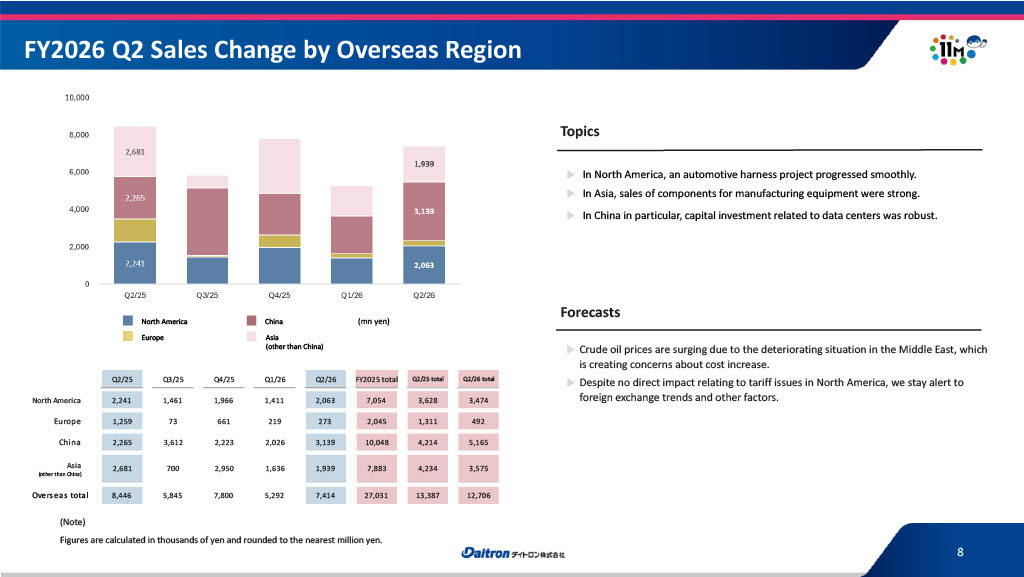
This slide shows changes in net sales by overseas region. North America remained firm, supported by an automotive harness project. In Asia, sales of components for manufacturing equipment also remained strong. In China in particular, capital investment related to data centers has been very active, contributing to net sales.
FY2026 Q2 Sales Change by Product Segment (Electronic Equipment & Components)
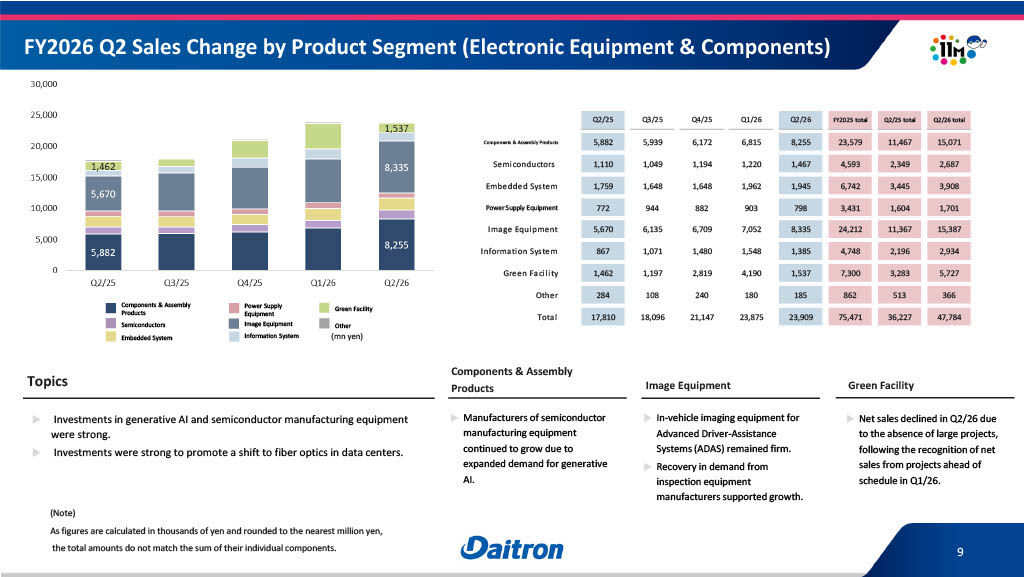
This slide shows net sales by product segment for Electronic Equipment & Components. In the bar chart on the left, all portions except the green section at the top correspond to the individual segments of Electronic Equipment & Components, and net sales have grown steadily quarter by quarter.
The green section at the top represents Green Facility, our new business. As some sales were recognized ahead of schedule in Q1, the trend is as shown on the slide.
FY2026 Q2 Order Change by Product Segment (Electronic Equipment & Components)
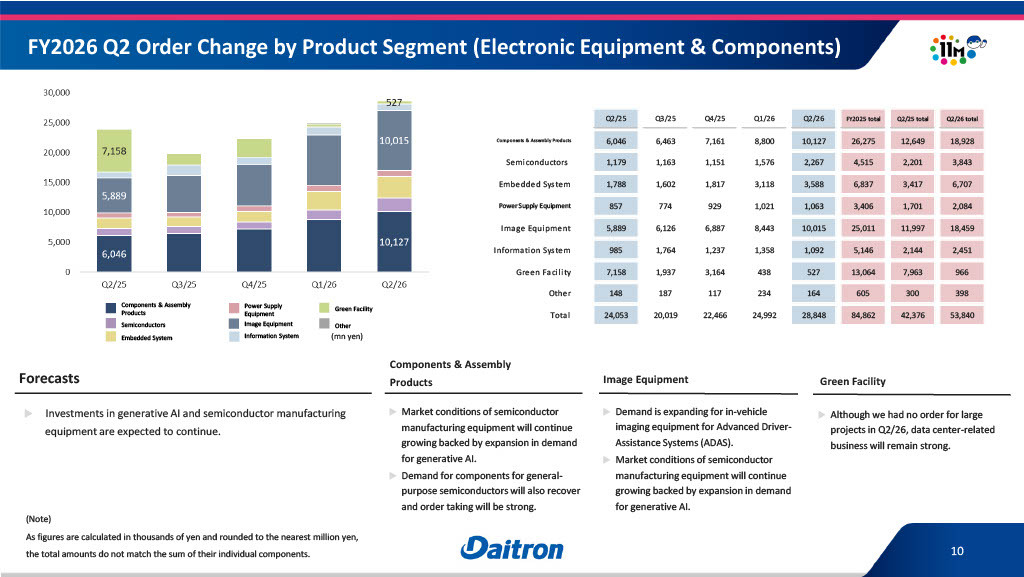
This slide shows order trends by product segment for Electronic Equipment & Components. Orders have been progressing very well across the segments of Electronic Equipment & Components other than Green Facility.
We believe a major factor is the continued investment in generative AI and semiconductor manufacturing equipment.
For Green Facility, orders did not make a significant contribution to the Q1 or Q2 figures. However, we have large projects in the pipeline for H2 and have received numerous inquiries. We therefore expect orders from these projects to begin contributing to the figures in Q3 and Q4.
FY2026 Q2 Order Backlog Change by Product Segment (Electronic Equipment & Components)
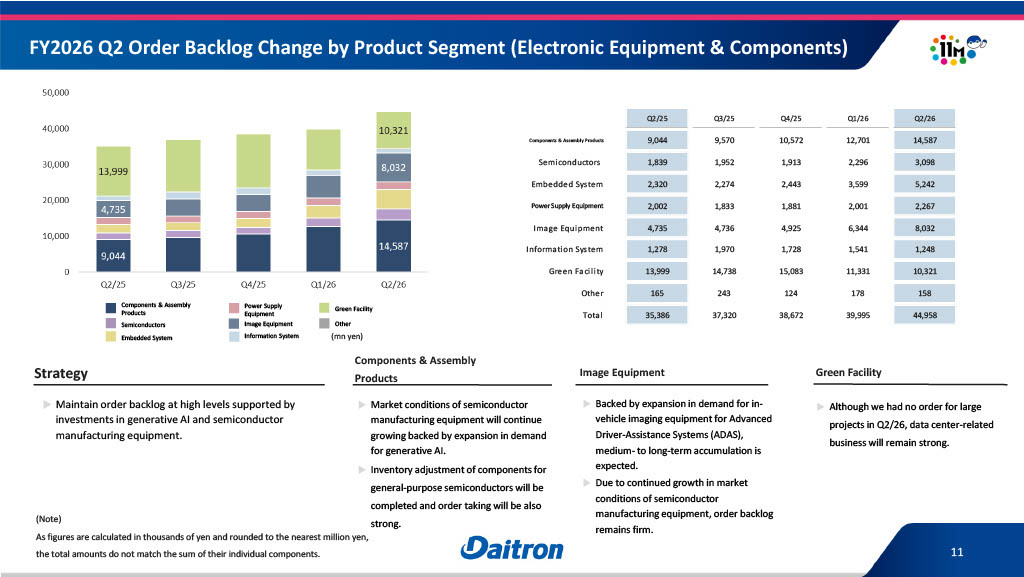
Reflecting current order trends, order backlog continues to grow significantly. We therefore expect it to make a substantial contribution to future net sales.
FY2026 Q2 Sales Change by Product Segment (Machinery & Manufacturing Equipment)
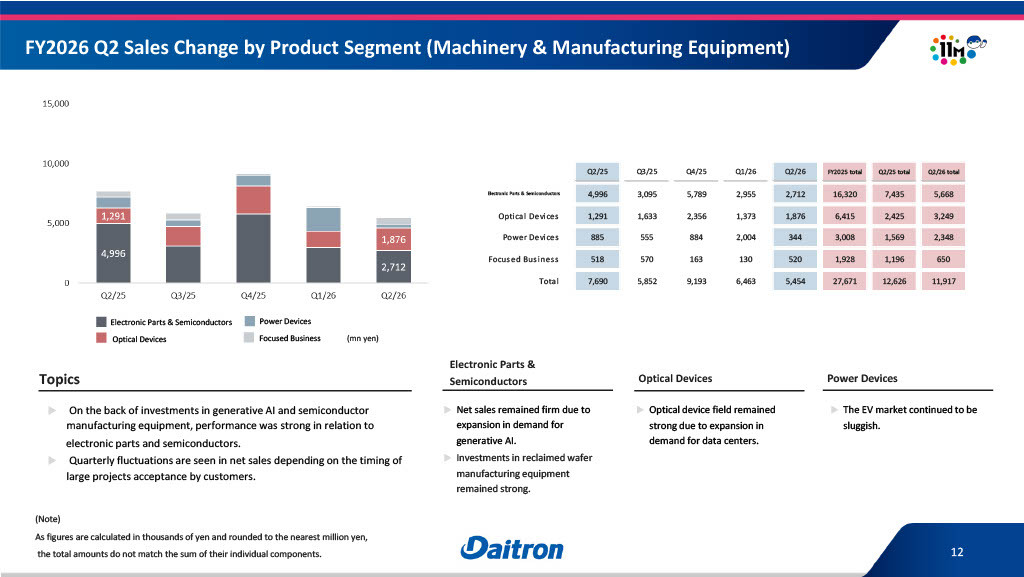
This slide shows net sales by product segment for Machinery & Manufacturing Equipment. Although quarterly net sales fluctuate depending on the timing of customer acceptance of large projects, overall we believe the business is growing strongly, supported by investments related to generative AI and semiconductor manufacturing equipment.
FY2026 Q2 Order Change by Product Segment (Machinery & Manufacturing Equipment)
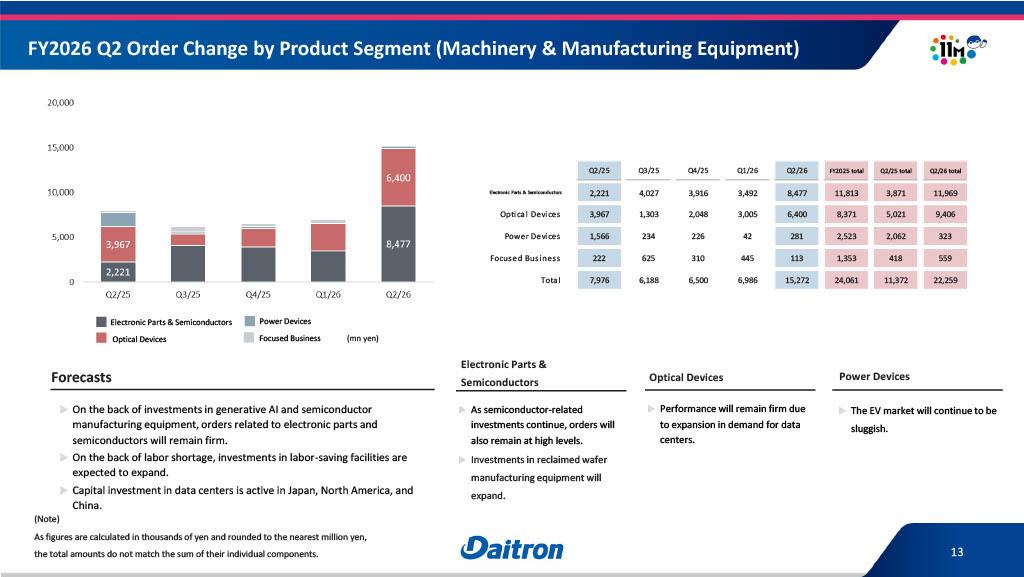
Orders showed a distinctive trend in Q2. Specifically, capital investment related to semiconductors, particularly in reclaimed wafer equipment, expanded, and we were able to capture that demand.
In addition, growing demand from data centers led to a significant increase in orders for equipment related to optical semiconductors known as optical devices, contributing to the results shown on the slide.
FY2026 Q2 Order Backlog Change by Product Segment (Machinery & Manufacturing Equipment)
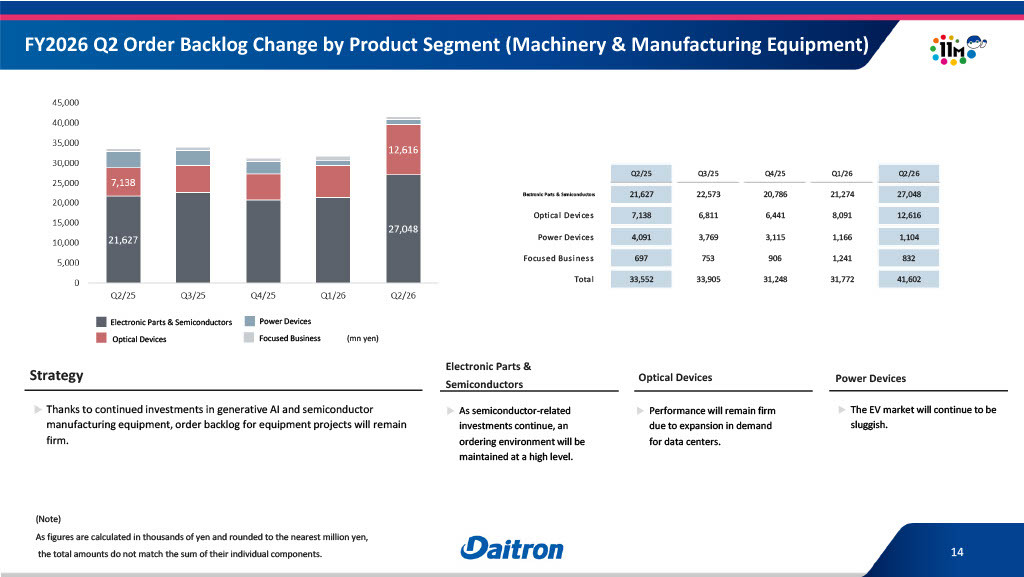
Against this backdrop, order backlog in Machinery & Manufacturing Equipment has also built up significantly. We expect investment related to semiconductors and Optical Devices to continue going forward.
Shareholder Returns (Dividends and Dividend Payout Ratio)
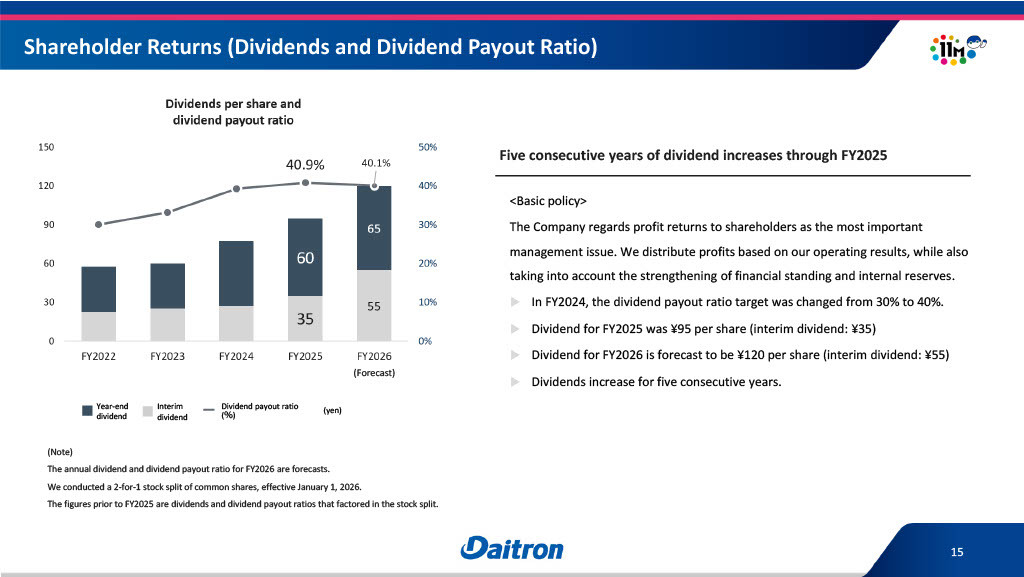
Turning to shareholder returns, we forecast an annual dividend of ¥120 per share for FY2026. We have set the interim dividend at ¥55. This will mark five consecutive years of dividend increases.
Cash Allocation Policies (FY2025-FY2026)
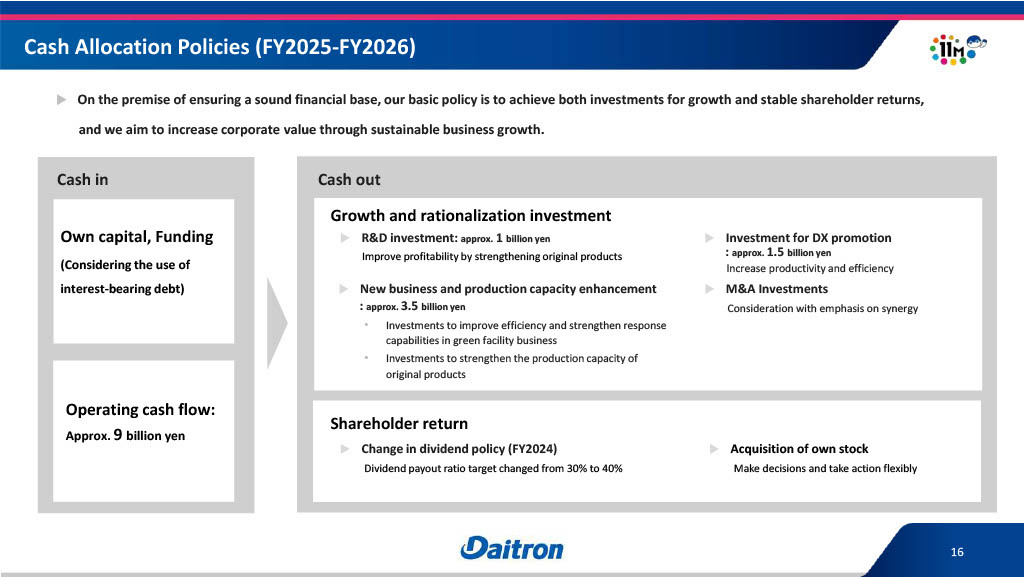
Under our cash allocation policies, we are particularly focused on investing in new businesses and expanding production capacity. We have designed our cash allocation to ensure sufficient investment in these areas.
Approach to Achieving Cost of Capital- and Share Price-Conscious Management
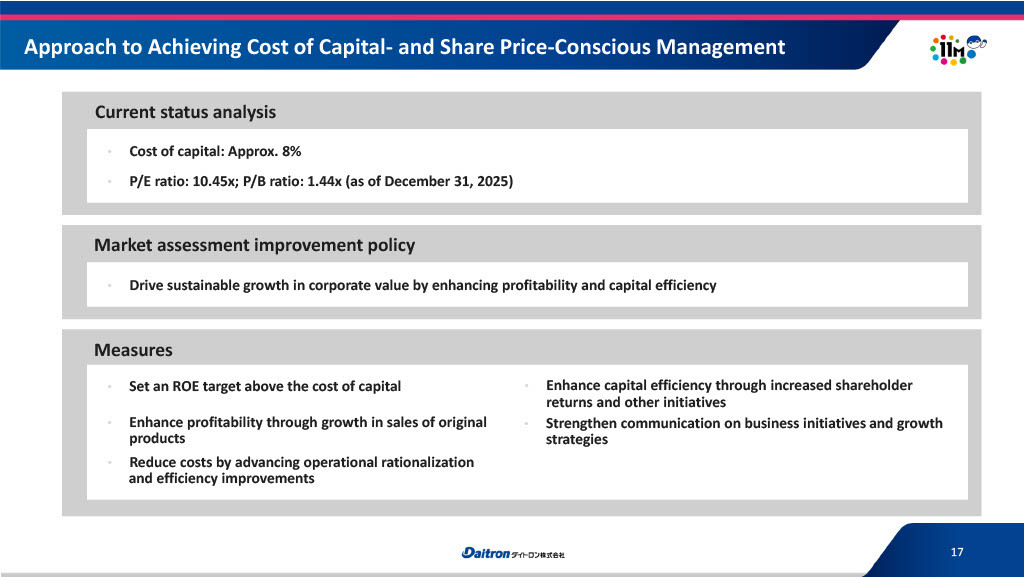
This slide covers our approach to achieving cost of capital- and share price-conscious management. The current status analysis and policy for improving market assessment are shown on the slide. The slide also sets out the specific measures we are currently considering, so please refer to them.
We plan to steadily implement these measures going forward.
Progress of KPIs in 11th Medium-Term Business Plan (11M)
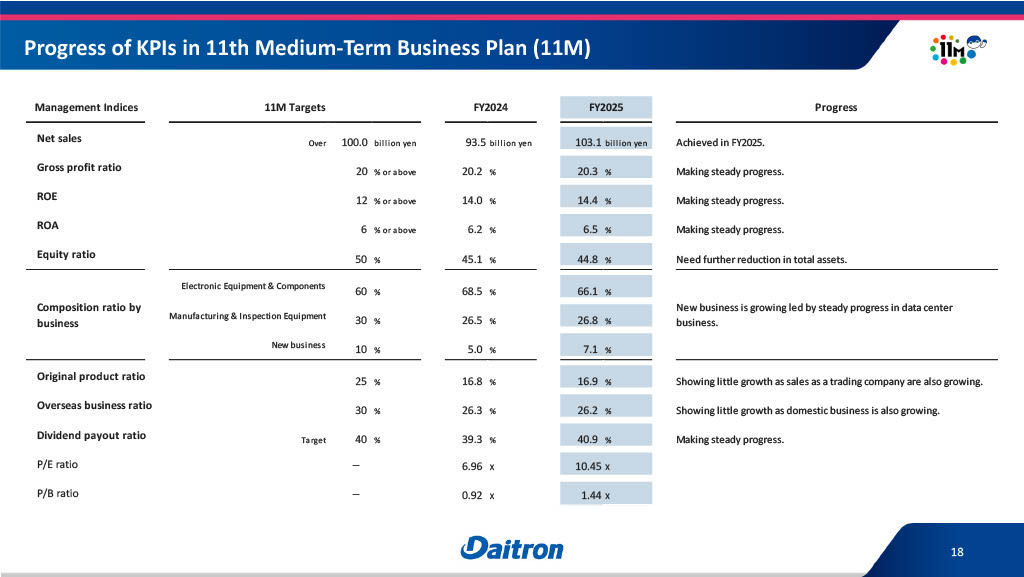
Next, I will discuss the 11th Medium-Term Business Plan (11M), which is currently underway. The plan began in 2024, and 2026 is its final year. The slide lists the management indicators, including the equity ratio, original product ratio, and overseas business ratio. Excluding those items, progress is generally on track.
The original product ratio and overseas business ratio may appear to be well below their respective targets. For original products, however, sales of products handled through our trading function are also growing very strongly, so the original product ratio has not yet increased significantly.
Similarly, the overseas business ratio does not appear to be rising significantly because domestic sales are currently growing solidly.
(Reference) Progress of KPIs in 11M
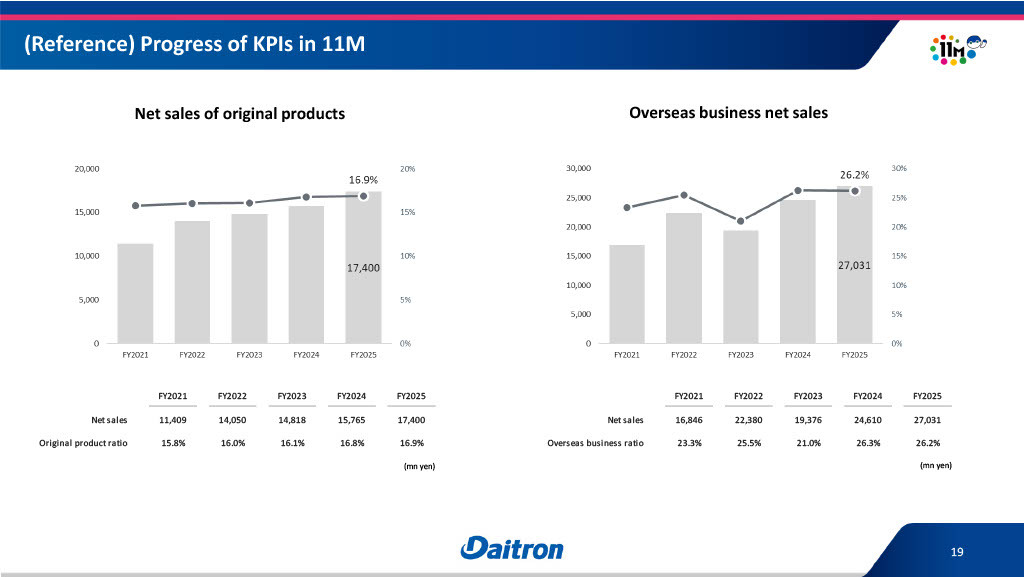
However, as this slide shows, net sales of original products have grown steadily year by year, and we expect them to grow again this year.
The same is true of overseas business net sales. Although there was a slight decline in 2023, we believe the overall trend has been one of steady growth. We therefore expect solid growth again this year.
Consolidated Performance Forecast (full-year)
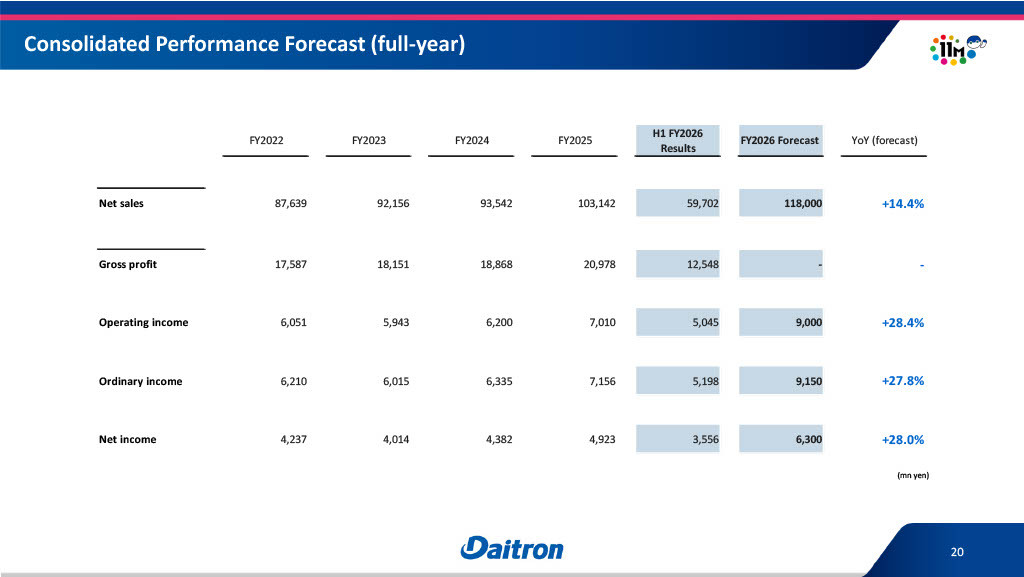
This slide shows our consolidated full-year performance forecast. We forecast full-year net sales of ¥118,000 million, operating income of ¥9,000 million, ordinary income of ¥9,150 million, and net income of ¥6,300 million. We expect all of these items to increase significantly YoY.
Last year, net sales and operating income reached record highs, and our plan calls for both to exceed those levels. If we achieve our full-year forecast, both will reach new record highs this fiscal year.
Net Sales Forecast by Business
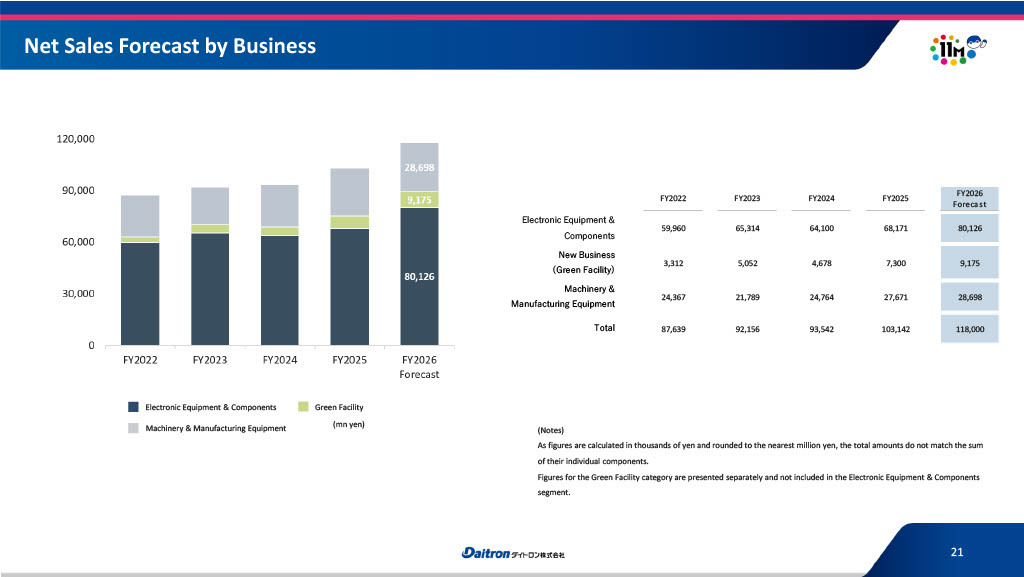
This slide shows our net sales forecast by business. The bar chart on the left shows net sales trends for our three main businesses: Electronic Equipment & Components, Machinery & Manufacturing Equipment, and Green Facility. Each business is positioned to maintain growth.
Net Sales Forecast by Product Segment (Electronic Equipment & Components)
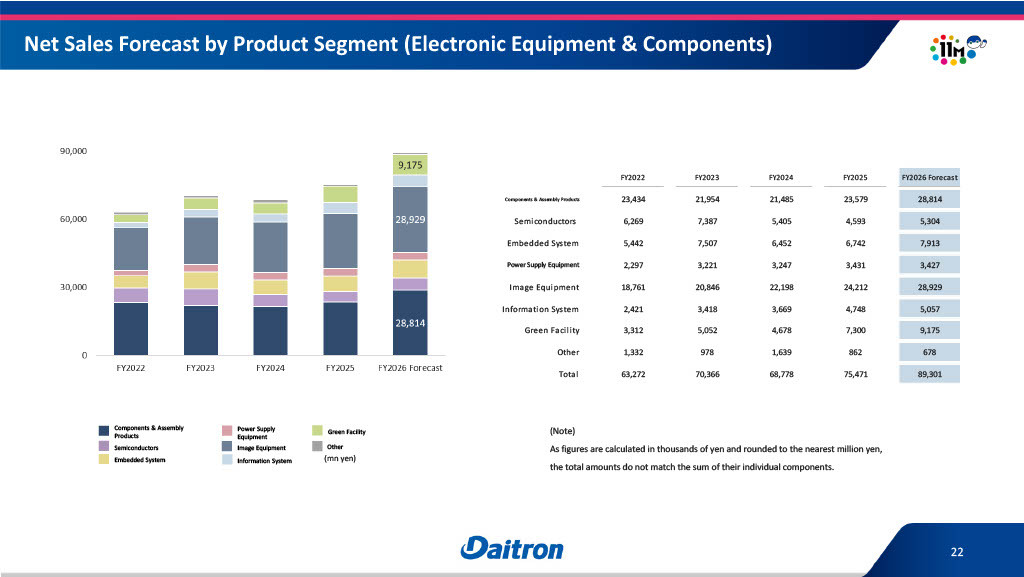
This slide shows the outlook by product segment. Within Electronic Equipment & Components, we expect overall growth across the product portfolio this fiscal year. Green Facility is also showing very strong momentum for the full year.
Net Sales Forecast by Product Segment (Machinery & Manufacturing Equipment)
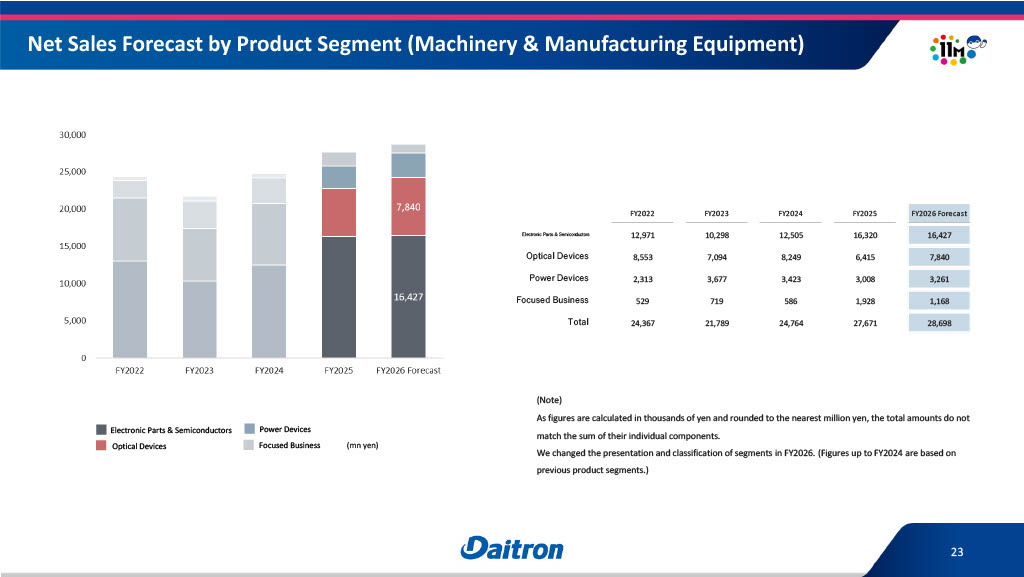
The same applies to Machinery & Manufacturing Equipment. Performance is progressing very well, and we believe net sales are likely to grow again this year.
At first glance, the bar chart on the left may look slightly different from the figures through 2024. This is because the segment presentation and classification were changed in 2026. Please therefore use 2025 as the reference point when looking at the growth in 2026. The chart shows that performance is progressing well.
That concludes my presentation. Thank you very much for your attention.
Q&A: Outlook Following Strong First-Half Results
Moderator: We have a question: “Following the upward revision in Q1, the forecast was revised upward again in Q2. Could you share your outlook from here?”
Tsuchiya: We believe the outlook remains very strong. For the full year as well, we believe we can deliver results that exceed last year’s level.
Business activity remains strong in the industries we serve, particularly in AI- and data center-related fields. We expect this momentum to continue for some time and therefore believe we can maintain very strong performance from H2 onward.
On the other hand, lead times for some products have been trending somewhat longer, and many equipment-related products already have long lead times.
Accordingly, while we expect to secure orders in H2, many of those orders may contribute to net sales next year or later rather than within this year. This timing has been factored into our H2 and full-year forecasts.
Even from a longer-term perspective, we believe strong conditions are likely to continue for some time.
Q&A: Initiatives to Maintain the Gross Profit Ratio
Moderator: We have a question: “The gross profit ratio is 21.7%. Can you maintain this high level even amid rising costs due to further yen depreciation and higher crude oil prices?”
Tsuchiya: Under our current Medium-Term Business Plan, one of our basic targets is to maintain a gross profit ratio of at least 20%. Against that backdrop, we have also been steadily growing net sales of original products.
We are also able to maintain relatively high margins on products sold through our trading business. At the same time, it is true that factors such as yen depreciation and higher crude oil prices are increasing costs.
These factors are affecting the costs of our original products in various ways and are also clearly affecting the cost of procuring products for our trading business.
However, in these circumstances, we explain the situation carefully to customers and negotiate with them, including on the possibility of long-term supply arrangements. By securing their understanding of the cost increases, we believe we have been able to avoid the resulting erosion of profit.
We are also taking a range of measures to address rising costs, including refining our procurement methods and changing the sourcing channels for materials used in our original products. Through initiatives such as bulk purchasing, we continue working to minimize cost increases for our original products.
We expect these cost pressures to persist for some time, but we will continue taking these measures to maintain a high gross profit ratio.
Q&A: Order Conditions in Overseas Business and Outlook from H2 Onward
Moderator: We have a question: “For your overseas business, could you discuss the current order situation in North America, Europe, and Asia, and the outlook from H2 onward?”
Tsuchiya: Starting with North America, we believe orders are likely to remain firm going forward.
We currently manufacture harnesses for railcars at our local plant in North America and supply them to customers. This business is project-based, but we expect to continue receiving orders.
In the United States in particular, major cities operate various types of rail services, including subways and commuter trains, and their rolling stock is replaced or renewed on different schedules. By winning these projects, we believe we can generate recurring orders.
These renewal cycles are expected to occur in different years and at different times, so we believe North America can remain firm, led by this business.
Regarding recent investment in the United States, we are seeing plant relocations by Japanese manufacturers as well as relocations from China. We understand that this trend is particularly pronounced in semiconductor-related businesses.
Against this backdrop, we have built a track record in the equipment business in Japan, and we are now seeing our experience leveraged in the U.S. market. We are also seeing cases where equipment we supplied to customers in China is being adopted for their expansion into the United States or for the construction of new plants there.
Building on this track record, we are currently receiving inquiries regarding equipment projects, some of which are already producing results. Accordingly, in North America, in addition to the railcar business, we expect further growth in equipment-related business driven by capital investment, including sales of our original products.
Turning to Europe, conditions are very challenging due to weakness in the automotive sector. Even so, we see some promising semiconductor-related investment activity and expect repeat orders for projects we have already won.
Market research is increasingly indicating potential demand for our switching power supplies, one of our original products, among European manufacturers of analytical instruments and medical equipment.
We are currently stepping up sales activities for switching power supplies in Europe. Although the impact may not materialize until next year or later, we believe these efforts can help raise order levels.
Finally, China is the main market in Asia. Investment related to optical devices and optical semiconductors for data centers is increasing in China, and the number of market participants is also growing. Orders for our optical semiconductor-related equipment have been increasing very strongly in these fields.
We believe this investment is tied to data center construction. It is therefore linked not only to demand within China but also to demand for optical devices for data centers in the United States, Japan, and other regions. Accordingly, we expect the capital investment currently underway in Asia to continue.
We therefore believe there is still room for further growth in this field.
As for the outlook from H2 onward, orders are growing very strongly. We have already secured projects in each region. By steadily converting these orders into net sales, we believe the business can continue along its current trajectory without major fluctuations.