
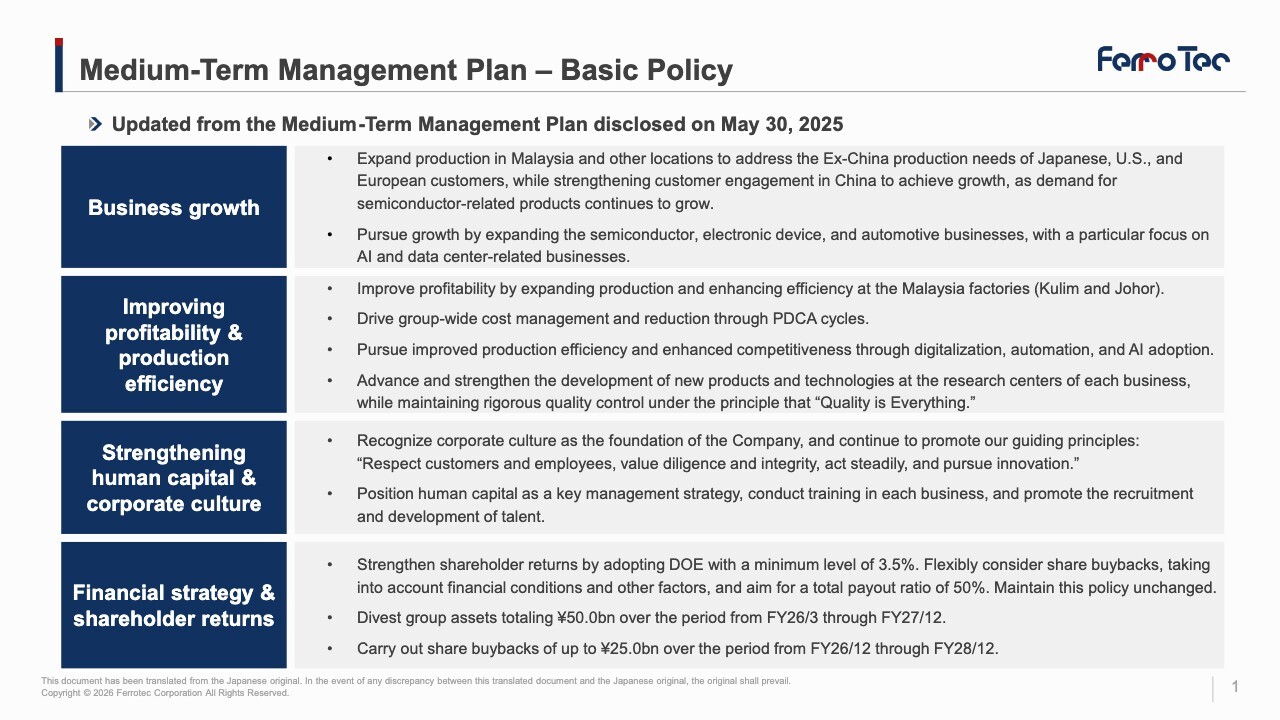
Medium-Term Management Plan – Basic Policy
Mr. He Xian Han: I am He, Representative Director of Ferrotec Corporation. Thank you for joining us today. In the blink of an eye, we’re already halfway through 2026. Today, I will share with you what our company is currently focusing on and how we plan to make steady but swift progress.
To date, we have achieved our sales results by exploring various avenues for business growth. As you all know, 2026 marks the dawn of the AI era. Additionally, it’s the first year of a five-year cycle for the semiconductor industry. Since the second half of last year, orders have been increasingly growing, and we’ve seen active market expansion.
As for the outlook for this year, I am confident that we can achieve growth of 25% to 30%. Our company has quite a strong affinity with AI and semiconductor sectors; our products, such as thermoelectric modules, are widely used in AI applications and data centers.
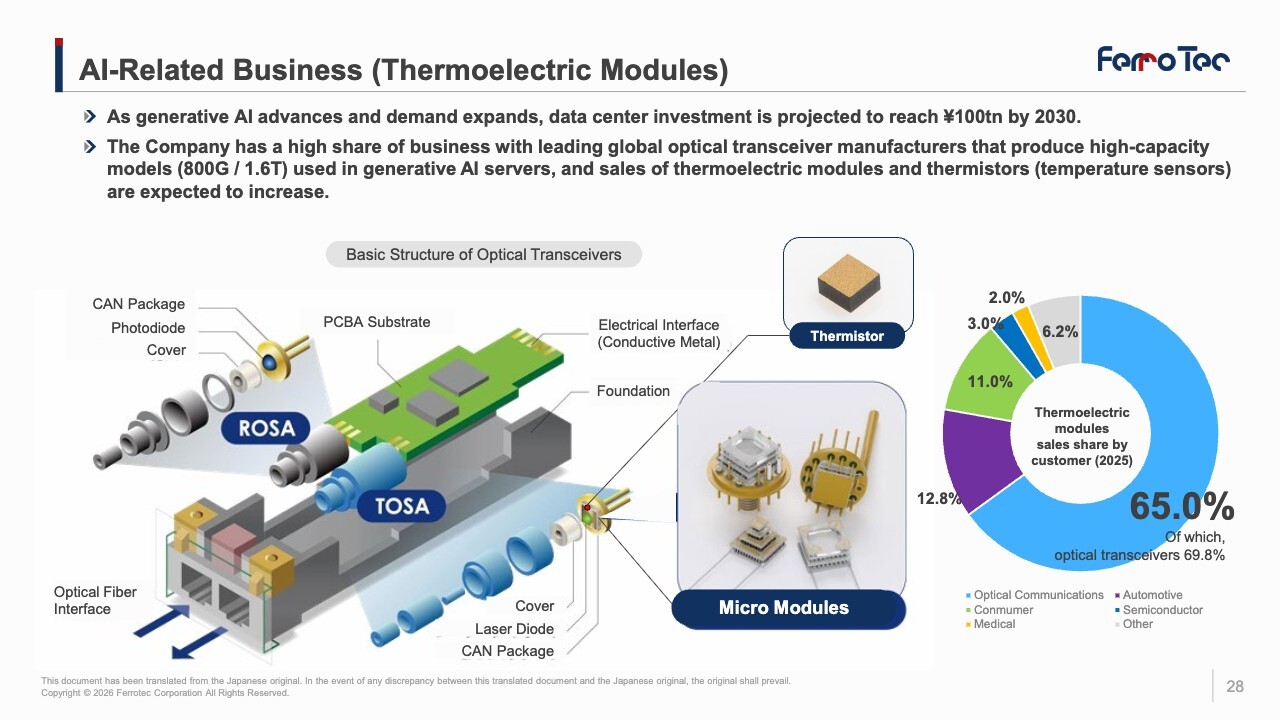
At present, Ferrotec holds 70% of the global market share for optical modules (*). The reason why we command such a large market share comes down to the full automation of our manufacturing process. We’ve minimized manual intervention on the production floor as much as possible. Additionally, we bundle temperature sensor elements with our products. As such, the strength of our products lies in the close integration of AI, data centers, and optical fibers.
*Approximately 70% market share among major global manufacturers (based on Ferrotec’s estimates)
Topics (2): Scaling up production capacity to capture semiconductor-related demand-China
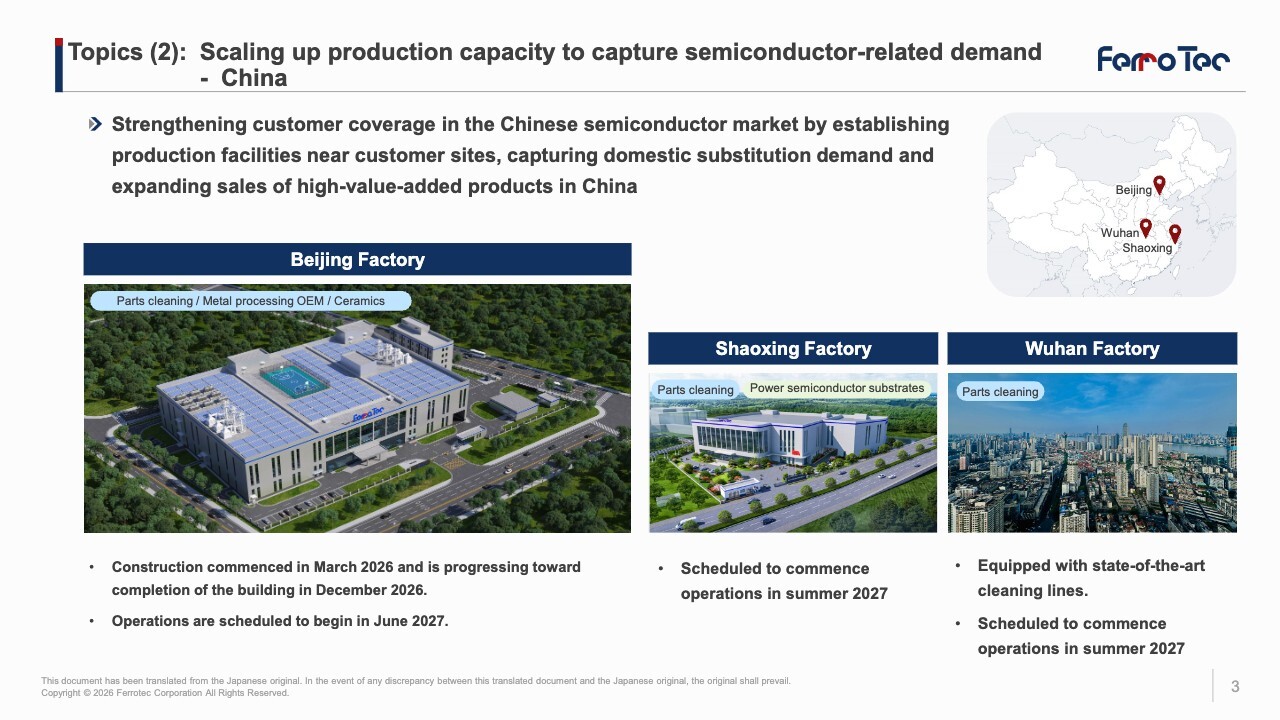
As part of our strategy from this year, the first thing we considered was Ex-China production. And we decided to use Ex-China production capacity as much as possible for Japan, Europe, and the U.S. markets. At the same time, China’s semiconductor industry is growing at a remarkable pace, with particular increase in production volume of general-purpose semiconductor devices. This year, China’s semiconductor exports exceeded CNY 1 trillion. Therefore, we intend to take orders from Japan, Europe, the U.S., as well as China, thereby moving toward further growth.
Medium-Term Management Plan KPIs
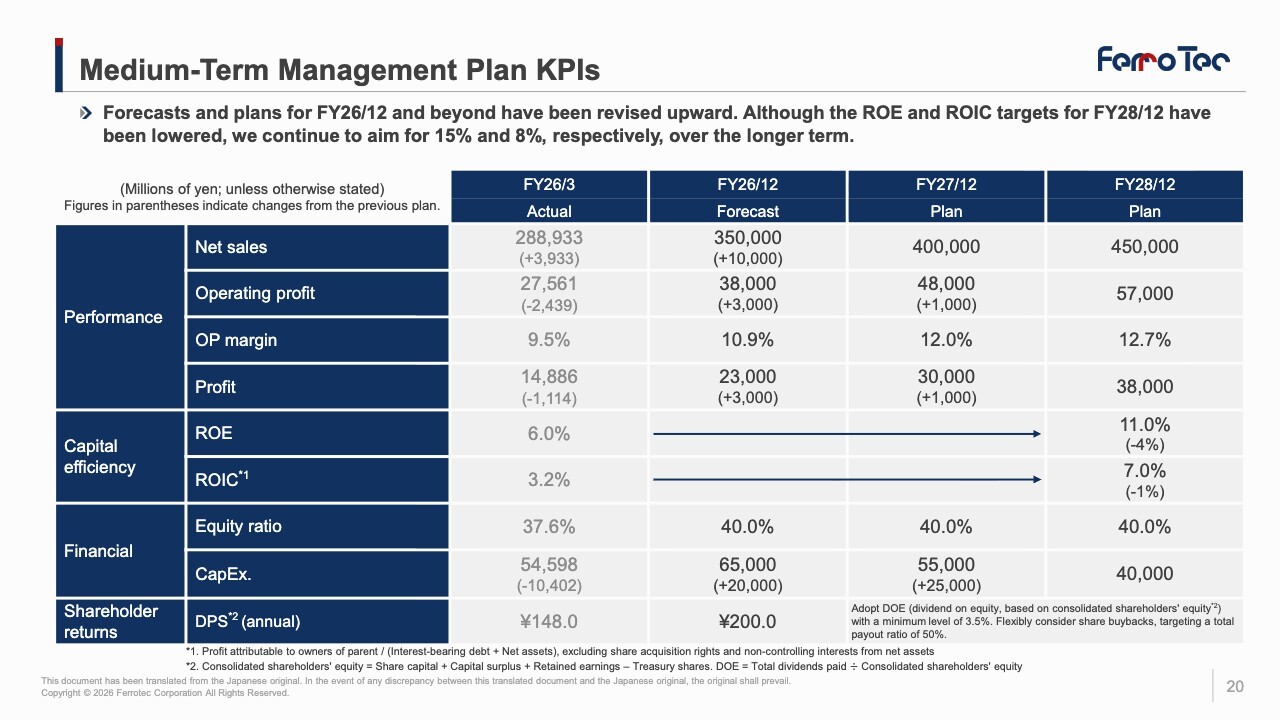
Let me discuss what we are planning for 2026 and what growth rates we are projecting. Basically, we are aiming for a growth rate of 20% with net sales of ¥350.0 billion for 2026. Operating profit is projected to be ¥38.0 billion, and profit attributable to owners of parent (hereinafter “profit”) is projected at ¥23.0 billion.
Now, how can we achieve stable growth over the next three years? We are targeting operating profit of ¥48.0 billion in 2027 and ¥57.0 billion in 2028. Of course, we believe profit will also grow steadily. However, while anyone can achieve short-term growth, sustaining growth over the long term is quite challenging.
Topics (1): Scaling up production capacity to capture semiconductor-related demand - Malaysia
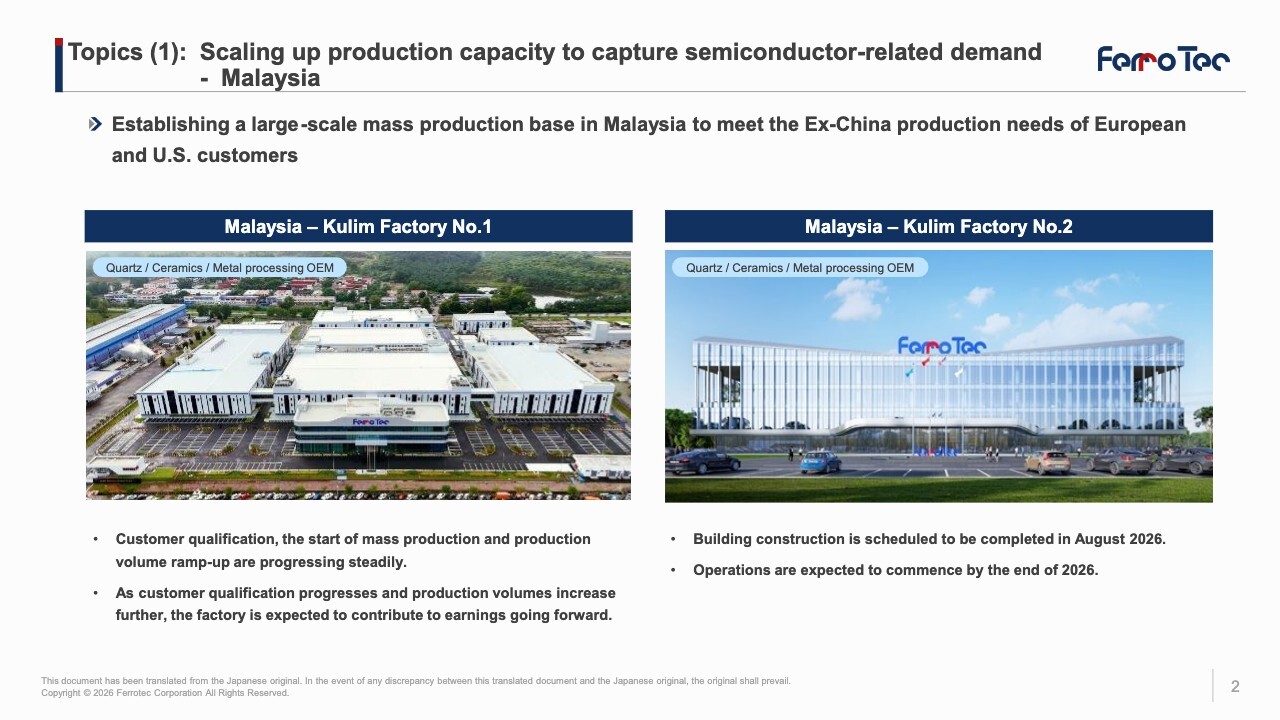
As we aim for continued growth, we face the challenge of how to pursue profitability. In Malaysia, we are operating at full capacity at two factories. In Japan, we have bases in Okayama, Ishikawa, and Kumamoto prefectures, and we believe we can continue to expand our presence in the Japanese market. Since 2022, we have been steadily bringing back production to Japan.
One way to improve efficiency is reducing costs. We are taking a completely different approach than before, checking the numbers every week. I believe we can achieve efficiency gains of over 100% within six months or so.
Furthermore, improving production efficiency requires digitalization, automation, and visualization. Systems are crucial for this, and we have mostly completed our system setup. Once that’s in place, data will be automatically input into the system, and analysis results will be generated automatically. Therefore, I am confident that we will deliver strong numbers if we do what needs to be done.
At Ferrotec, we place great importance on building our corporate culture. After all, when the corporate culture improves, the entire company becomes more vibrant. Our fundamental philosophy is to “respect our customers” and “respect our employees.” Learning, diligence, and integrity form the foundation of our corporate culture. In the pursuit of quality, it is crucial for every department to create a cooperative environment and foster a positive culture.
Human capital is also critically important. One way to secure talent is to thoroughly train our existing employees. Another is to bring in talented individuals from outside the company. We are confident that as the company improves, high-quality talent will naturally be drawn to us.
Topics (3): Shareholder Return Policy
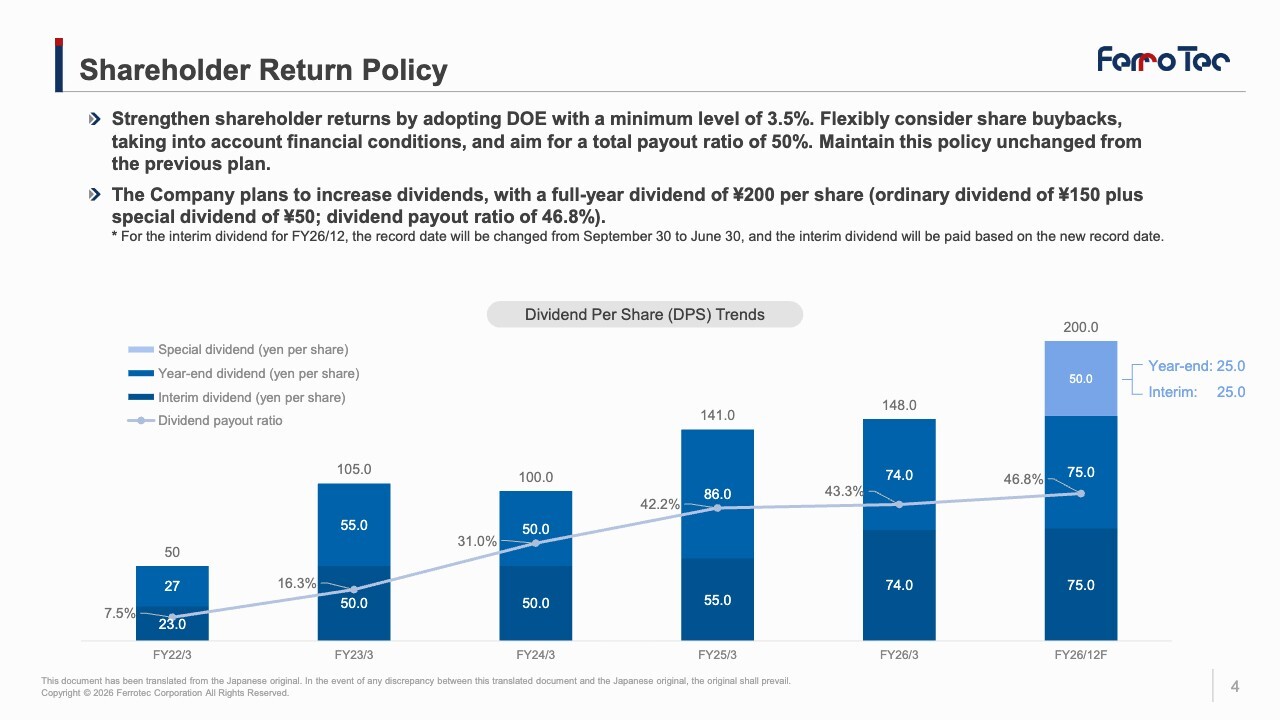
Lastly, I am determined to ensure that our financial standing is in good shape. We have adopted DOE, with a minimum level of 3.5%. Our figures have been steadily improving, and I am confident that our equity ratio will reach 40% this year.
We must pursue both shareholder returns and employee returns. Regarding shareholder returns, we aim for a dividend payout ratio of 50%, as we promised last year. As for employee returns, we hope we will be able to pay bonuses equivalent to six or eight months’ salary. We believe attractive companies like ours will continue to draw top talent.
Additionally, we are considering share buybacks, with a scale of approximately ¥25.0 billion. We also plan to sell surplus assets to raise funds and improve cash liquidity, which will enable us to implement various initiatives. Our plans include increasing production and profits, M&A, new business ventures, and the construction of new factories. Based on our assessment, we will likely need to build about six new factories. I am confident that we can achieve growth that exceeds your expectations, and we appreciate your continued support.
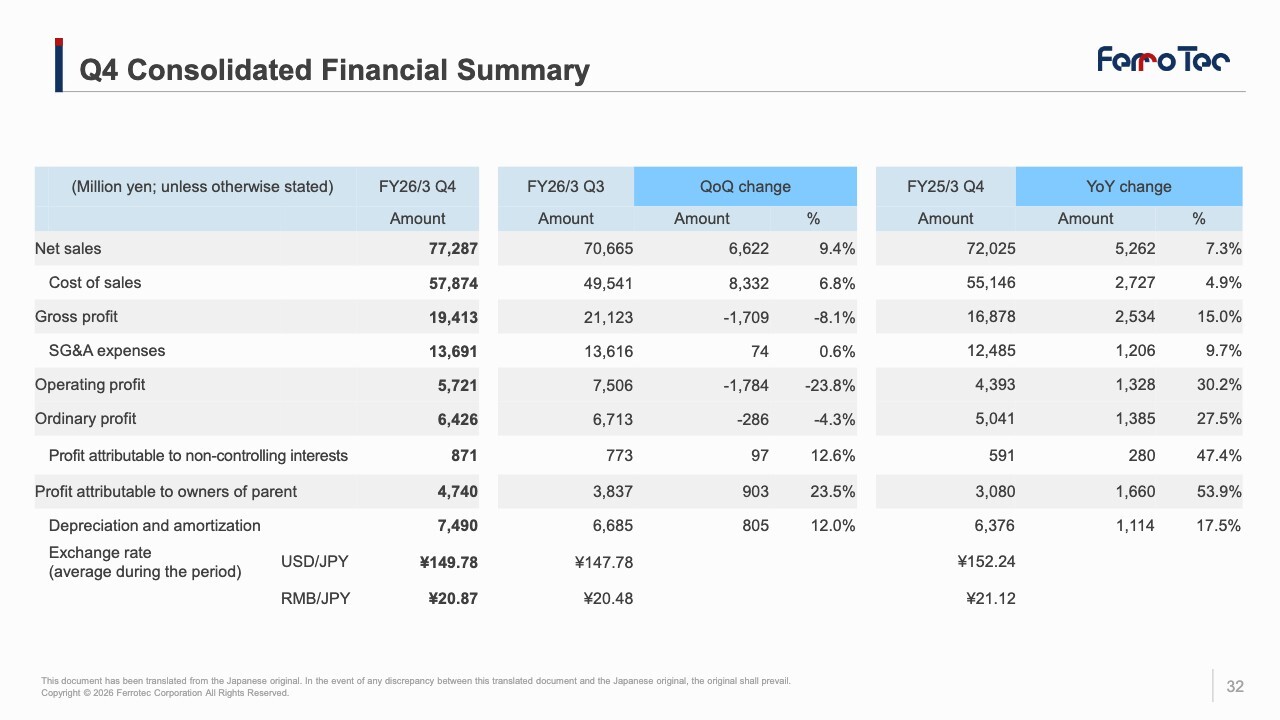
Full-Year Consolidated Financial Summary
Mr. Akira Takeda: I am Takeda, the head of finance. I will explain the financial results for FY26/3.
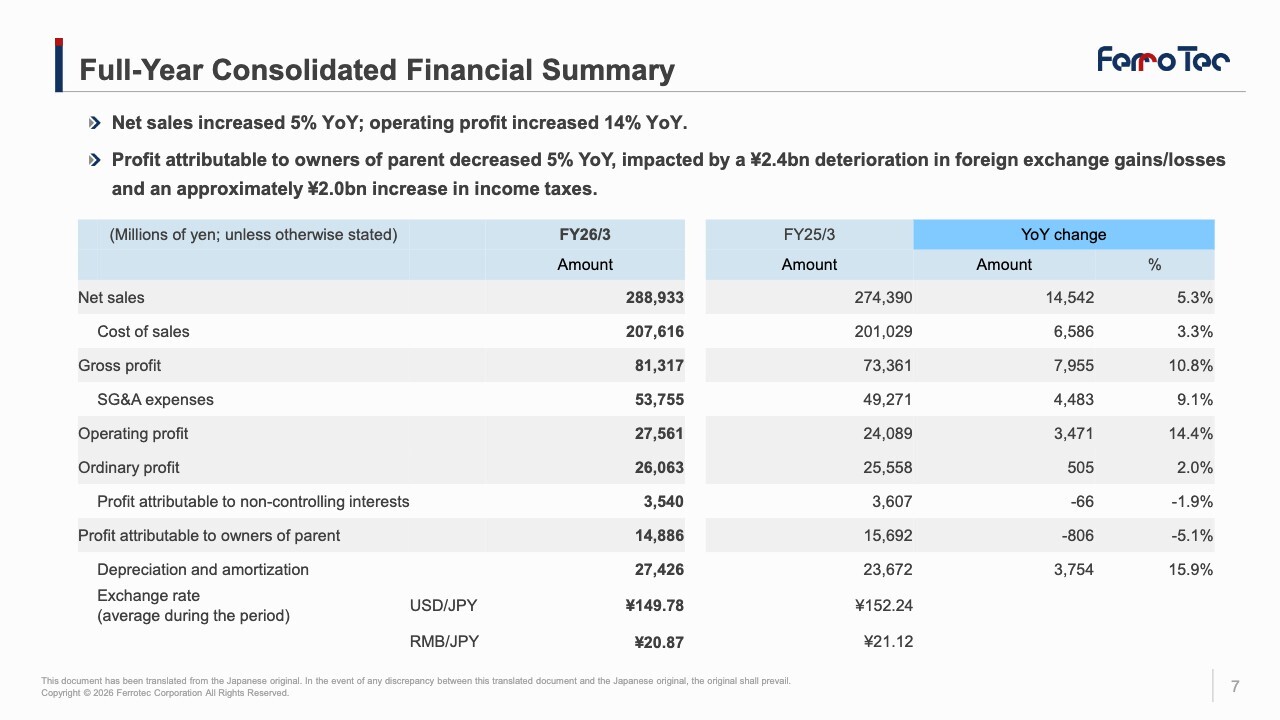
Net sales amounted to ¥288.9 billion, an increase of 5% YoY. Operating profit was ¥27.5 billion, up 14% or ¥3.4 billion YoY. Ordinary profit was ¥26.0 billion, up 2% YoY, impacted by a ¥2.4 billion deterioration in foreign exchange gains/losses under non-operating income/expenses. With income taxes increasing by approximately ¥2.0 billion, profit attributable to owners of parent decreased 5% YoY to ¥14.8 billion.
Sales and Operating Profit Summary by Segment
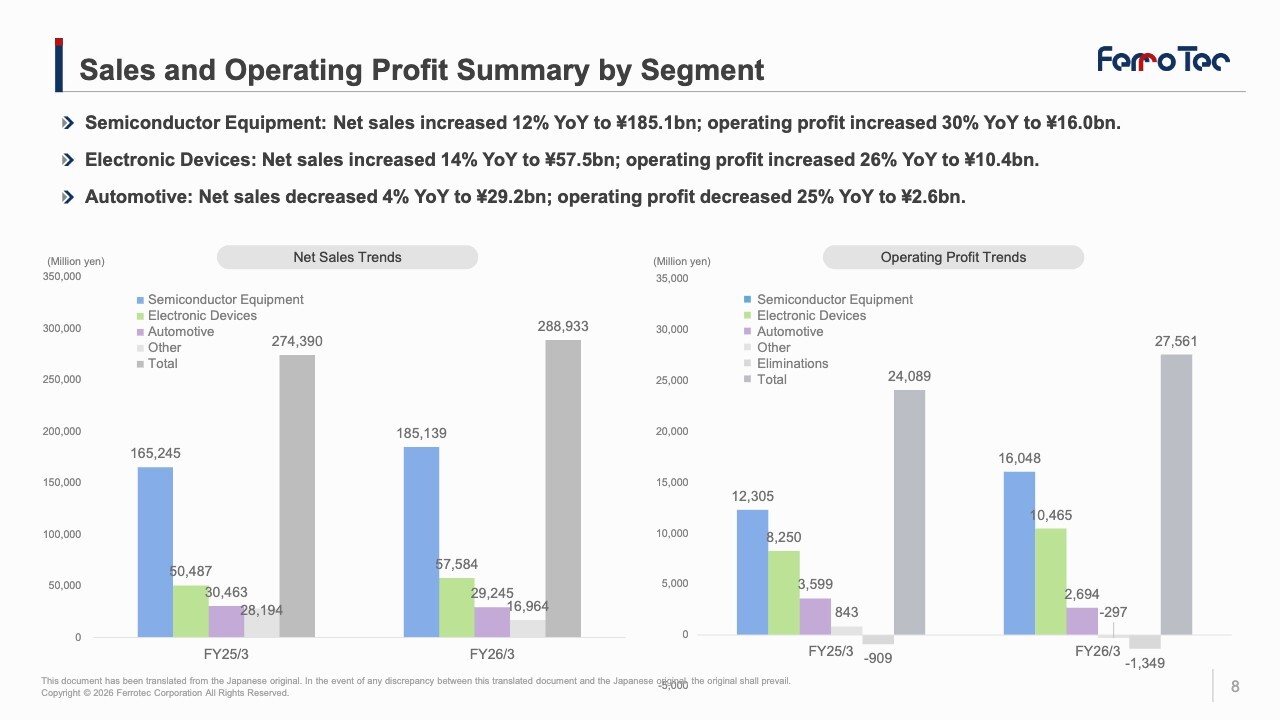
Let me explain our results by segment. In Semiconductor Equipment , net sales increased 12% YoY, capturing increased demand driven by production expansions at semiconductor equipment manufacturers, specifically with growth in ceramics and metal processing OEM. Operating profit also increased 30%.
In Electronic Devices, net sales increased 14% YoY, and operating profit increased 26% YoY, driven by growing sales of thermoelectric modules for AI-related optical communication transceiver applications.
In Automotive, net sales decreased 4% and operating profit fell 25% YoY as demand for power semiconductor substrates, such as those for EVs, entered an adjustment phase, leading to sluggish sales and profits, while thermoelectric modules also faced headwinds.
Consolidated Balance Sheet
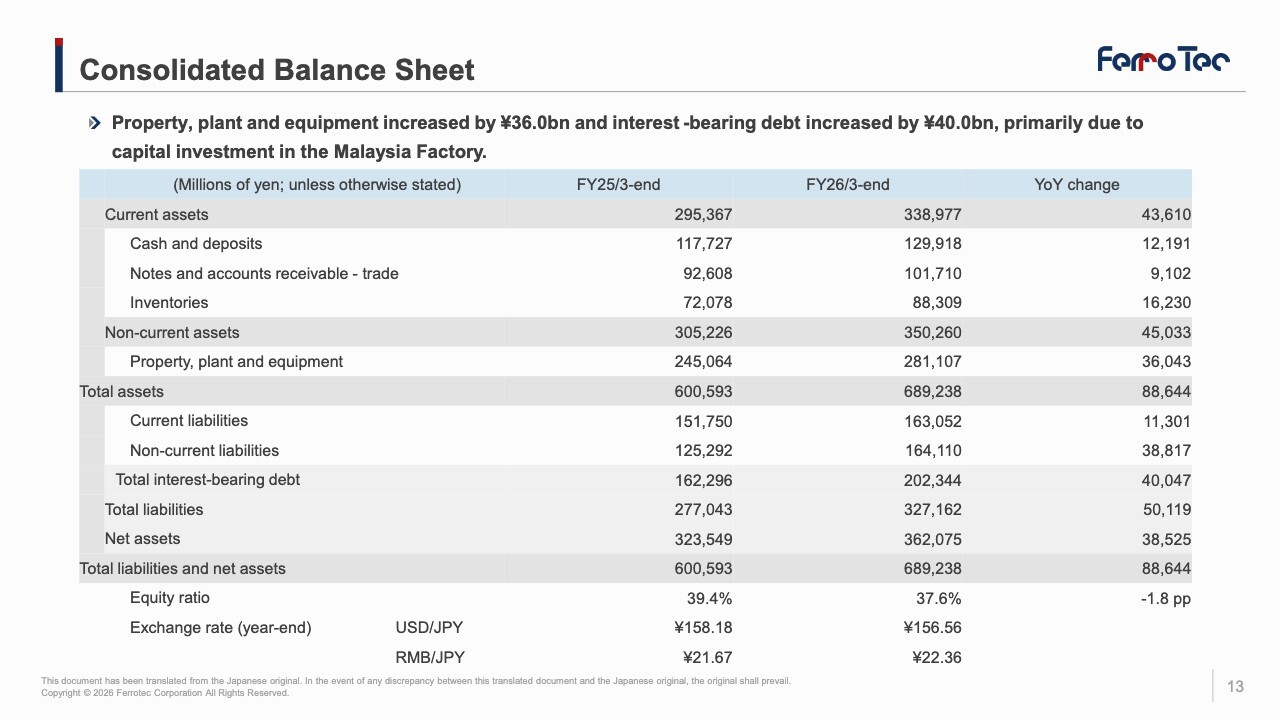
On the consolidated balance sheet, property, plant, and equipment increased by ¥36.0 billion primarily due to capital investments in the Malaysia Factory. On the liabilities side, interest-bearing debt increased by ¥40.0 billion.
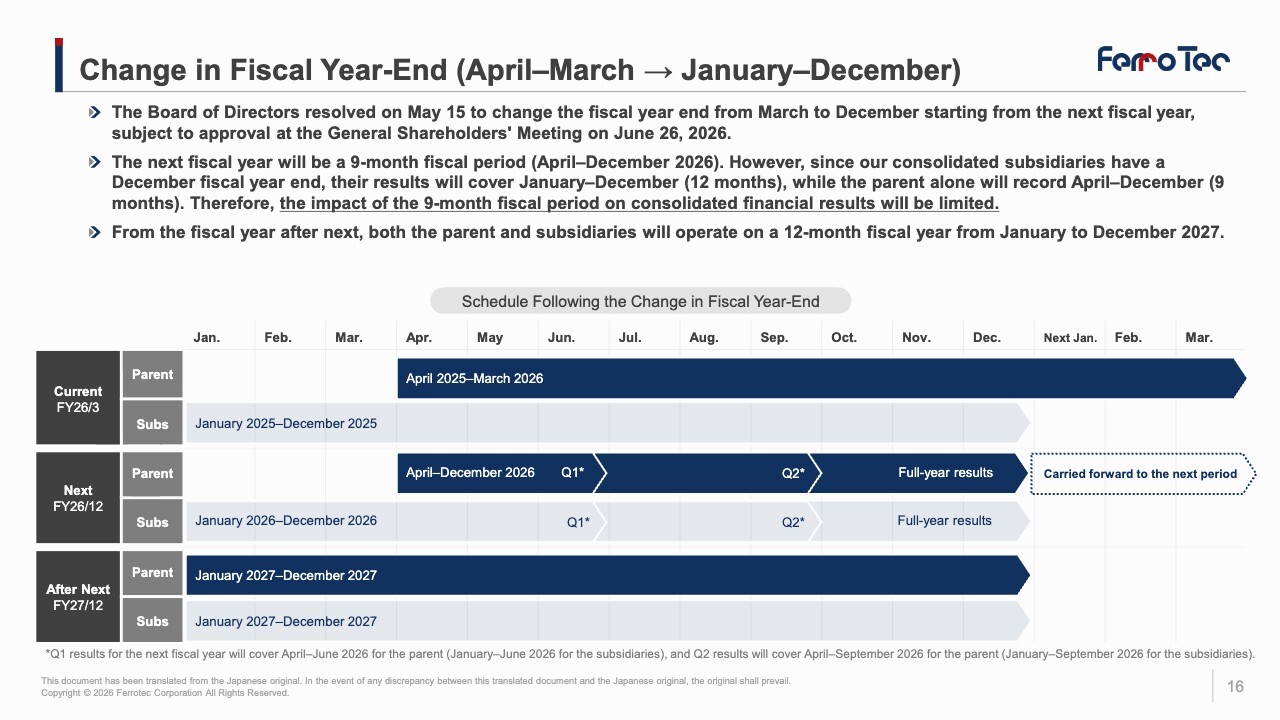
Change in Fiscal Year-End (April–March → January–December)
Next, I will explain our full-year earnings forecast for FY26/12.
We have decided to change our fiscal year-end to December, subject to approval at the General Shareholders’ Meeting in June. The current fiscal year ending December 2026 will be a nine-month period spanning April to December 2026. However, since our consolidated subsidiaries have historically been on a December fiscal year-end, their net sales and profit/loss for the January-December period will be included in our consolidated financial statements. Consequently, the impact of the nine-month reporting period on our consolidated financial results will be limited to approximately ¥5.0 billion in net sales.
FY26/12 Full-Year Earnings Forecast
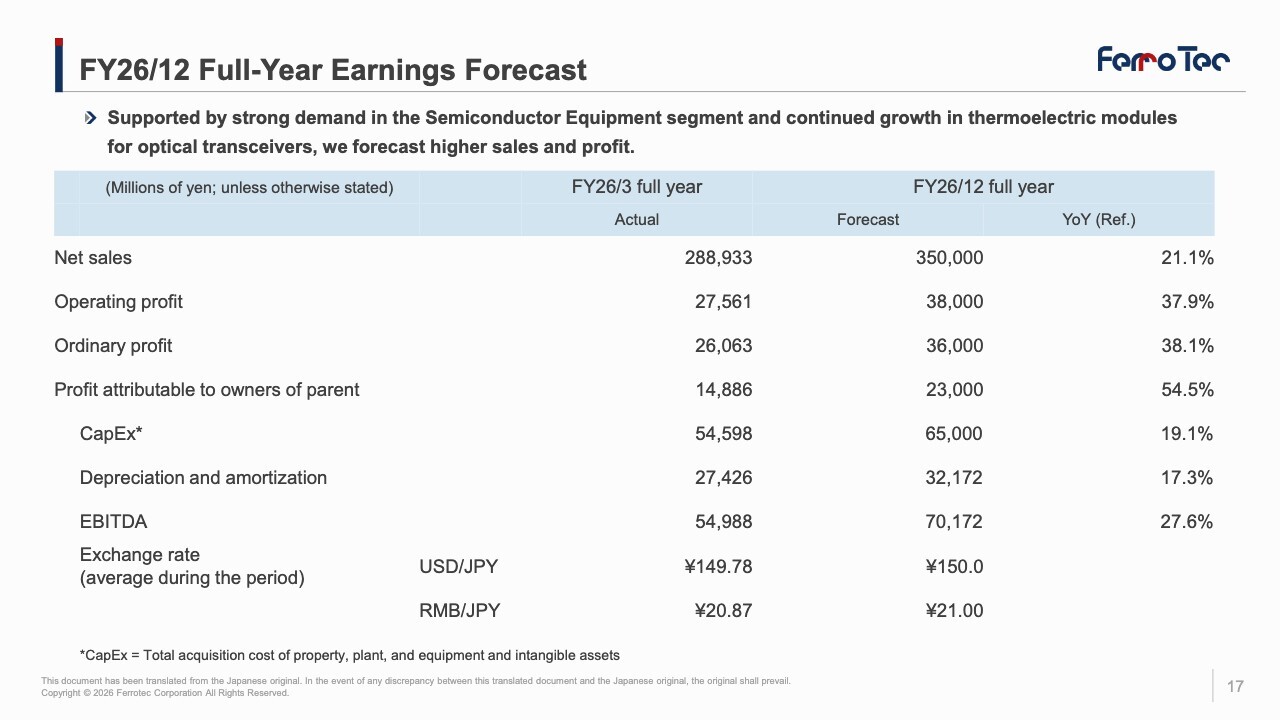
For FY26/12, we forecast net sales of ¥350.0 billion, up 21% YoY; operating profit of ¥38.0 billion, up 38% YoY; and profit attributable to owners of parent of ¥23.0 billion, up 54% YoY.
Let me explain the figures by segment. For Semiconductor Equipment, inquiries are increasing rapidly from both U.S. and Chinese customers. In particular, sales of metal processing OEM and ceramics, which are linked to semiconductor production equipment (SPE) output, are increasing, and sales of parts cleaning linked to semiconductor manufacturing in China are also increasing. Consequently, we forecast net sales to grow by 20% YoY.
For Electronic Device, sales of thermoelectric modules—particularly for AI-related optical transceivers—continue to expand, and we forecast sales to grow by 28% YoY.
Automotive is also expected to grow by 24% YoY due to increased sales of thermoelectric modules and power semiconductor substrates.
Now I will explain the update to our medium-term management plan. For KPIs, we have raised our net sales and profit forecast for FY26/12 and our profit plan for FY27/12. Additionally, we have set our plan for FY28/12 at ¥450.0 billion in net sales, ¥57.0 billion in operating profit, and ¥38.0 billion in profit.
Although we have lowered our ROE and ROIC targets to levels consistent with our profit guidance, our target levels remain unchanged at 15% for ROE and 8% for ROIC.

The basic policy of our medium-term management plan is to address the Ex-China production needs of our Japanese, U.S., and European customers, while also strengthening our customer engagement in China to achieve growth. We will place particular focus on AI and data center-related businesses.
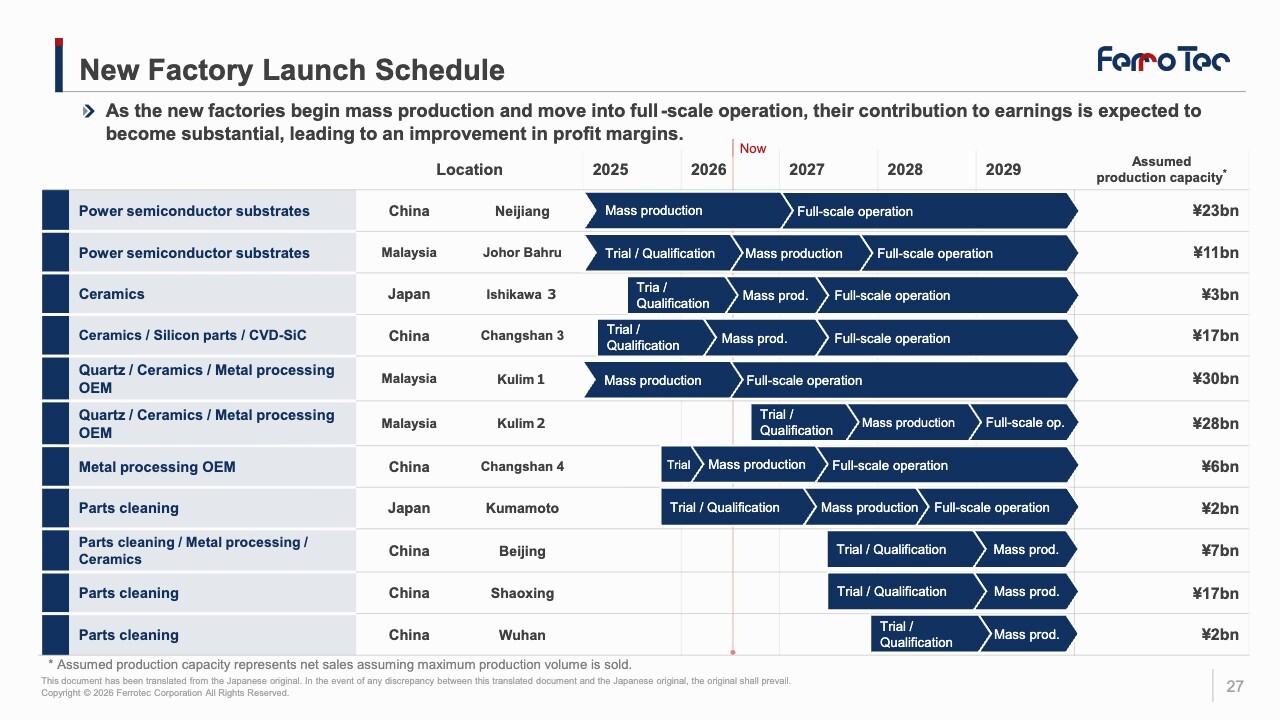
Currently, profit margins have declined partly due to large-scale investments in Malaysia. We have stepped up our efforts to improve profit margins, working to increase profitability at our Malaysia Factory while also advancing cost management, cost reduction, and initiatives in digitalization, automation, and AI adoption. Additionally, initiatives are ongoing to strengthen our human capital and promote our corporate culture.
On the financial front, beginning with capital expenditures, given the recent surge in capacity expansion requests from our semiconductor customers, we have increased the CapEx plan for the three-year period to FY27/12 by approximately ¥35.0 billion, factoring in investments to increase ceramic production capacity and additional investments in the Malaysia Factory. Our policy on Group asset disposal of ¥50.0 billion remains unchanged.
Regarding our shareholder return policy, we maintain the minimum level of the DOE (Dividend on Equity) at 3.5%. While taking into account our financial conditions and other factors, we will flexibly consider share buybacks and aim for a total payout ratio of 50%. We plan to implement share buybacks totaling ¥25.0 billion through FY28/12.
For FY26/12, we plan to pay a dividend of ¥200 per share and will strive to enhance corporate value along with business growth.
Q&A (1): Operating profit for the Semiconductor Equipment business for Q3 to Q4 FY26/3
Q: My question concerns the operating profit for the Semiconductor Equipment business for Q3 to Q4 of FY26/3. You revised your forecast upward after the end of Q2; however, the full-year results ended up falling short of the initial target. Please elaborate on the factors behind this outcome and your outlook for a recovery in FY26/12.
A: As you pointed out, operating profit for the Semiconductor Equipment business in Q3 and Q4 decreased from the Q2 level. Particularly for Q4, net sales were ¥50.8 billion compared to ¥45.9 billion in Q3, while operating profit fell from ¥4.3 billion in Q3 to about ¥3.5 billion in Q4.
This was primarily due to the situation at our newly established factories in Malaysia and other regions. Although the factories are generally up and running smoothly, some products did not fully satisfy quality requirements during the production process. Consequently, we reviewed our inventory valuation and recorded a valuation loss, which was the main factor behind the decline.
Additionally, regarding the quartz crucible operations, we have been scaling back quartz crucibles for PV applications since the previous fiscal year to specialize in quartz crucibles for semiconductor applications. While this resulted in a significant improvement in profitability, we recorded an inventory valuation loss on the remaining stock of quartz crucibles for PV applications.
Looking ahead to FY26/12 and beyond, we expect steady improvement in the operations of our Malaysia Factories, and we also have made progress in securing qualification from major customers. Furthermore, we have driven initiatives in quality control and improvement, and also advanced organizational structure improvements. Accordingly, we anticipate inventory valuation losses and similar factors will be minimal from FY26/12 onward.
I’ve explained the background to the valuation write-down, which occurred as we passed customer qualification and moved toward mass production in 2026. Although we faced various challenges during the startup phase of our factories in Malaysia—our first venture into that market—almost all of these issues have now been resolved.
Furthermore, regarding valuation losses on quartz crucibles, we expect no such losses to occur during this fiscal year, as we are currently significantly scaling back our quartz crucible operations for PV applications.
Q&A (2): Valuation loss on quartz crucibles for PV applications in Q4
Q: What was the extent of the negative impact on Q4 results from the valuation loss on quartz crucibles for PV applications?
A: Profit from quartz crucibles in Q4 decreased by about ¥500 million to ¥600 million compared to Q3, and it is safe to assume that a considerable portion of this decline resulted from the valuation loss.
Q&A (3): Factors behind expenses and profit declines in Q3 and Q4 of FY26/3
Q: What amount of valuation losses did you record for product valuation at the Malaysia Factory in Q3 and Q4, respectively?
A: We recognized approximately ¥1.0 billion.
Q: Comparing Q3 with Q4, which quarter accounted for the larger amount? Or were the amounts roughly the same?
A: We recorded the majority of the amount in Q4.
Q: Could you please further clarify the factors behind the profit declines, specifically the causes of the profit decline from Q2 to Q3 of FY26/3, the causes of the profit decline in Q4, and the issues at the Malaysia Factory?
A: I will clarify the main factors behind the profit decline.
Operating profit for the Semiconductor Equipment business in Q3 was ¥4.2 billion, a decrease of ¥0.7 billion from Q2. The main factors were negative impacts totaling ¥0.3 billion from inventory write-downs in Malaysia and Japan related to vacuum feedthroughs & metal processing OEM, and ¥0.3 billion from low-margin transactions in quartz crucible operations.
Operating profit for Q4 was ¥3.5 billion, a decrease of ¥0.7 billion from Q2. The main factors were negative impacts of ¥0.9 billion from inventory write-downs related to vacuum feedthroughs & metal processing OEM in Malaysia, and ¥0.5 billion from inventory write-downs in quartz crucibles operations.
In the Electronic Device business, operating profit for Q3 was ¥3.0 billion, a decrease of ¥0.1 billion from Q2.
Operating profit for Q4 was ¥1.6 billion, a decrease of ¥1.3 billion from Q2. The main factors were negative impacts of ¥0.5 billion from provisions for loans in the power semiconductor substrates operations and ¥0.6 billion from inventory write-downs associated with the transfer of production to China in the thermistor sensors operations.
Q&A (4): Outlook for profit margins and capacity utilization rates in the Semiconductor Equipment business
Q: If there were no initial teething issues you mentioned earlier and the Chinese factories are operating at full capacity, would you say the profit margins for the Semiconductor Equipment business are approaching the levels seen around 2021–2022, when they were quite high?
A: We expect net sales of approximately ¥180.0 billion and operating profit of between ¥28.0 billion and ¥30.0 billion for the January–June 2026 period. These figures reflect aspirations on the sales side, while our announced forecast for FY26/12 is net sales of ¥350.0 billion.
From a financial perspective, the Malaysia Factory is still operating at less than half capacity, although operations themselves have been running smoothly. Although we invested over $200 million in constructing Malaysia Factory No. 1, which is designed to generate approximately $240 million in net sales at full capacity, the net sales for the previous fiscal year were only about ¥14.0 billion.
We expect capacity utilization to reach 60% to 70% during 2026, and Factory No. 1 to reach roughly 90% of its capacity by 2027. Accordingly, we believe the planned profit margins we have announced will gradually recover.
Due to the current surge in demand, we are also accelerating investment in our Malaysia Factory No. 2. Operations are scheduled to begin by the end of this year, with capacity utilization reaching approximately 40% in 2027 and subsequently increasing to about 90%. While current numbers are still below our future target operating profit margin, these developments are expected to be major growth drivers going forward.
Q&A (5): Cost burden for the development of new equipment
Q: Previously, you explained that many projects related to the development of new equipment, such as chambers—specifically within the vacuum feedthroughs & metal processing OEM operations—involve low profit margins because they are new initiatives. Could you give us an idea of the cost burden associated with these new development activities?
A: It is difficult to express those expenses as a single figure. When developing new chambers and other equipment, we generally factor all associated costs into the cost base on an averaged basis.
On the other hand, the machine utilization rate at our Malaysia Factory is still roughly 10% to 15% lower than that in China. Therefore, we are working hard to increase the utilization rate by advancing employee training, for example, while using China’s utilization rate as a benchmark.
Q&A (6): Factors behind the Electronic Device business’s slowdown in Q4
Q: My question concerns Q4 FY26/3. Is it correct to understand that the decline in operating profit for the Electronic Device business was almost entirely due to one-time factors, such as valuation losses?
A: While profit in the Electronic Device business is driven by thermoelectric modules, toward the end of the fiscal year, profit declined by about ¥0.5 billion in power semiconductor substrates and about ¥0.6 billion in thermistor sensors, which pushed down the Q4 figures.
We believe this Q4 decline was driven by one-time factors.
In power semiconductor substrates, profitability came in lower than expected. In thermistor sensors, we have not yet fully penetrated the Japanese market or fully executed our strategic target mix of “70% elements and 30% sensors.”
For thermoelectric modules, we are pursuing a fairly aggressive approach.
Q&A (7): Growth of the optical transceiver market and business expansion
Q: I would like to ask about your optical transceiver-related operations. Thank you for the detailed explanations provided in your presentation materials. Meanwhile, despite the overall growth of the optical transceiver market, it seems to me that your growth has not been as strong as we might expect. Could this be affected by the shift from lasers to silicon photonics?
In the presentation video, you mentioned that your company holds approximately 70% of the market share among major global manufacturers, and I understand that you continue to maintain a strong position. Could you provide additional details regarding the competitive landscape, your company’s growth potential in relation to market expansion, and profit contribution from this area?
A: Our thermoelectric modules have posted very strong results in both Q1 and Q2. As for optical transceivers, our monthly production is currently between 4 million and 5 million units, and we expect this to reach 6 million units shortly.
For instance, when I discussed various matters with major Chinese manufacturers the other day, I truly felt their strong momentum. Since the start of 2026, we’ve seen our thermoelectric module business growing quite robustly.
Additionally, the power semiconductor substrates sector is showing signs of a gradual recovery. We have established a production structure for silicon nitride substrates, and plan to utilize our in-house silicon nitride substrates moving forward. For these reasons, we have high expectations for our performance in the latter half of this year.
Q&A (8): Outlook for financial results
Q: I feel the Semiconductor Equipment business is picking up very strong momentum. In the presentation video, you mentioned you expect growth of 25% to 30%. Given this, the target figures of ¥350.0 billion in net sales for FY26/12 and ¥400.0 billion for FY27/12 seem somewhat conservative when compared to market trends. Could you please elaborate on this point?
A: While we’ve presented somewhat conservative figures, we are actually seeing growth. From a sales side perspective, we are seriously aiming for ¥400.0 billion in net sales for FY26/12, and we believe we can achieve operating profit of around ¥50.0 billion. But of course, this is not an official announcement by the company.
I discussed our target figures, but the numbers the sales department aims for are naturally different from those the finance department looks at. Please understand that the figures we disclose are those viewed by the finance side and differ slightly from the figures that reflect aspirations of the sales side.
Q: I understand the distinction between the so-called financial perspective and the ambitious targets the President is aiming for. It seems the background you explained has led to the remark about the Chinese factories being extremely busy.
I assume you are not at all satisfied with the current profit margins, but is it fair to expect that profit margins will improve in the not-too-distant future as you advance automation?
A: You are absolutely correct.
Q&A (9): Production structure and future plans for the Malaysia Factories
Q: Please share your outlook for operations in Malaysia. I understand that Factory No. 2 is set to begin operations soon. Based on customer inquiries, is there a possibility that you will further expand your operations in Malaysia with factories No. 3 and No. 4? Also, looking ahead with a three- to five-year timeframe, is there still room to increase production in Malaysia?
A: I visit Malaysia every month in connection with the projects currently underway. For Kulim Factory No. 1, we now have a clear outlook to increase capacity utilization by the end of this year and transition to full-scale production. As for Factory No. 2, construction is scheduled to be completed in August, with the completion ceremony planned for October. We will begin installing machinery in the latter half of August.
Our customer based in Kulim in northern Malaysia has told us, “We have plenty of orders. We’ll place a lot of orders,” so we have high expectations. The current challenge lies in the ceramics-related operations, while we anticipate that metal processing OEM will be manageable for now. We plan to gradually increase the utilization rate starting in the latter half of next year.
I have another piece of new information to share. Major U.S. manufacturers are shifting their policies away from Ex-China production, and some are suggesting that “it doesn’t necessarily have to be 100% Ex-China,” “It might be acceptable to manufacture in China.” We believe we need to consider our future sales strategy, including how much we can increase capacity utilization in Malaysia.
Additionally, our silicon parts manufacturing facilities are operating at full capacity in Johor Bahru in southern Malaysia. However, as you are well aware, our Malaysian employees are still getting used to the work, and as a result, capacity utilization is 10% to 15% lower compared to China.
Another factor behind the lower utilization rate is the high number of public holidays in Malaysia. For example, they observe Chinese New Year, Indian New Year, and the fasting period, among other holidays. Therefore, we are developing a maximum feasible annual plan, considering how to bring the utilization rate closer to 100% while also accounting for these holidays.
Another priority area in Johor Bahru is power semiconductor substrates. Currently, we are manufacturing 250 thousand DCB master cards per month, and for AMB, we have planned production of approximately 100 thousand units starting this month.
When comparing Malaysia with China, there is still a gap in efficiency at this point, leaving challenges to be addressed before Malaysia’s efficiency catches up with that of China. Therefore, based on a comparison of utilization rates—analyzing data such as the percentage of utilization for machining centers in China versus Malaysia—we are promoting training for our employees in Malaysia.
While it is difficult for the Malaysia Factories to achieve exactly the same level of efficiency as China at this time, I visit Kulim and Johor Bahru once a month to hold regular meetings with employees. I would appreciate your understanding of the situation and ask for a little more time.
Q&A (10): Issues with the ceramics operations
Q: When you say you are facing challenges with the ceramics operations, is it correct to understand that the issue is not with the ceramics your company produces, but rather with the localization of the ceramics that your customers purchase in China?
A: Our customers purchase products from both China and Malaysia, but the majority of their procurement comes from China. Currently, in addition to rising demand from major U.S. manufacturers, we are also required to immediately make powder available.
We are also short on some equipment and exploring how to address this shortage.
We have secured a site for a factory in Changshan and are in a decision-making process to build a granulation plant there. As such, we face many challenges regarding ceramics, particularly in the raw material procurement process.
Order volume is so high that we need to increase production capacity, but we are struggling to do so.
Q&A (11): Plans for the establishment of Malaysia Factory No. 3
Q: Is it still premature to establish Factory No. 3 in Malaysia? Will you prioritize increasing production capacity for ceramics?
A: While we are considering the matter, we have candidly informed a major U.S. manufacturer that we plan to “lease the factory building instead of constructing it,” and they expressed their agreement in principle.
Q&A (12): Supply capacity and production expansion plans for thermoelectric modules
Q: My question is about thermoelectric modules. I understand that demand for thermoelectric modules is growing significantly right now, but does your supply capacity adequately meet this demand? Or does the situation prompt you to increase production?
A: We have already begun expanding production. We are currently ramping up production to 6 million units per month and have already established a structure capable of producing 5 million units per month. By the end of this year, we plan to expand production to 9 million units per month.
When I spoke with a key figure from a major Chinese manufacturer the other day, I was told to “increase production as soon as possible.” I promised to ramp up production to 9 million units per month by the end of this year. Depending on the situation, production could possibly reach 10 million units per month.
At present, increasing production of thermoelectric modules is easier than for ceramics because we can fully automate the process simply by installing the necessary machinery. In contrast, other companies still rely heavily on manual processes. This gives us a competitive advantage. For example, if we hadn’t automated our operations, producing 6 million units per month would have been difficult.
Q&A (13): Acceleration of speed in optical communications in data centers and the outlook for unit prices and demand for thermoelectric modules
Q: If the speed increases to 1.6T going forward, will it significantly change the structure of the thermoelectric modules? Will the unit price and manufacturing difficulties remain essentially the same? Or is there potential for an increase in the unit price?
A: If speeds increase to 1.6T, the number of modules installed may decrease, depending on the manufacturer’s design. Development of 3.2T modules has already begun, and we believe they will offer significantly higher added value than the existing products.
Therefore, in that sense, we consider it difficult to significantly reduce the number of modules installed. However, we are exploring cost-reduction measures to enhance added value.
Q: Just for clarification, what is the underlying reason for the possibility that the number of modules installed will decrease when speeds increase to 1.6T?
A: Simply put, what manufacturers are currently envisioning is reducing the number of thermoelectric modules installed from two to one. This involves a silicon photonics structure.
However, I do not expect a significant reduction in the number of thermoelectric modules as a whole. Essentially, 800G modules will continue to exist in the market. For example, 400G modules are also quite widespread in Japan. The current mainstream in Japan encompasses both 400G and 800G modules. On the other hand, in the U.S., 1.6T modules—and the upcoming 3.2T modules—are likely to become the mainstream.
Q: Turning to technological advancements and overall demand volume, given that the adoption of silicon photonics is already underway, is it correct to understand that demand volume will increase over time, even if its growth rate appears to be lower than the growth rate in unit count in the short term? Also, even if you say the number will decrease, it’s simply a matter of going from two units to one. So, is it correct to understand that the overall trend of continued demand growth remains unchanged?
Also, you mentioned your thermistors (temperature sensors) and the components you just mentioned that are used per unit are expected to be used over the next few years as the market expands, if I understand correctly? Is it fair to generalize that demand for thermistors will also grow?
A: Yes, exactly. As I discussed earlier about expanding our capacity, I don’t think the cost will be particularly high for increasing capacity for thermoelectric modules. The main reason for expanding our capacity is the growth in our market share.
Although price competition is fierce, our policy is to raise prices as necessary.
Q&A (14): The Company’s outlook on WFE demand and its supply structure
Q: My question concerns the outlook for wafer fab equipment (WFE), which is frequently discussed in the industry. I understand your company has business relationships with major Chinese manufacturers. What is their outlook? What kind of growth do you anticipate not only this year, but also for next year and the year after?
A: We believe the market will continue to grow through 2030.
Q: What scale of growth are you anticipating?
A: By 2030, one major Chinese manufacturer is projecting RMB 100.0 billion, while another is forecasting RMB 50.0 billion. Additionally, there is another major Chinese manufacturer whose output was approximately RMB 8.0 billion last year but is expected to grow to between RMB 20.0 billion and RMB 30.0 billion very soon.
The demand from major Chinese manufacturers is edging up steadily, likely growing by 20% to 25%. Therefore, we basically consider the Chinese market to be promising through 2030.
Q: When you say it’s promising, does that mean you envision the market doubling in size between 2026 and 2030 compared to current levels?
A: Yes. I know the situation firsthand because I’m in the field.
Q: Is there any concern with WFE’s supply structure? Will you be able to ensure supply?
A: We will definitely establish a supply structure. We will work to ensure our capacity.
Q: You have slightly raised the capital investment plan for 2026 to 2030—but would that be sufficient?
A: We are working on this with a focus on advancing automation while making effective use of space. In Beijing, we may need to move forward with Factory No. 2 construction as soon as possible.
Q: What is the role of the Beijing Factory?
A: Its role is to develop the domestic Chinese market. The main targets are major Chinese manufacturers in the neighboring areas.
Q: Are you saying you plan to strengthen those customer relationships?
A: That is correct. One of our major strengths is that we have developed very good relationships with these major companies.
Q: Previously, were those relationships not particularly favorable? Have there been considerable changes?
A: Since the relationships were not particularly strong in the first place, it is difficult for them to grow dramatically overnight.
Q&A (15): Demand from major U.S. manufacturers
Q: What are the specifics of the demands from major U.S. manufacturers? Are they not as large as those from China?
A: The scale is on a different level for major U.S. manufacturers. The business we are currently handling in China amounts to about RMB 100.0 billion—roughly $15.0 billion—which is not yet on a very large scale. On the other hand, their demand has likely reached $40.0 billion.
Q&A (16): Customer composition by country for the Semiconductor Equipment business
Q: My question concerns the customer mix in the Semiconductor Equipment business. I recall you explained previously that, U.S. and Chinese companies each accounted for about 40%, with Japanese companies making up the remaining 20%. How do you expect this balance to shift by 2030?
A: We project that by 2030, China will account for about 40%, the U.S. for about 50%, and Japan for about 20% or 10%.
Q: Do you expect the U.S. to grow at a pace comparable to China’s?
A: The U.S. will grow. Fundamentally, the U.S. leads the world in the semiconductor sector. While China is actively pursuing technological development in various areas, the U.S. holds the competitive edge.
Q: You’re saying that while China will grow considerably, the U.S. will grow even more. And because not only the overall market but also the billing amount per unit of equipment will increase, the growth rate will exceed that of WFE, is that correct?
A: That is correct. Therefore, I don’t foresee investment slowing down.
Q&A (17): Impact of advanced automation on profit margin improvement
Q: Is it correct to understand that, rather than continuing with the same level of investment, you intend to significantly advance automation to improve and increase profit margins?
A: That is exactly what we intend to do. Since our cash flow has grown considerably, we believe this will also lead to a different approach compared to the past.