Financial Results Briefing and Mid-Term Management Plan Presentation Meeting: Agenda
Mr. Kaoru Kinoshita (“Kinoshita”): I am Kinoshita, Managing Executive Officer supervising Accounting and Finance. Thank you for joining our financial results briefing today. I appreciate your time. I will walk you through our performance for FY2025 (FY3/2026).
FY2025 (FY3/26) Consolidated Financial Results Summary
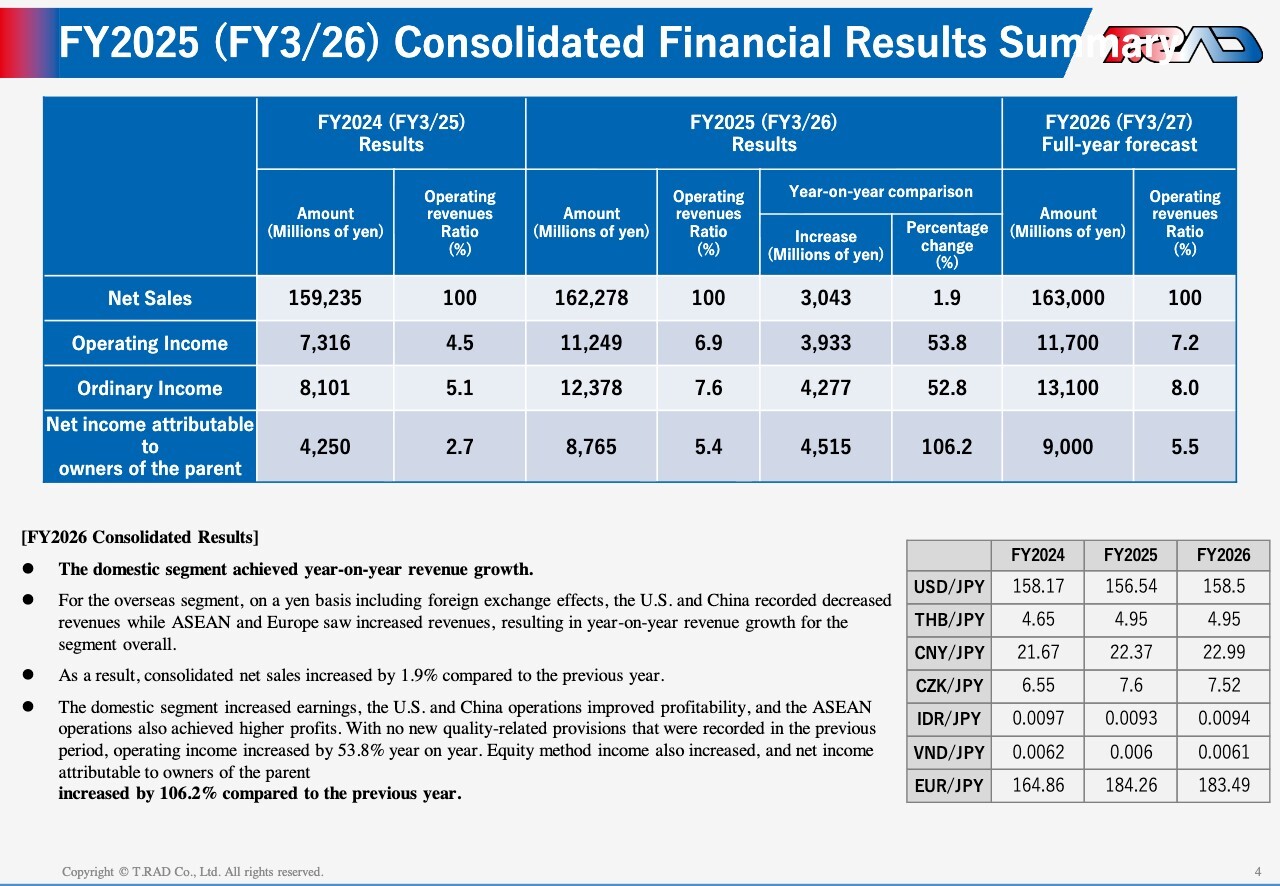
Let me start with an overview of our consolidated results. Please refer to the figures in the center of the slide. Net sales came in at ¥162,278 million, up 1.9% year on year. Both the domestic and overseas segments achieved year on year revenue growth.
As shown, all profit lines increased. Operating income reached ¥11,249 million, ordinary income was ¥12,378 million, and net income attributable to owners of the parent totaled ¥8,765 million. This represents further growth from the previous fiscal year, when we posted record-high profit, and marks a new all-time high.
On the right-hand side, we present our FY2026 (FY3/2027) full-year forecast. We expect net sales of ¥163,000 million, operating income of ¥11,700 million, ordinary income of ¥13,100 million, and net income of ¥9,000 million. The foreign exchange assumptions are shown in the table at the bottom right.
Regarding Full Year Performance Forecast for FY2026 (FY3/27)
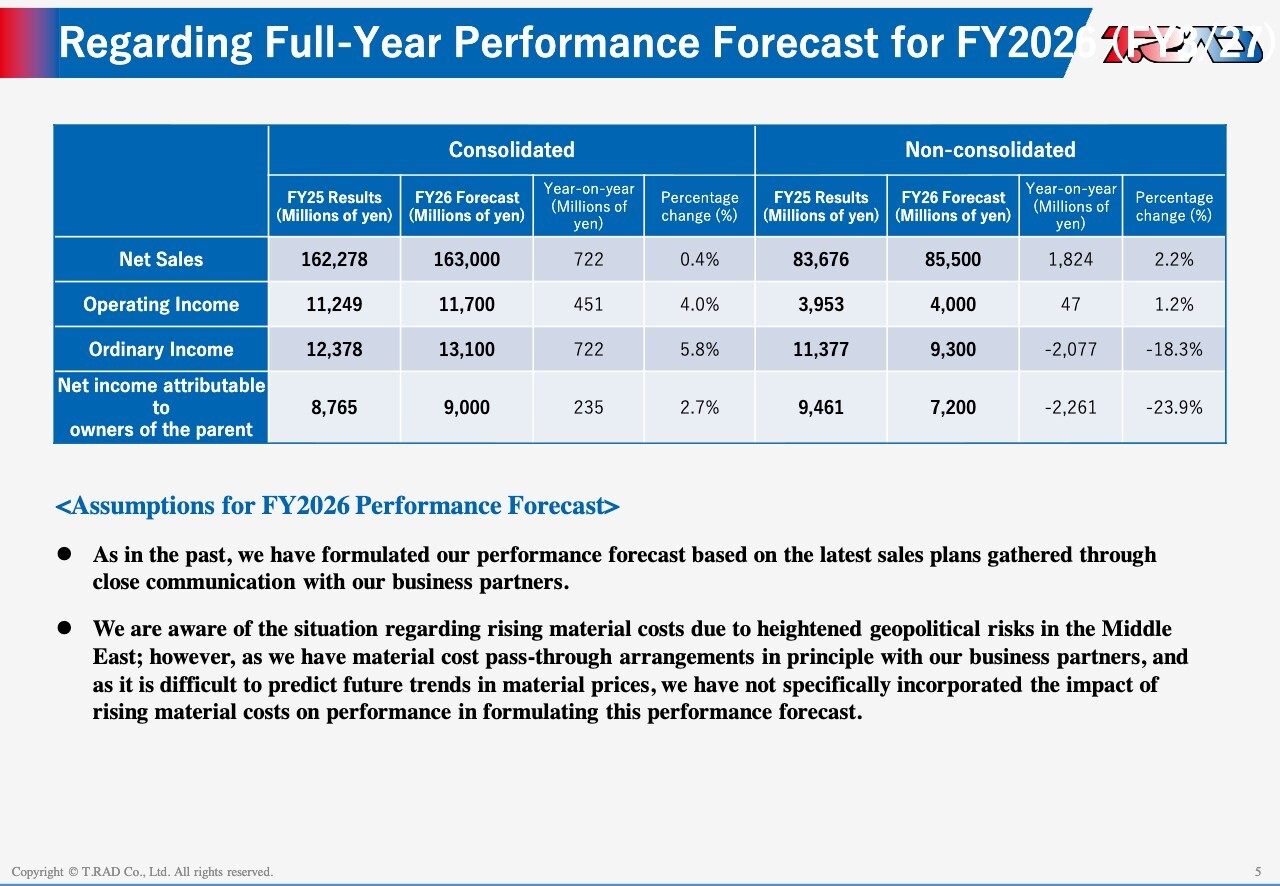
The left-hand side of the table shows our consolidated forecast, where we expect both revenue and profit to increase year on year. We base this forecast on the latest sales projections gathered from our current business partners.
On the non-consolidated side, shown on the right, we expect ordinary income and net income to decline year on year. This mainly reflects the absence of the special dividends received from subsidiaries in the previous fiscal year, as well as an increase in corporate taxes.
Let me outline the key assumptions behind our forecast. Prices for aluminum, copper, and resins have recently increased, reflecting heightened geopolitical risks in the Middle East. However, we generally have material cost pass-through arrangements with our business partners, and given the difficulty of forecasting future price trends, we have not incorporated the impact of higher material costs into this forecast.
FY2025 (FY3/26) Segment Overview
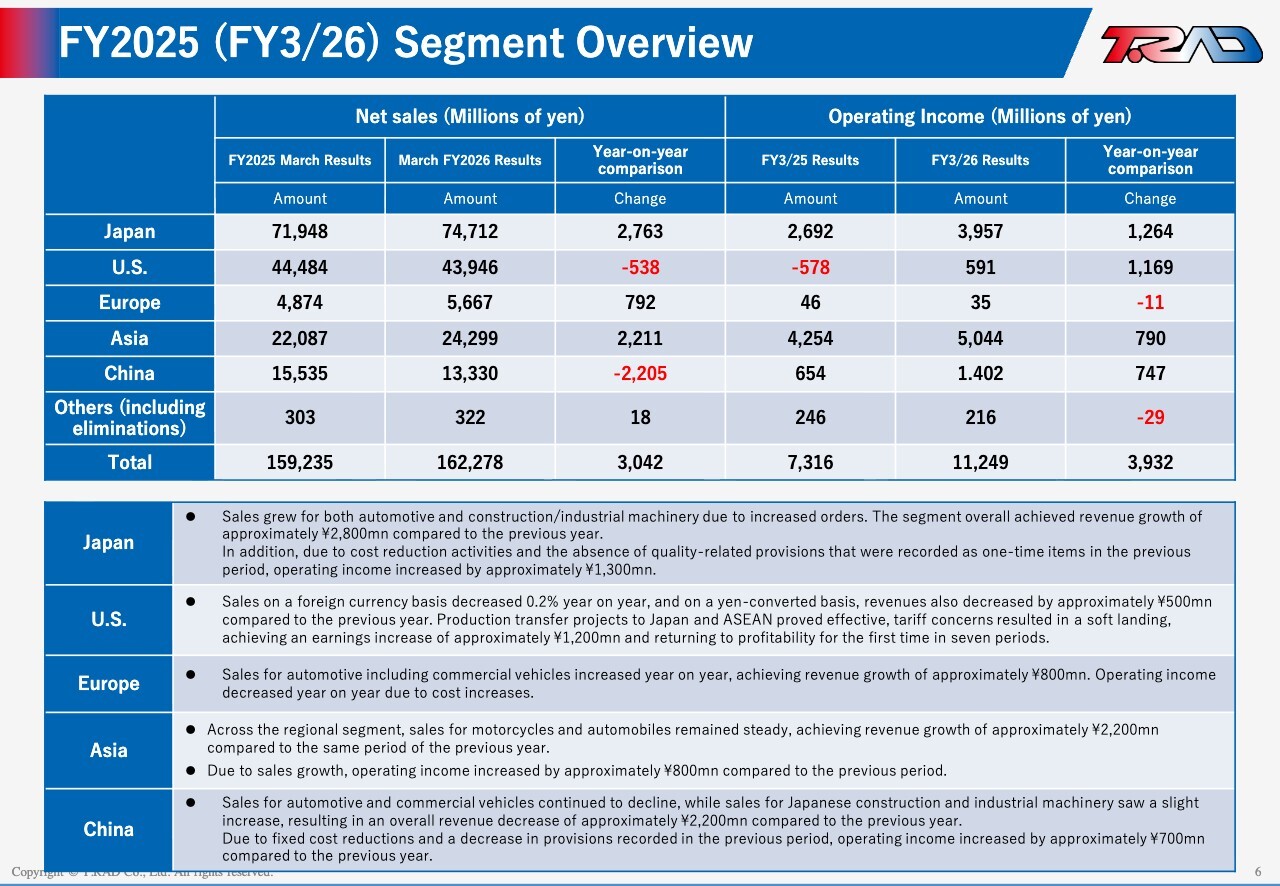
This slide summarizes performance by regional segment. Net sales increased year on year in both Japan and Asia, each by more than ¥2,000 million, driven mainly by higher sales to the automotive sector. In China, however, revenue declined, reflecting continued weakness among Japanese customers.
On operating income, the U.S. segment returned to profitability, and all regions remained in the black. Operating income increased across Japan, the U.S., Asia, and China. In particular, the U.S. delivered an increase of approximately ¥1,200 million, driven by progress in production load reduction initiatives, while China achieved higher profits through fixed cost reductions.
FY2025 Consolidated Balance Sheet
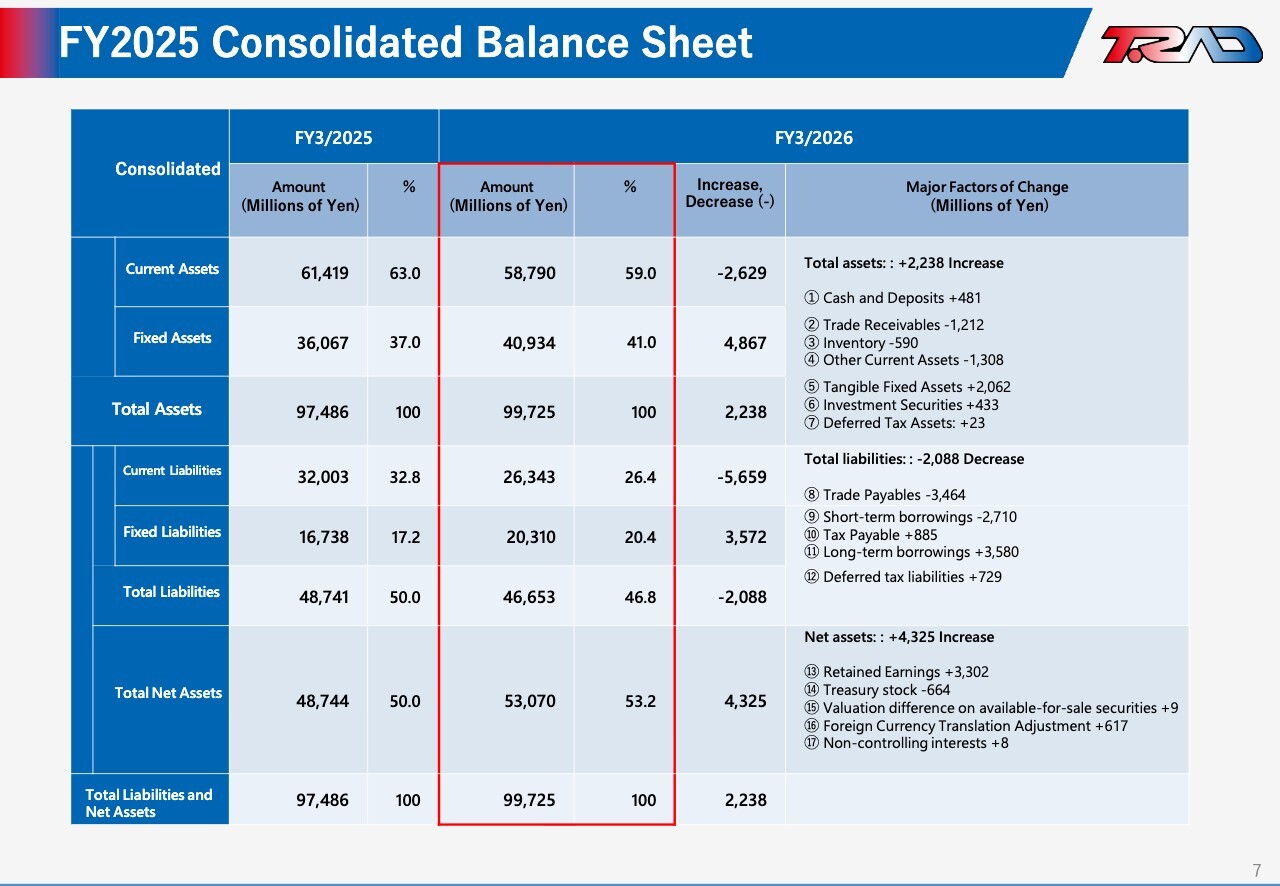
This slide shows the consolidated balance sheet. As of March 31, 2026, total assets stood at approximately ¥99.7 billion, an increase of approximately ¥2.2 billion from the end of the previous fiscal year. This was mainly driven by an increase in fixed assets, reflecting capital expenditures related to the new plant in Hadano.
Interest-bearing debt totaled approximately ¥19.5 billion. The equity ratio stood at approximately 53%, and net leverage was about 0.53x.
Financial Results (Consolidated)
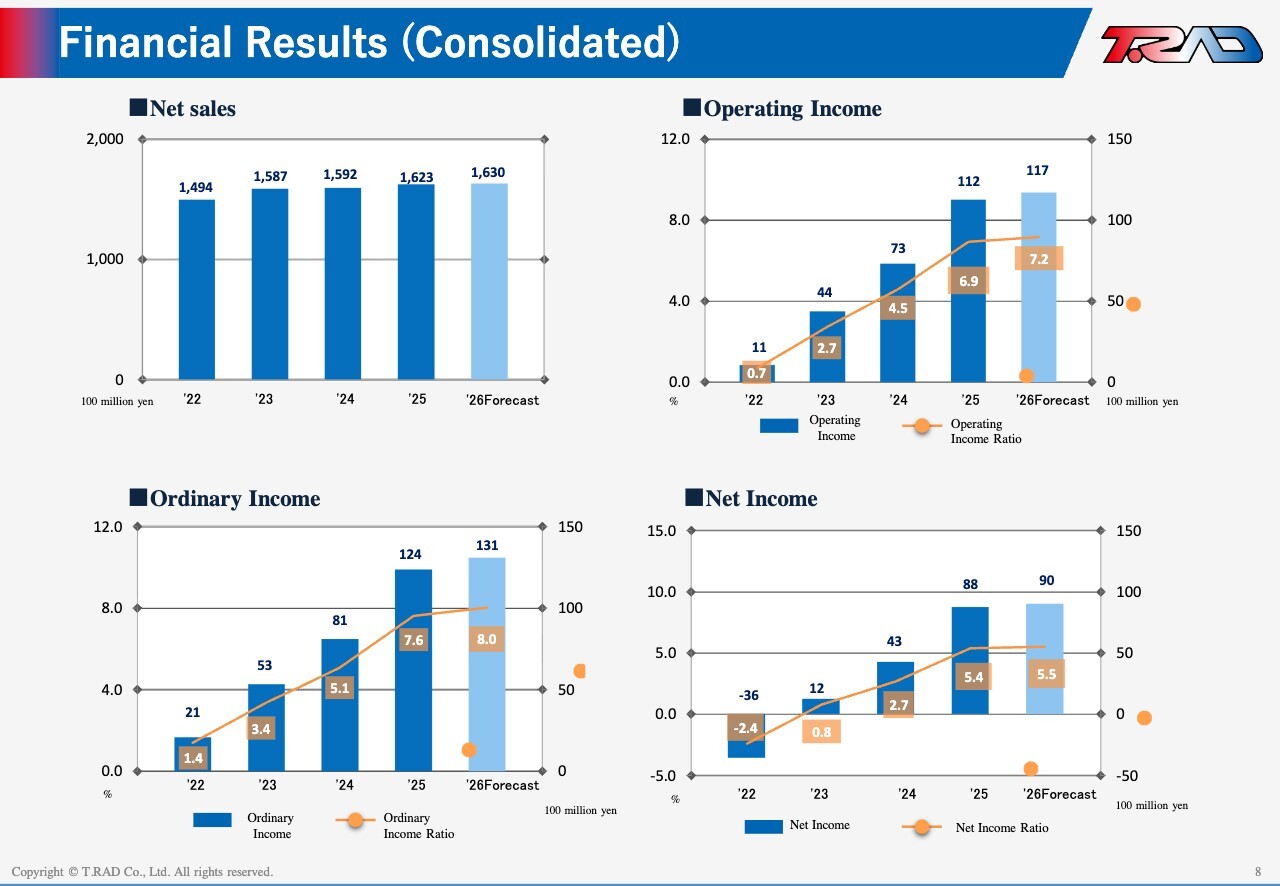
This slide shows the trend in our consolidated performance over time. Profit metrics, including operating income, have continued to trend upward. This reflects our efforts to secure appropriate profit levels through negotiations with customers, as well as the benefits of productivity improvements and cost reduction initiatives. Quality-related costs and bad debt-related expenses also declined.
Financial Results (Non-Consolidated)
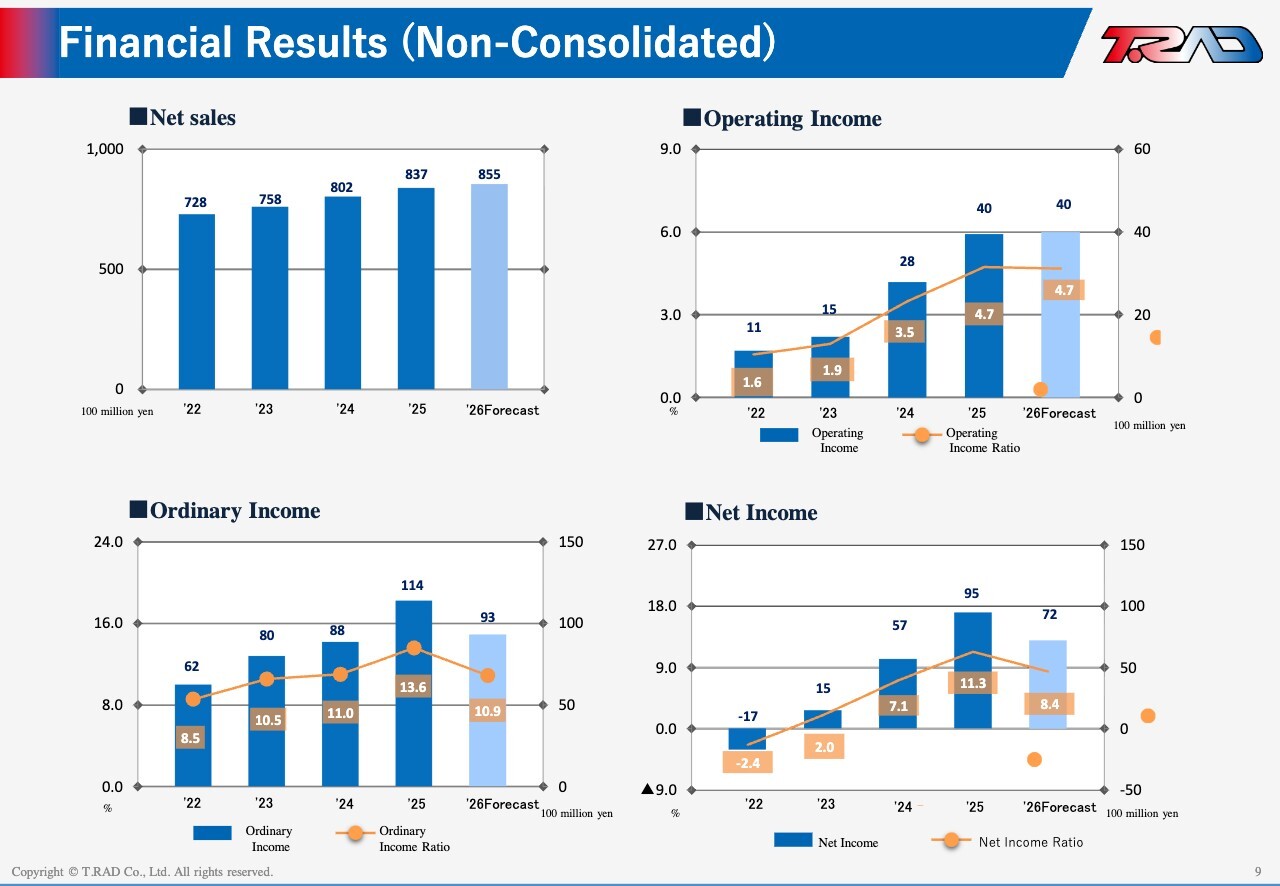
In the domestic segment, sales have remained solid over time, posting a CAGR of approximately 3.5% since FY2022. We also expect sales to increase in FY2026.
Net Sales (Consolidated)
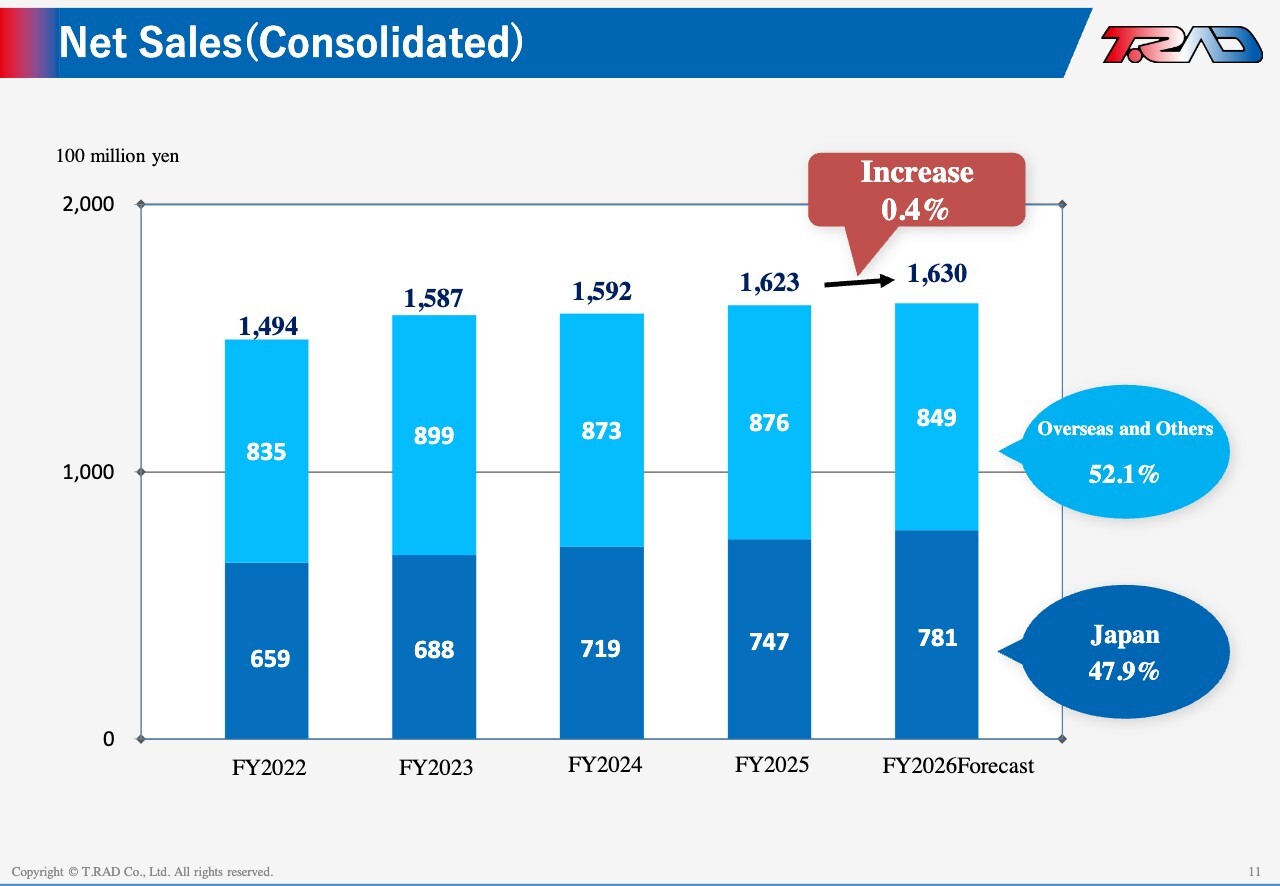
The overseas sales ratio has declined recently, mainly due to lower revenue in China. However, it remains above 50%, underscoring that our global operations are essential to our business.
Sales by Application
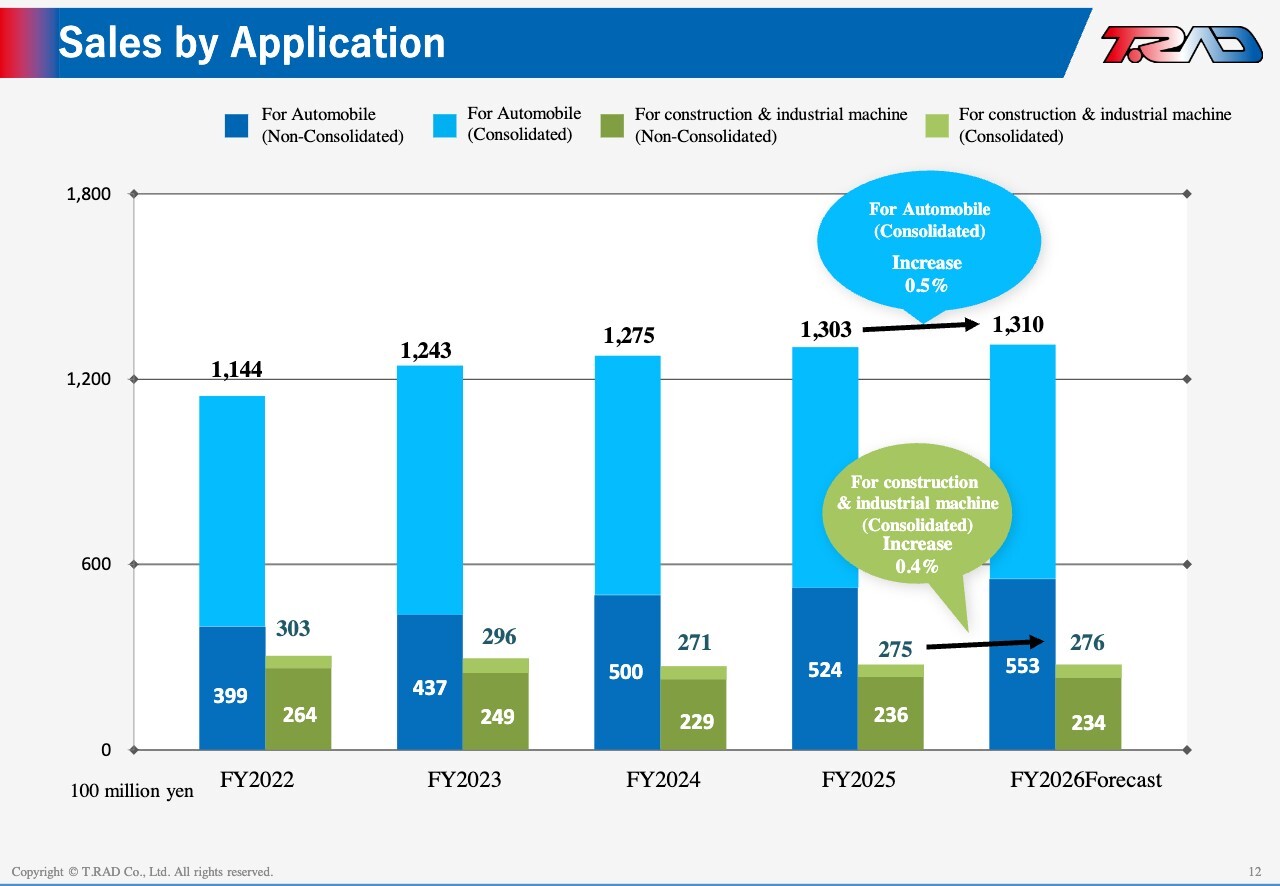
By application, sales to the automotive sector continue to grow, and we expect further revenue growth in FY2026. Sales to construction/industrial/agricultural machinery declined through FY2024 but showed a modest recovery in FY2025. As this segment is closely tied to economic conditions, we continue to monitor it closely.
Sales by Region
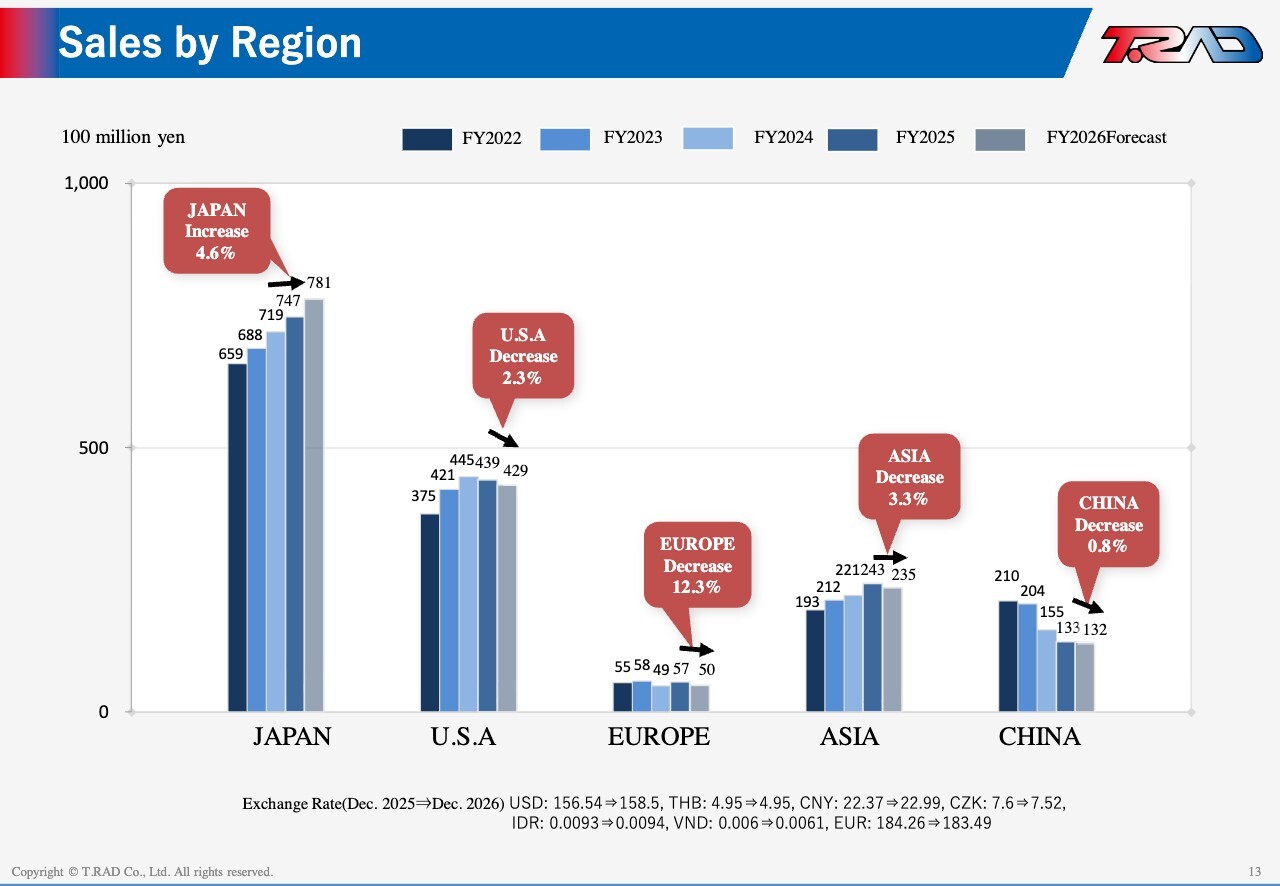
By region, in addition to the ongoing revenue decline in China, we also expect factors that will weigh on revenue in Asia. We will continue to monitor these trends closely.
Operating Income by Region
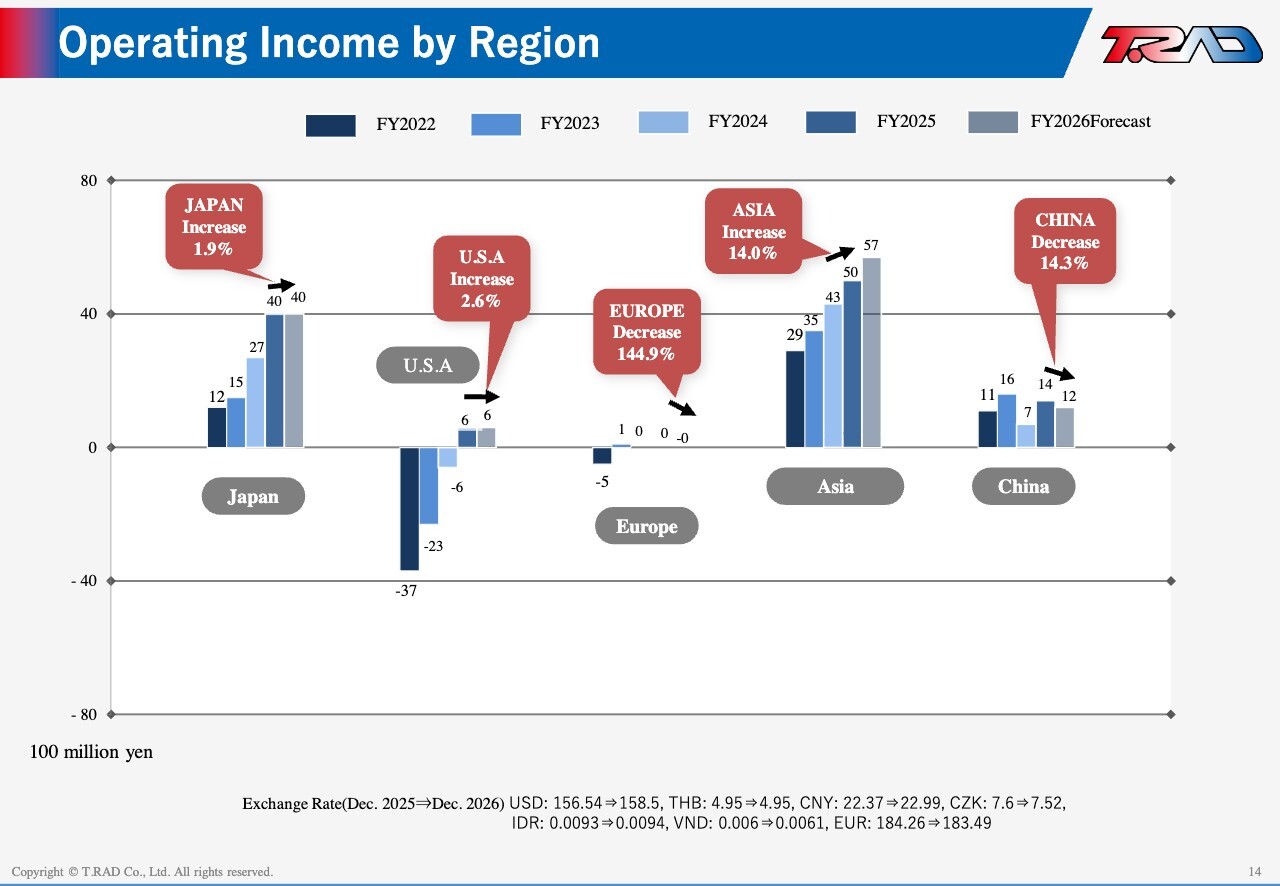
Looking at operating income by region, we can see continued improvement in the U.S., strong profit contributions from Japan and Asia, and sustained profit levels in China.
Analysis of Increase Factor of the Consolidated Ordinary Income (FY3/2026 vs. FY3/2025)

Ordinary income for FY2025 increased by ¥4,277 million year on year. On a non-consolidated basis, the increase was driven by higher sales and lower R&D expenses, as well as the absence of system-related costs recorded in the previous fiscal year. At the same time, depreciation and personnel expenses increased, reflecting stronger investment in facilities and human capital.
At our overseas subsidiaries, the U.S. delivered a particularly strong profit increase, while Asia and China also contributed to earnings growth.
Non-operating Income/Expenses and Extraordinary Income/Loss for FY3/2026 (Consolidated)
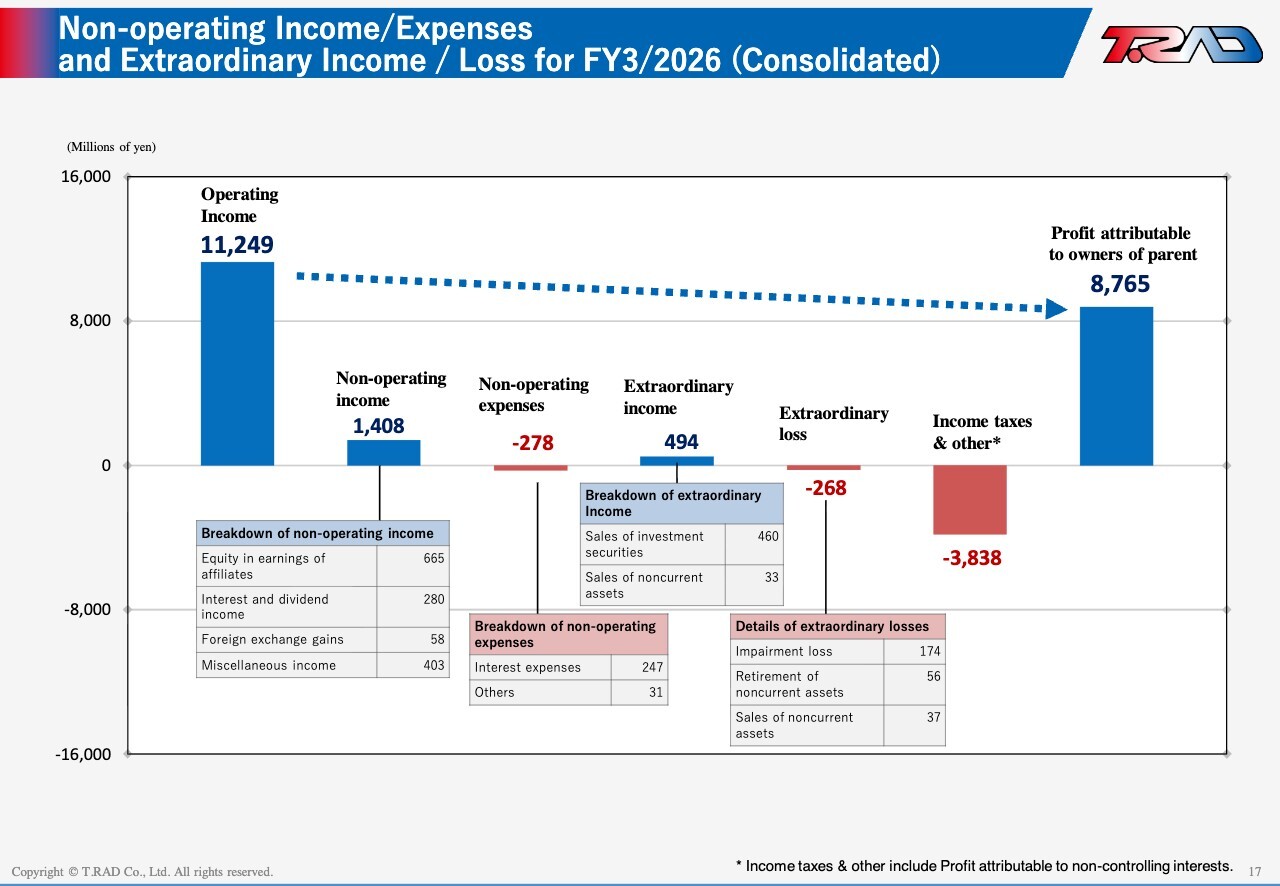
This slide shows the breakdown of non-operating and extraordinary items. We recorded equity in earnings of affiliates of approximately ¥0.7 billion from our joint venture in India, as well as gains on sale of investment securities of approximately ¥0.5 billion. On the other hand, income taxes increased, reflecting stronger earnings.
FY3/2026 Cash Flow Status (Consolidated)
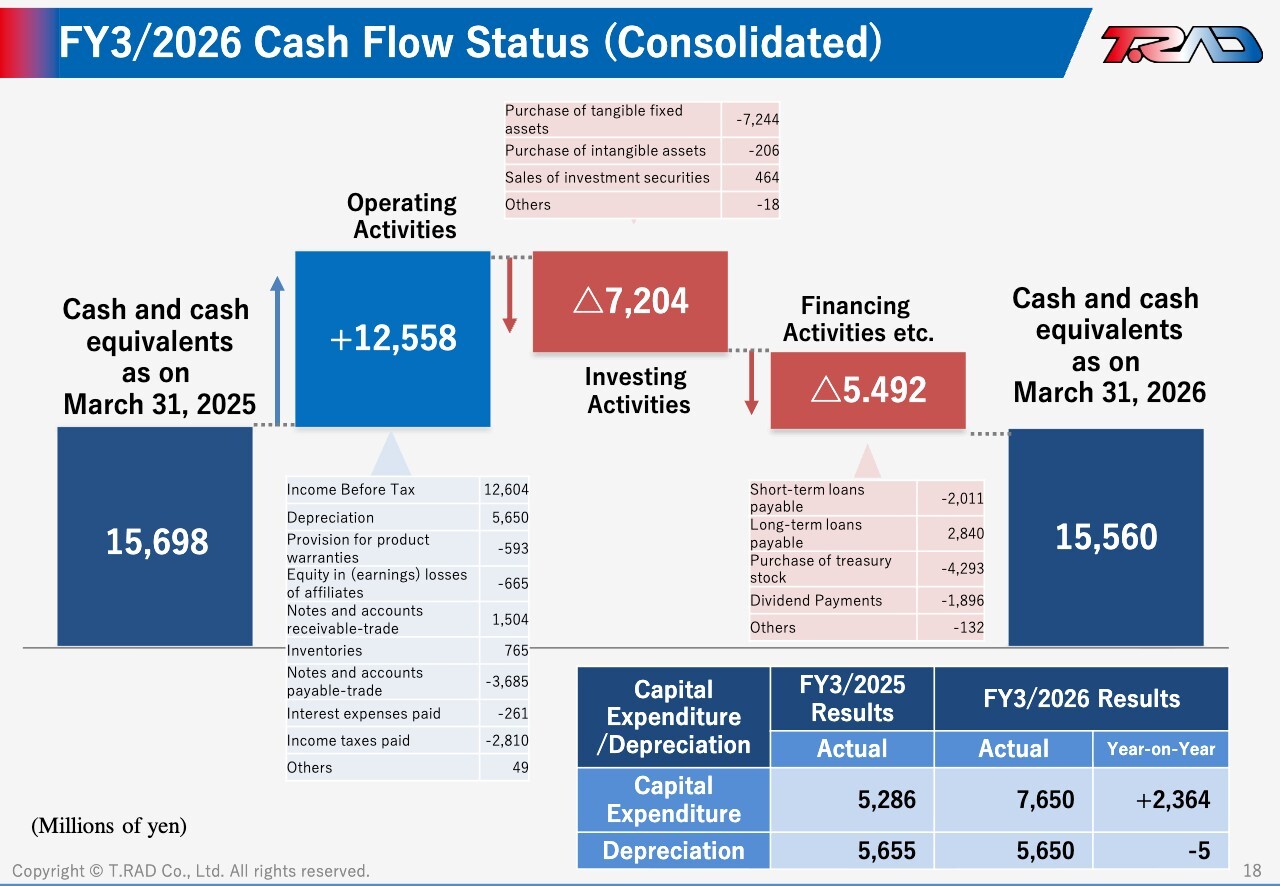
Looking at cash flows, cash flows from operating activities increased significantly. In investing activities, we spent approximately ¥7.4 billion on capital expenditures. In financing activities, we returned approximately ¥6.1 billion to shareholders through share buybacks and dividends. Cash and cash equivalents at the end of the period remained broadly unchanged from the previous fiscal year-end.
Capital Expenditures Depreciation (Consolidated)
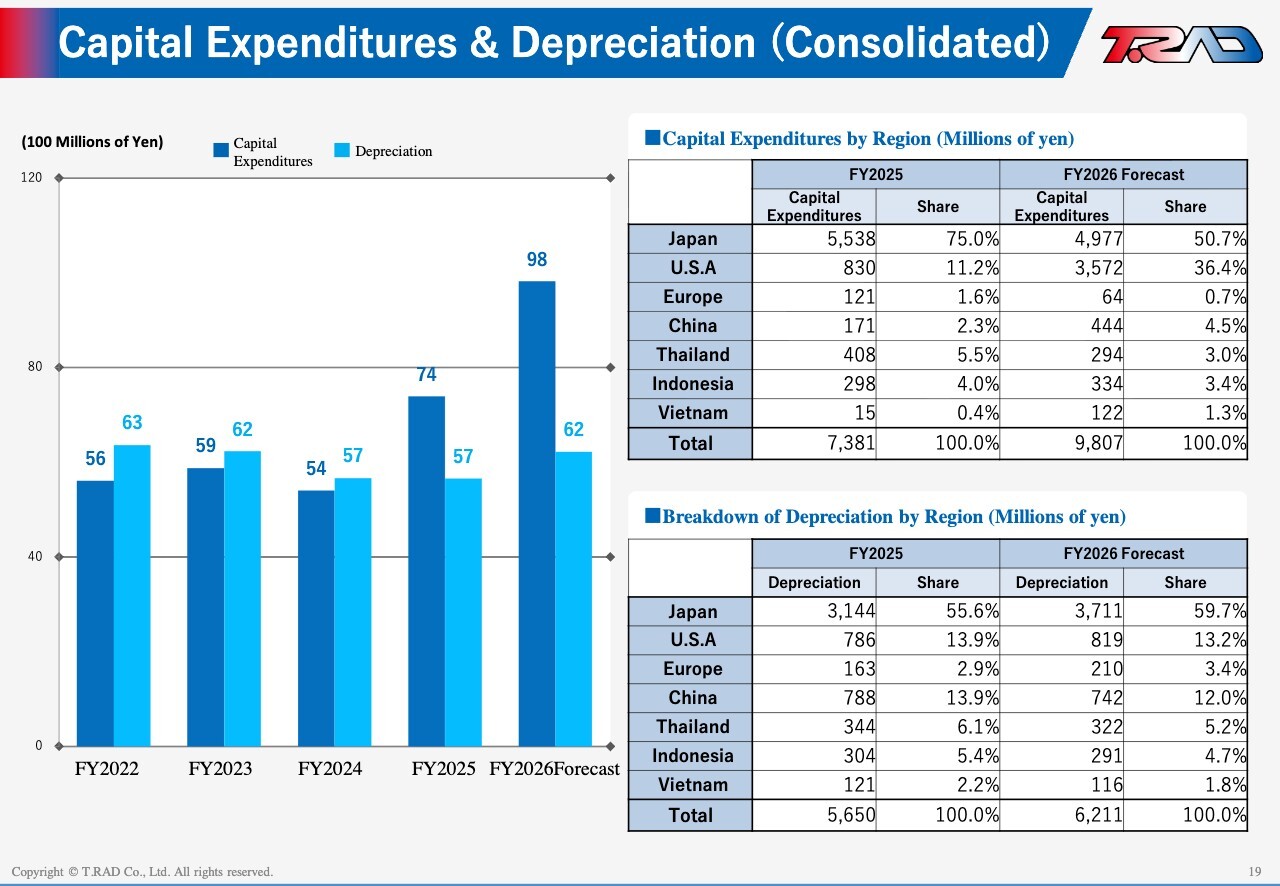
Capital expenditures are on an upward trend as we invest to drive future sales growth and expand market share.
R&D Expenses
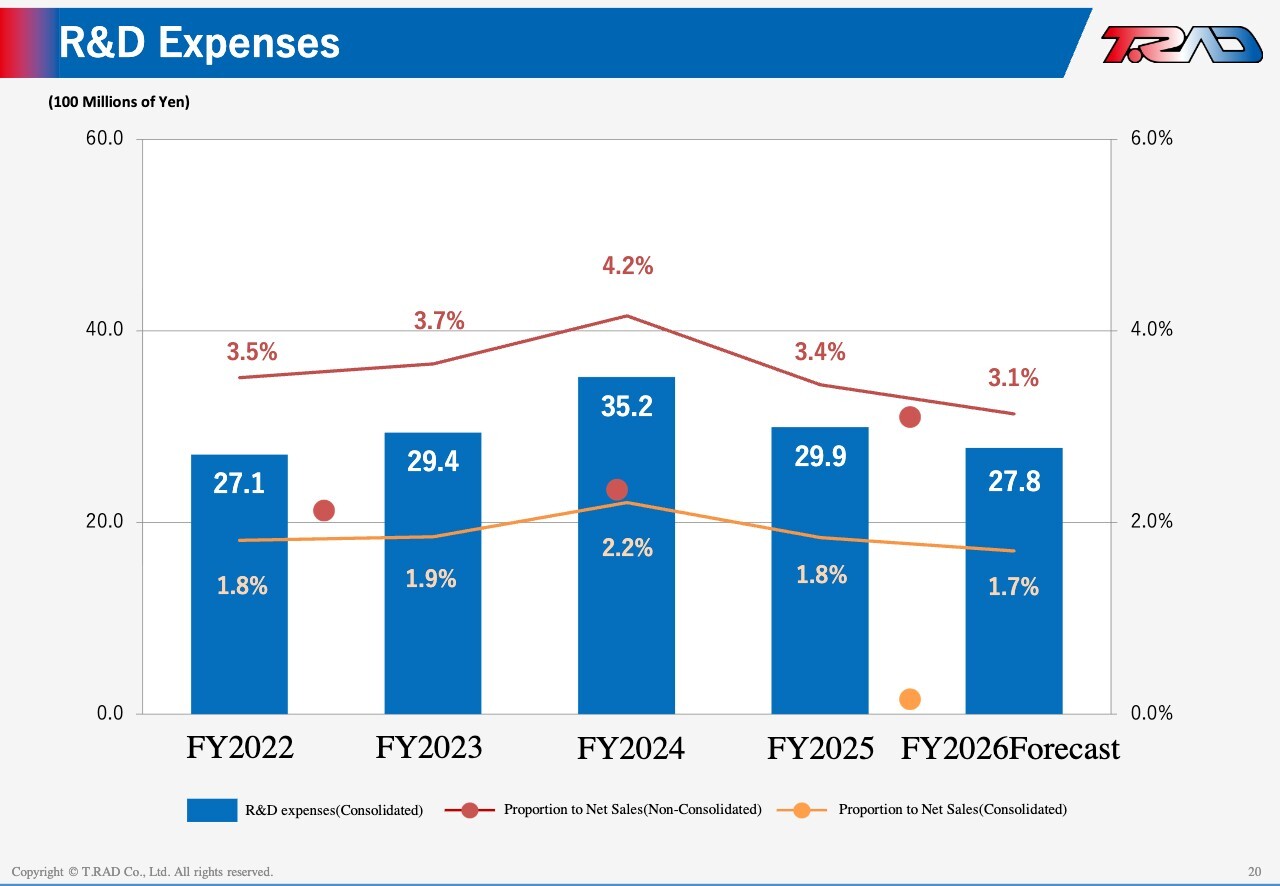
We focused R&D spending on development for HEV and PHEV applications, as well as system development. In FY2025, R&D expenses totaled approximately ¥3.0 billion, or about 3.4% of net sales. We expect R&D spending of approximately ¥2.8 billion in FY2026.
This concludes my presentation of the full-year results for FY2025.
Mid-Term Management Plan T.RAD-2026
Mr. Tomio Miyazaki (“Miyazaki”): I am Miyazaki, President, CEO and COO. I will present our Mid-Term Management Plan, T.RAD-2026.
T.RAD-2026 Management Philosophy, Corporate Slogan, and Management Strategy
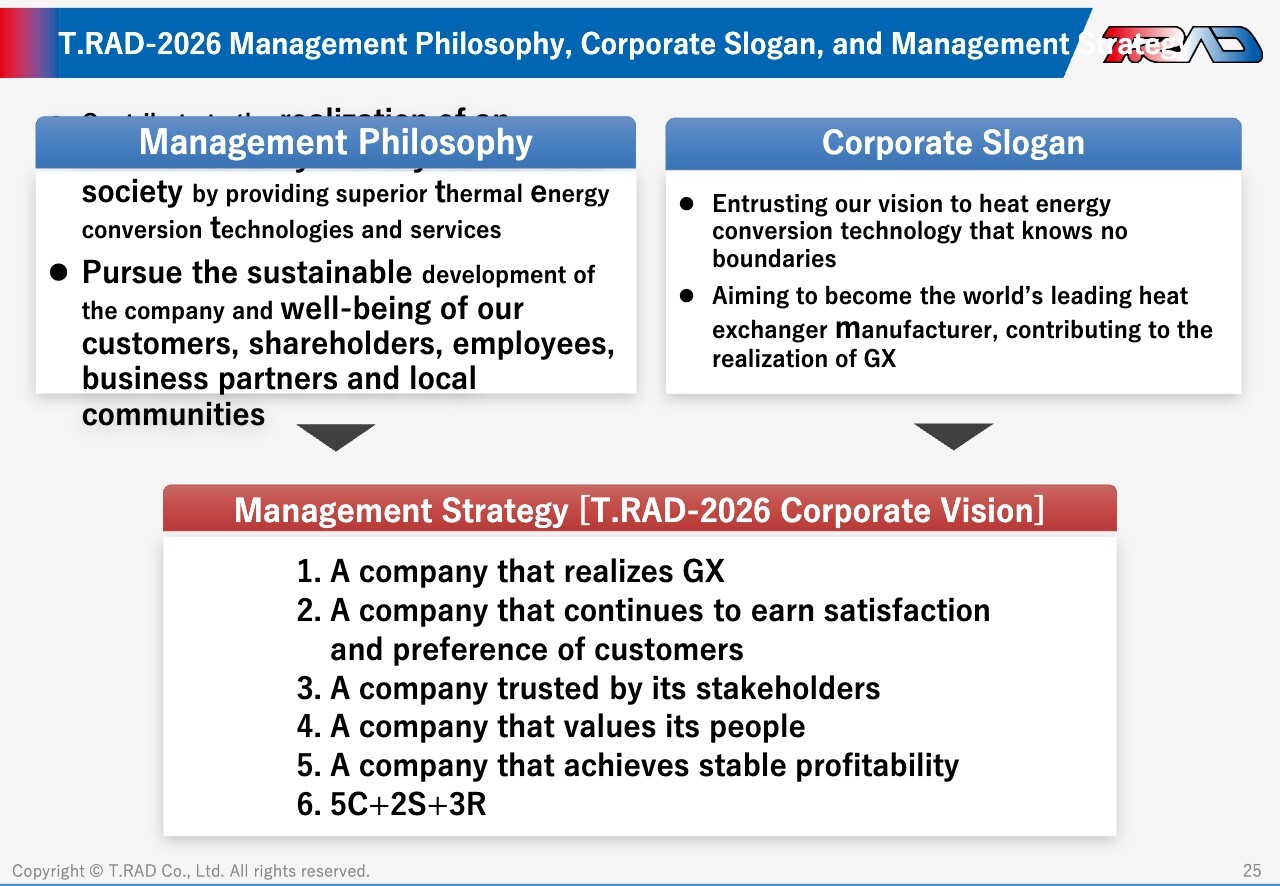
First, let me outline our management philosophy and corporate slogan. Our management philosophy is to contribute to the realization of an environmentally friendly sustainable society by providing superior thermal energy conversion technologies and service. Our corporate slogan is to entrust our vision to heat energy conversion technology that knows no boundaries and aim to become the world’s leading heat exchanger manufacturer, contributing to the realization of Green Transformation (GX).
Next, our vision is built around five pillars: becoming a company that realizes GX, continues to earn satisfaction and preference of customers, is trusted by its stakeholders, values its people, and achieves stable profitability. We frame this vision under the concept of “5C + 2S + 3R.”
What is T.RAD-2026 5C+2S+3R?
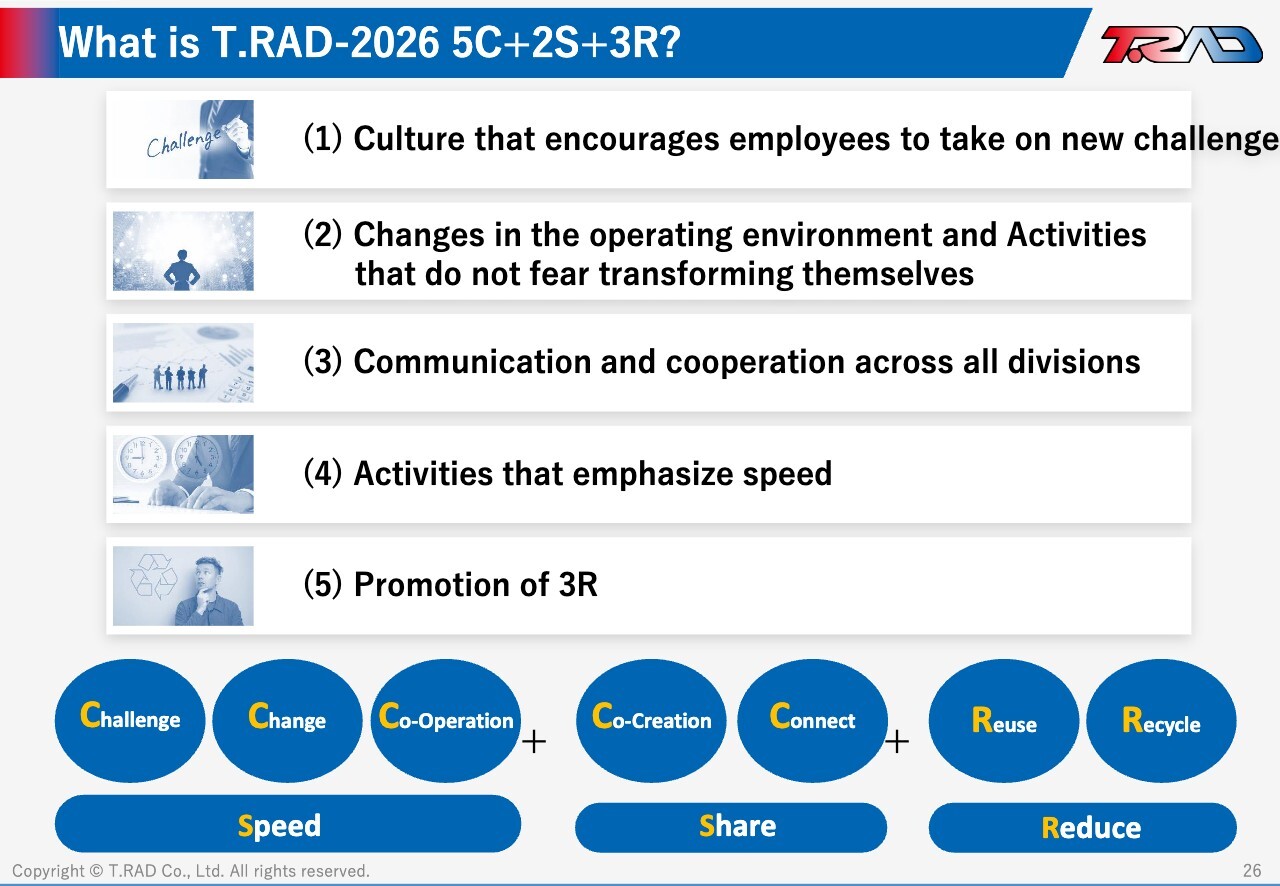
So, what do we mean by “5C + 2S + 3R”? It refers to a set of keywords: Challenge, Change, Co-Operation, Co-Creation, Connect, Speed, Share, Reduce, Reuse and Recycle.
FY 2025 (FY3/2026) Results
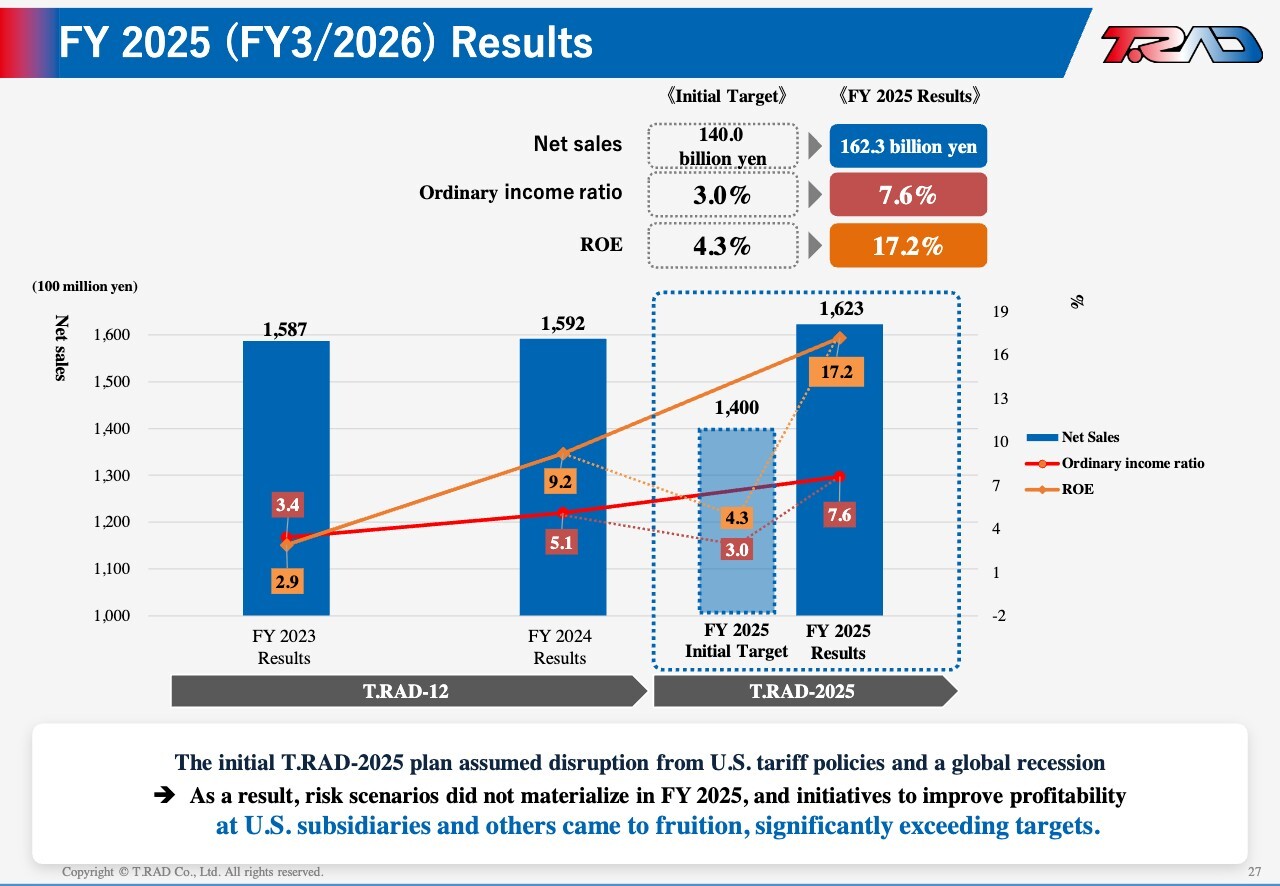
Next, let me review our FY2025 performance. Our initial plan for FY2025 targeted net sales of ¥140.0 billion and an ROE of 4.3%. At the time, we assumed potential disruption from U.S. tariff policies and a global recession. In reality, those risks did not materialize. We delivered record-high net sales and profits, and ROE reached 17.2%. As a result, we achieved our original FY2030 ROE target of 15% five years ahead of schedule.
T.RAD-2025 FY2025 Factors for Increase in Net Income
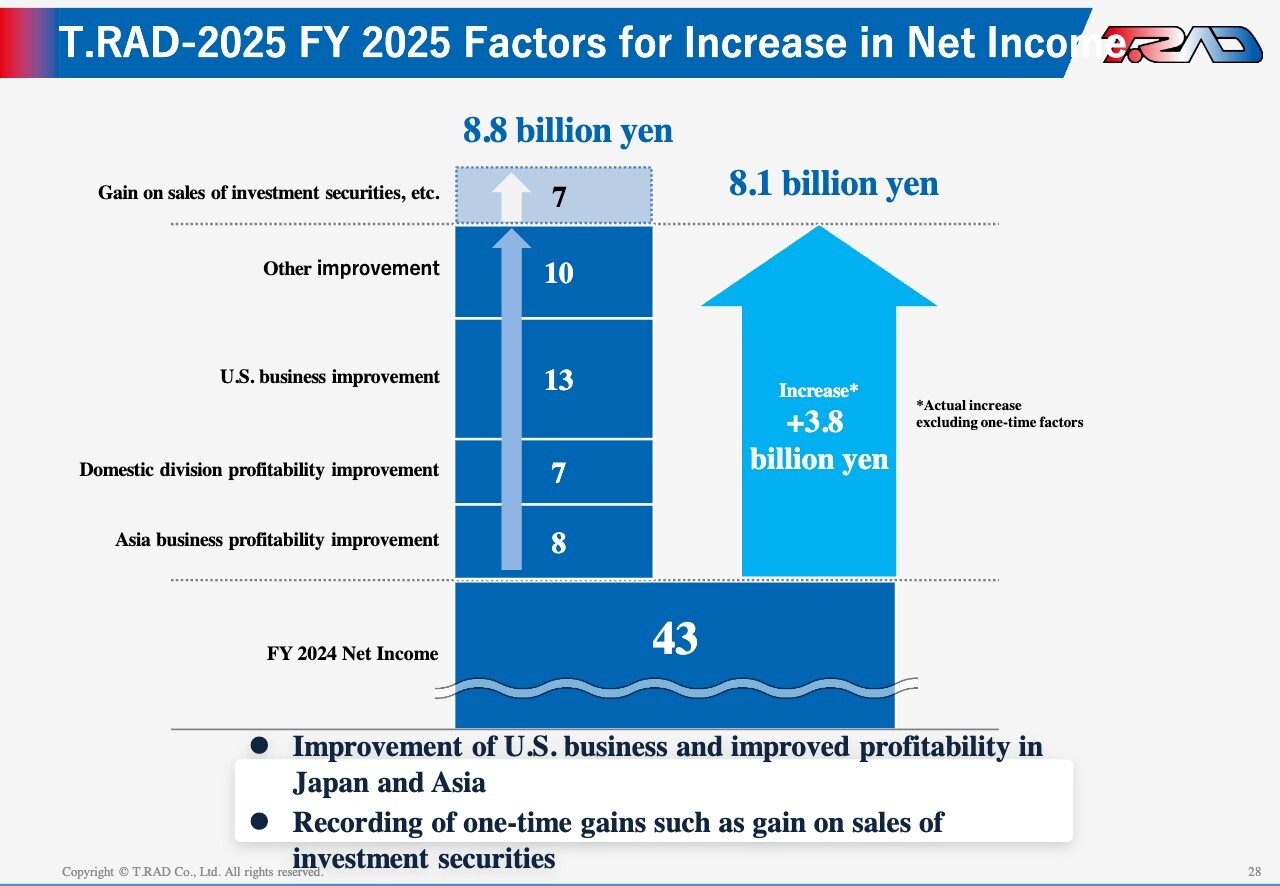
Turning to profit, net income increased by approximately ¥3.8 billion compared with FY2024, excluding one-time factors, driven by improved profitability in Asia and Japan, as well as improvement in the U.S. business. In addition, we recorded one-time gains of approximately ¥0.7 billion from the sale of investment securities, bringing total net income to ¥8.8 billion.
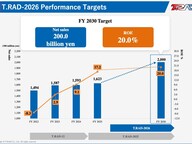
T.RAD-2026 Performance Targets
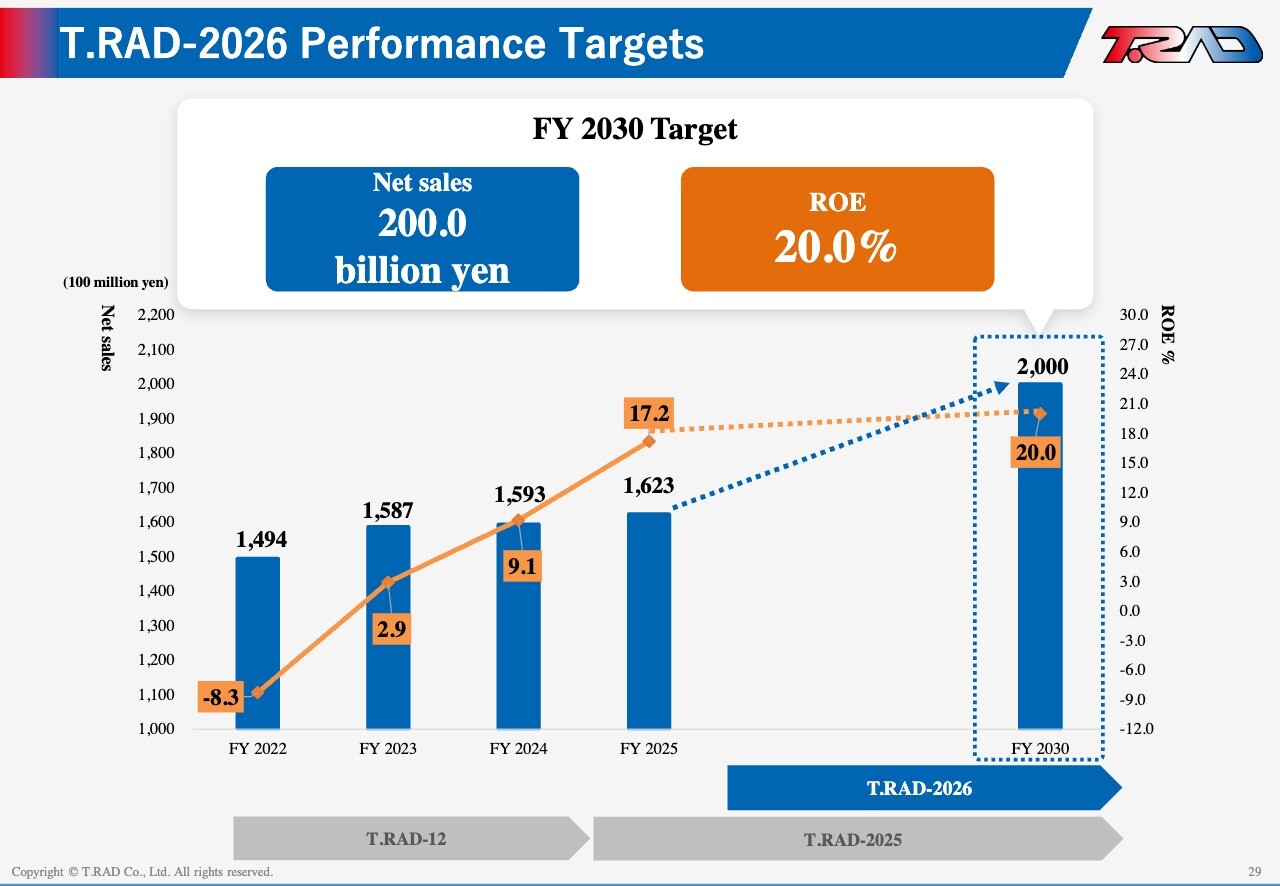
Under our new Mid-Term Management Plan, T.RAD-2026, we have reset our FY2030 targets to net sales of ¥200.0 billion and ROE of 20%, raising the ROE target from the previous 15%.
FY2026 Forecasts and FY2030 Performance Image
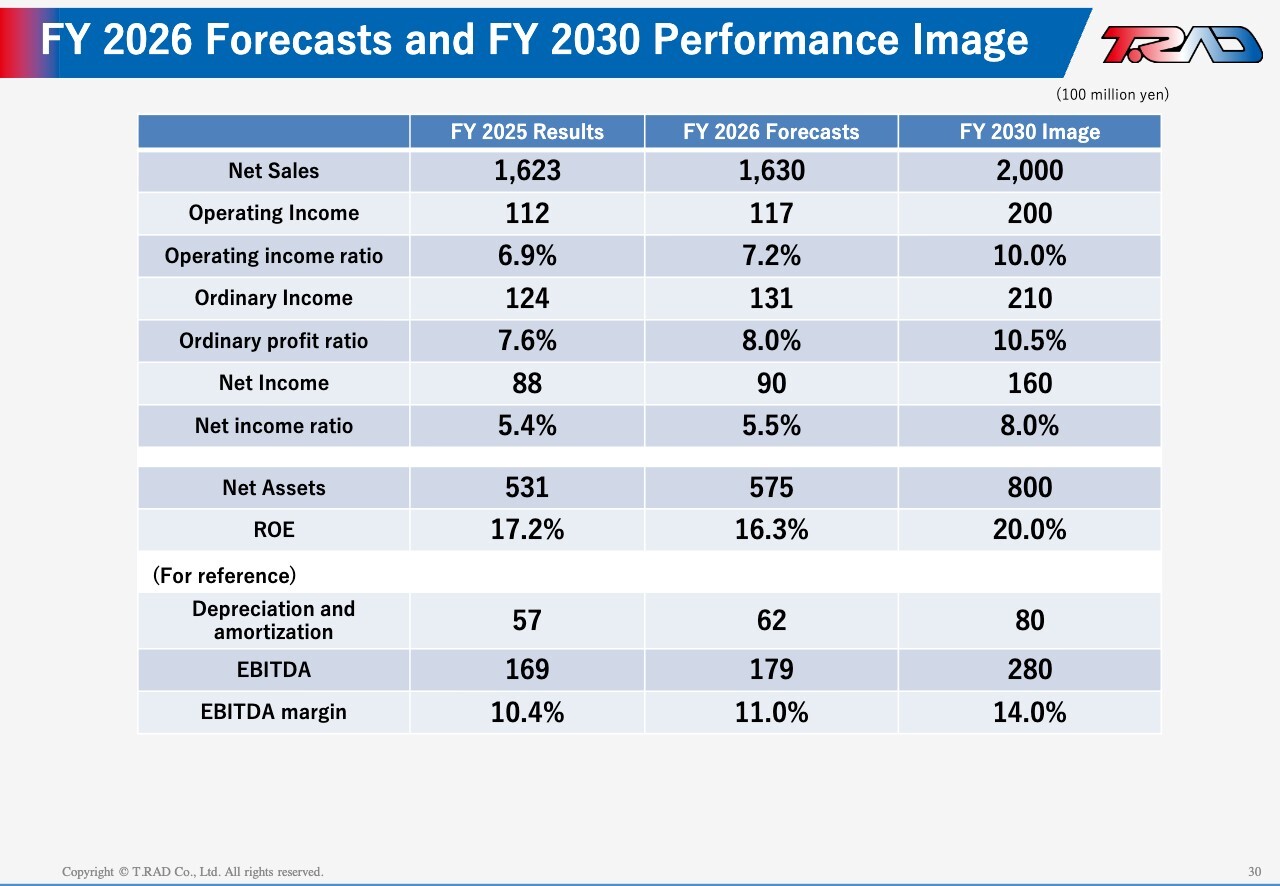
This slide shows our FY2030 performance targets. We aim to deliver net sales of ¥200.0 billion, operating income ratio of 10%, operating income of ¥20.0 billion, and net income of ¥16.0 billion.
T.RAD-2026 Basic Strategies
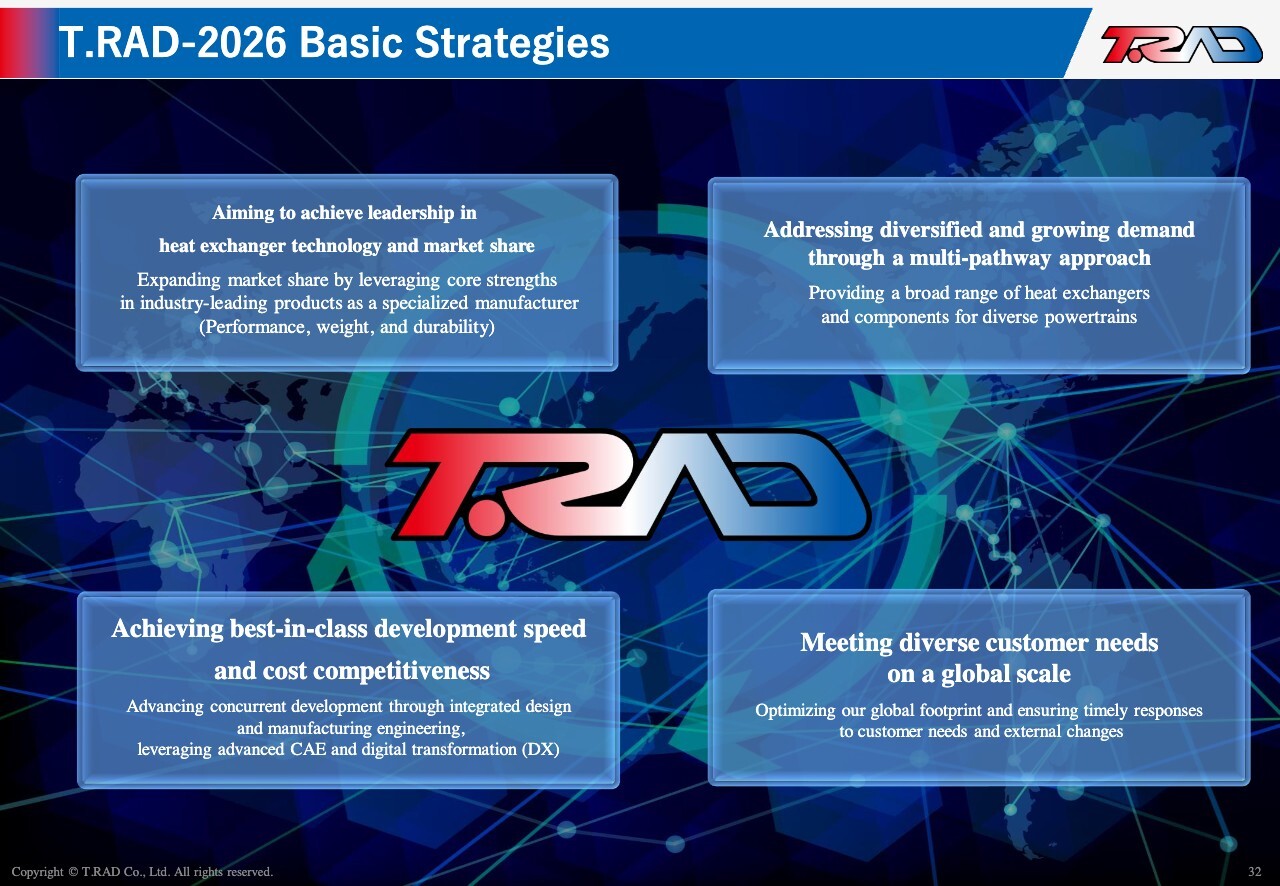
Next, let me outline our key strategic initiatives. As a specialized heat exchanger manufacturer, we will leverage our core strengths to expand the supply of industry-leading products. At the same time, we will provide a broad range of heat exchanger products compatible with diverse powertrains, positioning ourselves to capture increasingly diversified demand driven by the shift toward a multi-pathway approach.
We will also pursue best-in-class development speed and cost competitiveness by integrating design and production through concurrent development and leveraging simulation-based engineering methods. In addition, we will optimize our global footprint in line with customer needs and market conditions, enabling timely responses worldwide.
Our Heat Exchanger Products and Competitive Advantages
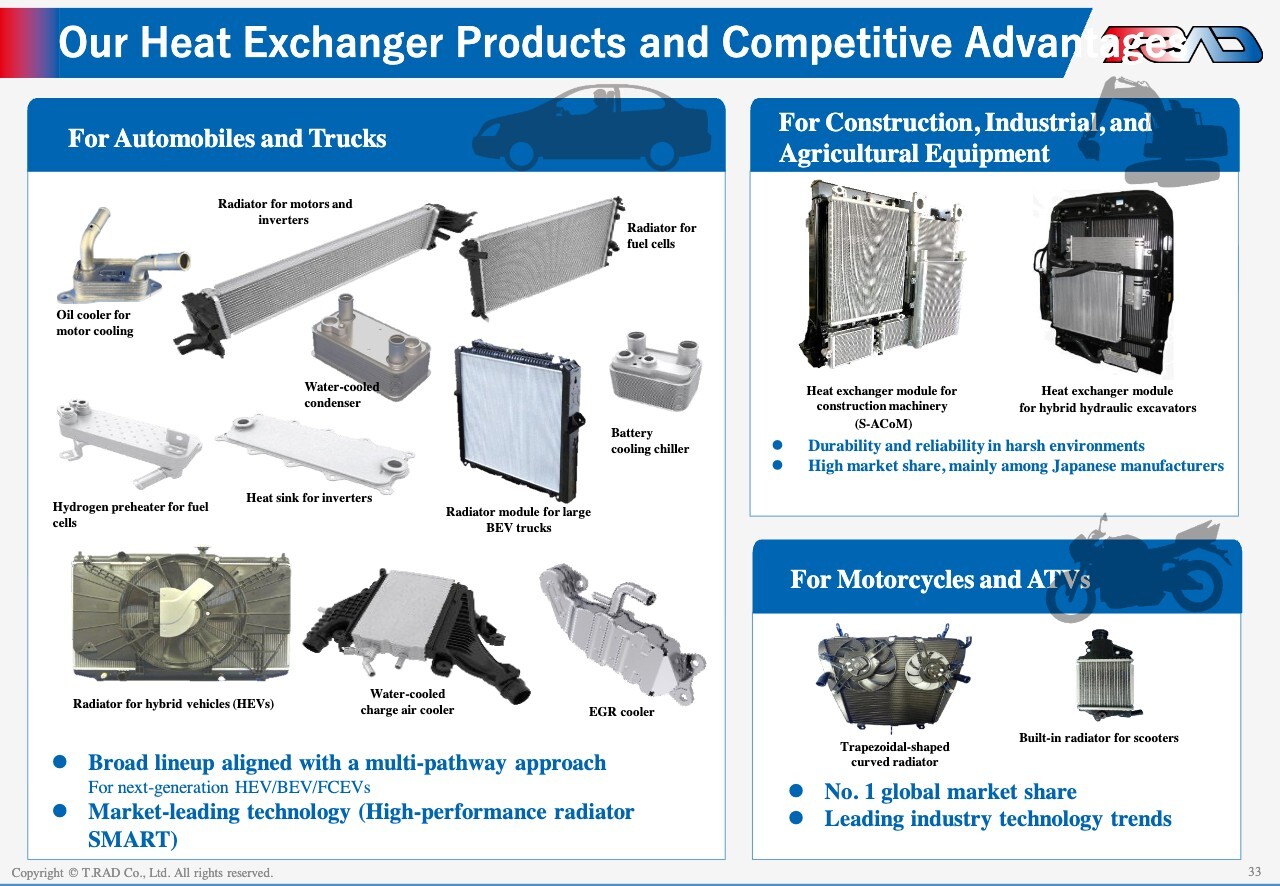
Let me highlight our heat exchanger portfolio. For automobiles and trucks, we offer a wide range of heat exchanger products and lead the market with a broad lineup designed to support a multi-pathway approach. In construction and agricultural machinery, we hold a strong market position—particularly among Japanese manufacturers—supported by the durability and reliability of our products in harsh operating environments. In motorcycles and ATVs, we have achieved the No.1 global market share.
Strong Customer Base Independent of Any Specific Group
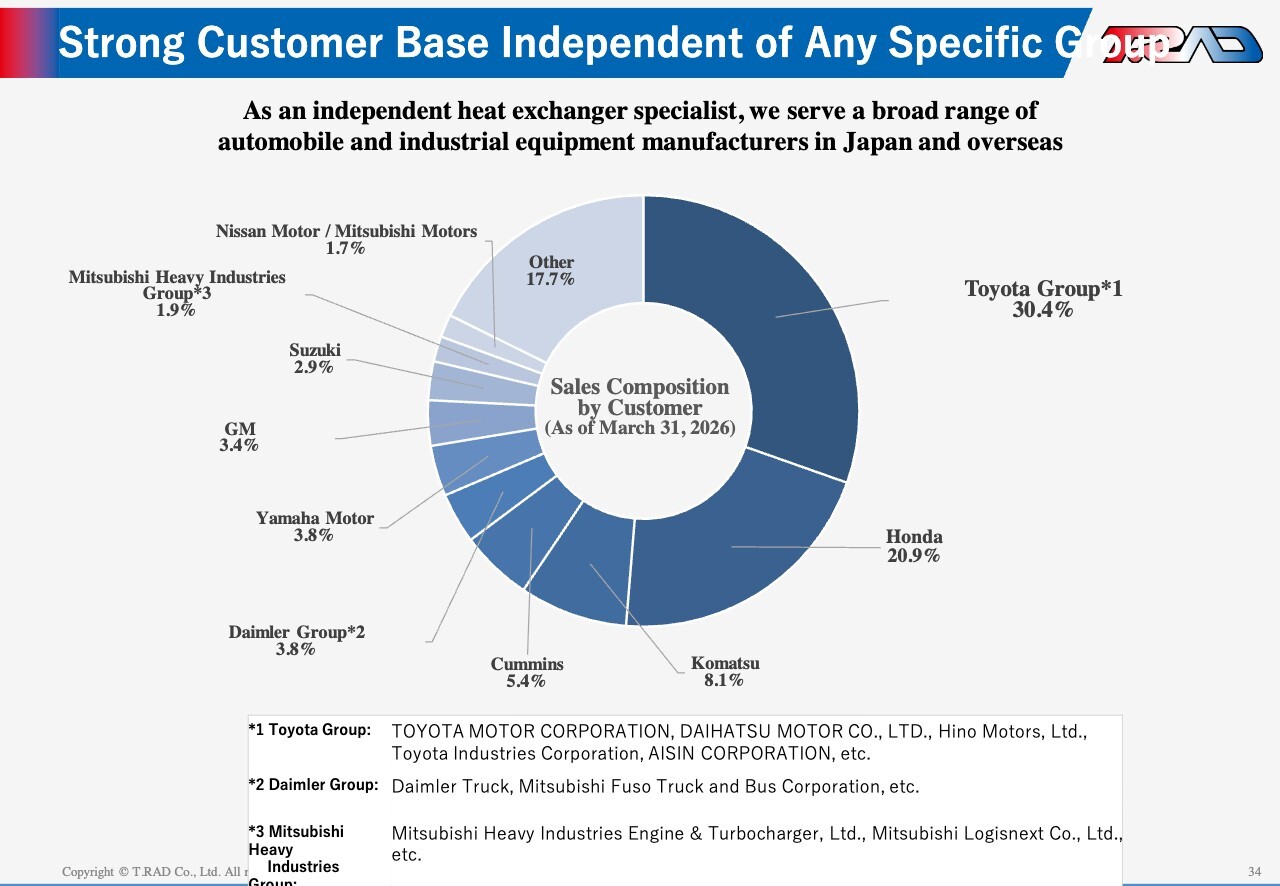
We maintain an independent customer base, not tied to any specific corporate group, and serve a broad range of automobile and industrial equipment manufacturers, including Toyota, Honda, and Komatsu, among others.
Strong Customer Base Independent of Any Specific Group
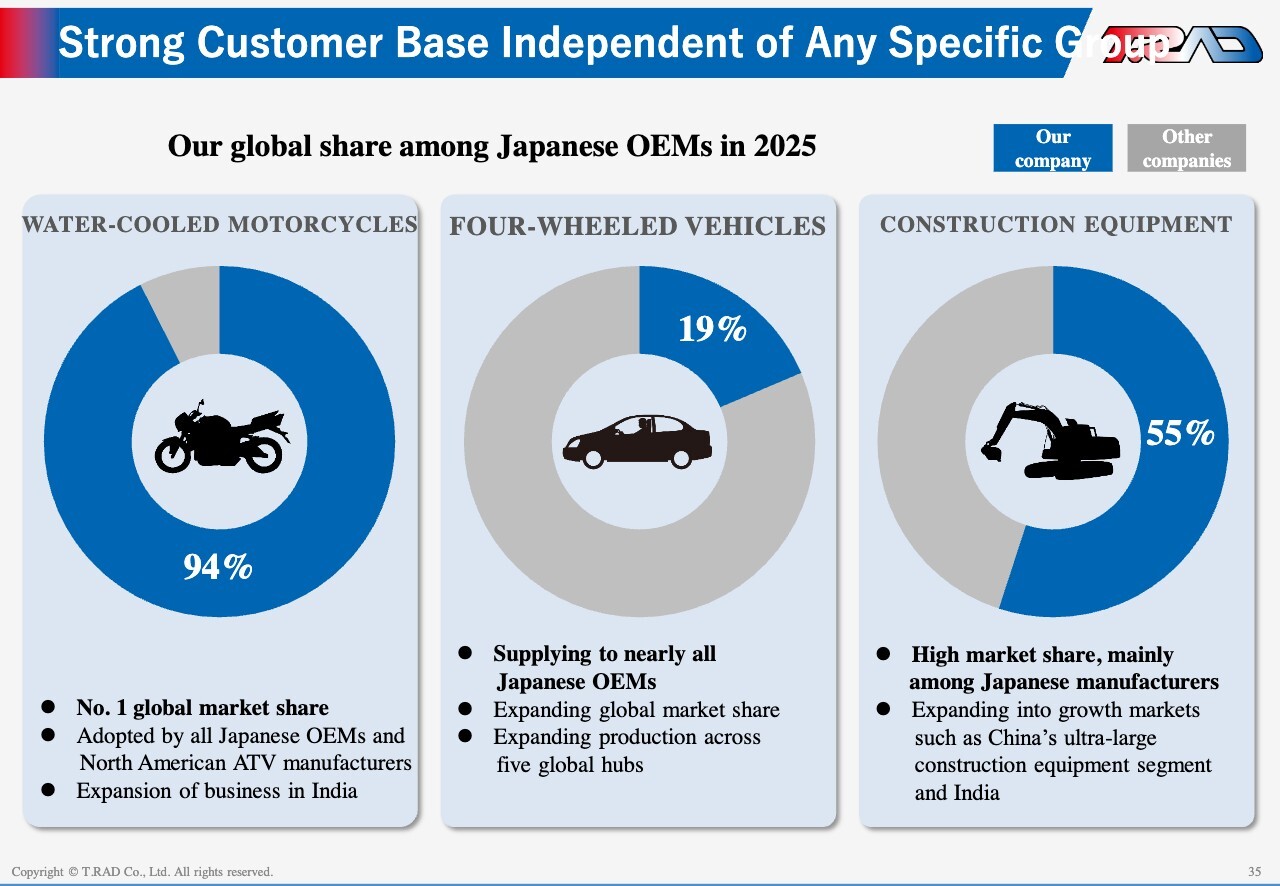
Our global market share among Japanese OEMs is approximately 94% in motorcycles, 19% in four-wheeled vehicles, and 55% in construction equipment.
Global Trends Toward a Multi-Pathway
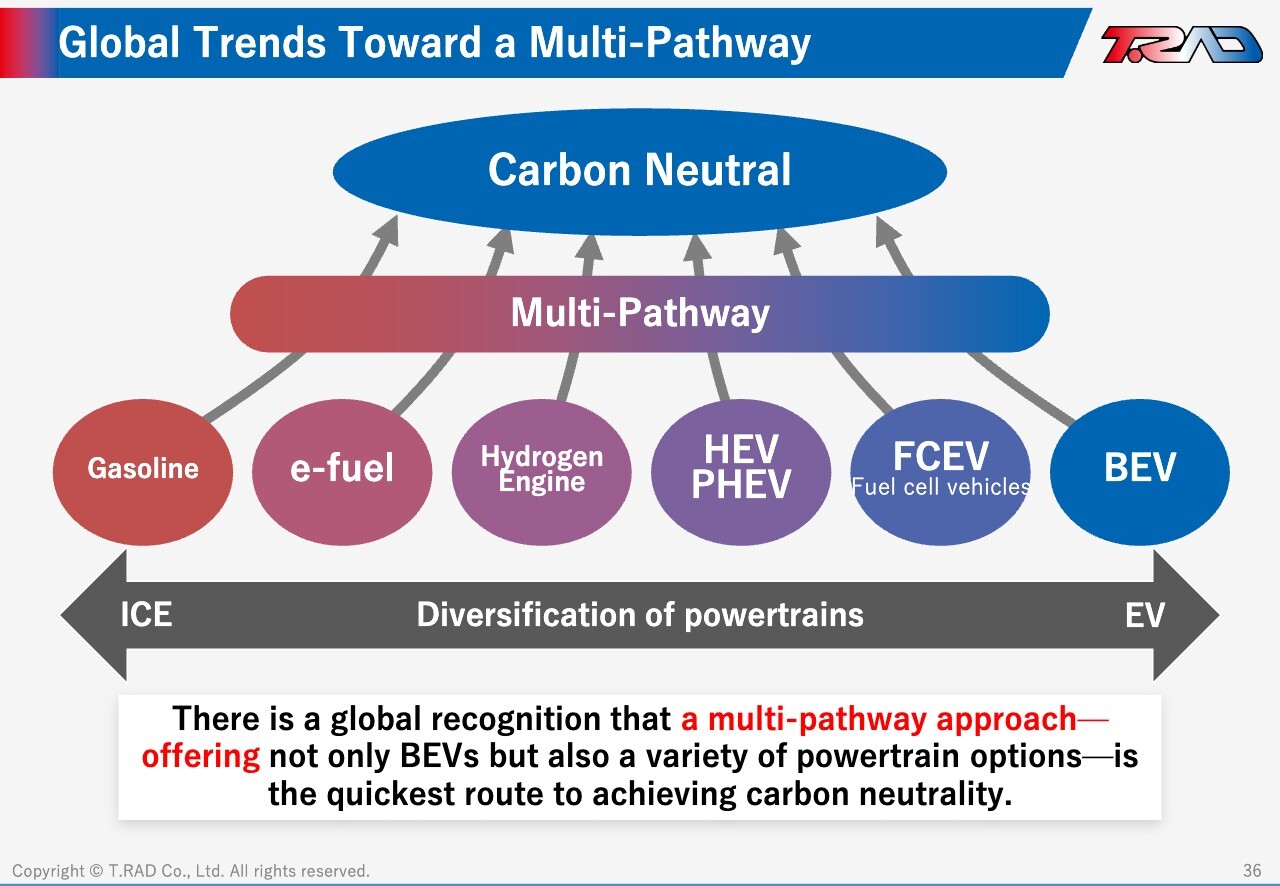
Next, let me address how we are responding to the diversification and expansion of demand driven by the shift toward a multi-pathway approach.
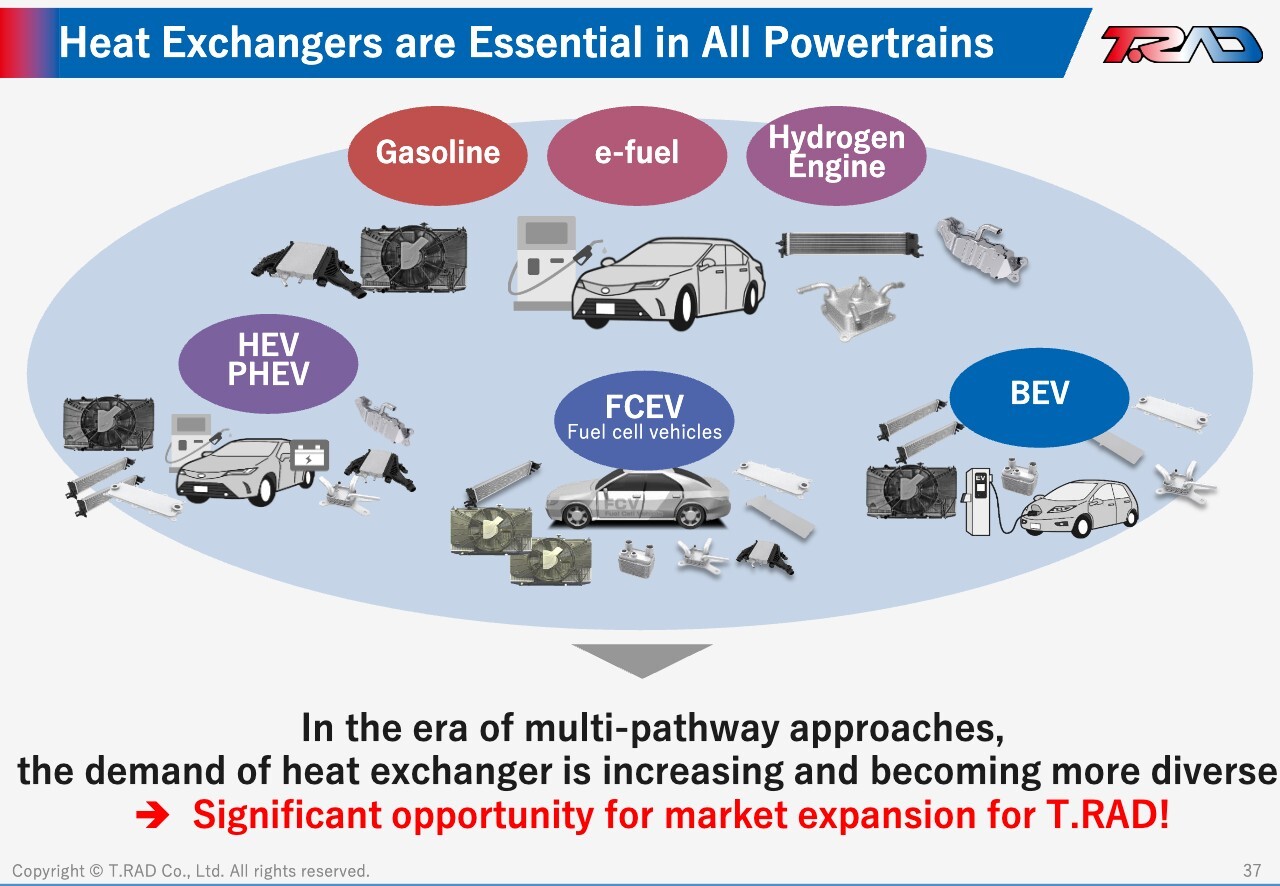
Today, the industry is moving toward a multi-pathway approach. As the pace of BEV adoption moderates, the coexistence of multiple powertrains—not just full electrification—is increasingly seen as the most practical route to carbon neutrality. In this context, heat exchangers are required across all powertrains, including gasoline vehicles, hybrids, plug-in hybrids, battery electric vehicles, and fuel cell vehicles. As a result, we see this shift as a significant opportunity to further expand demand for our products.
Impact of Vehicle Electrification on Heat Exchanger Demand
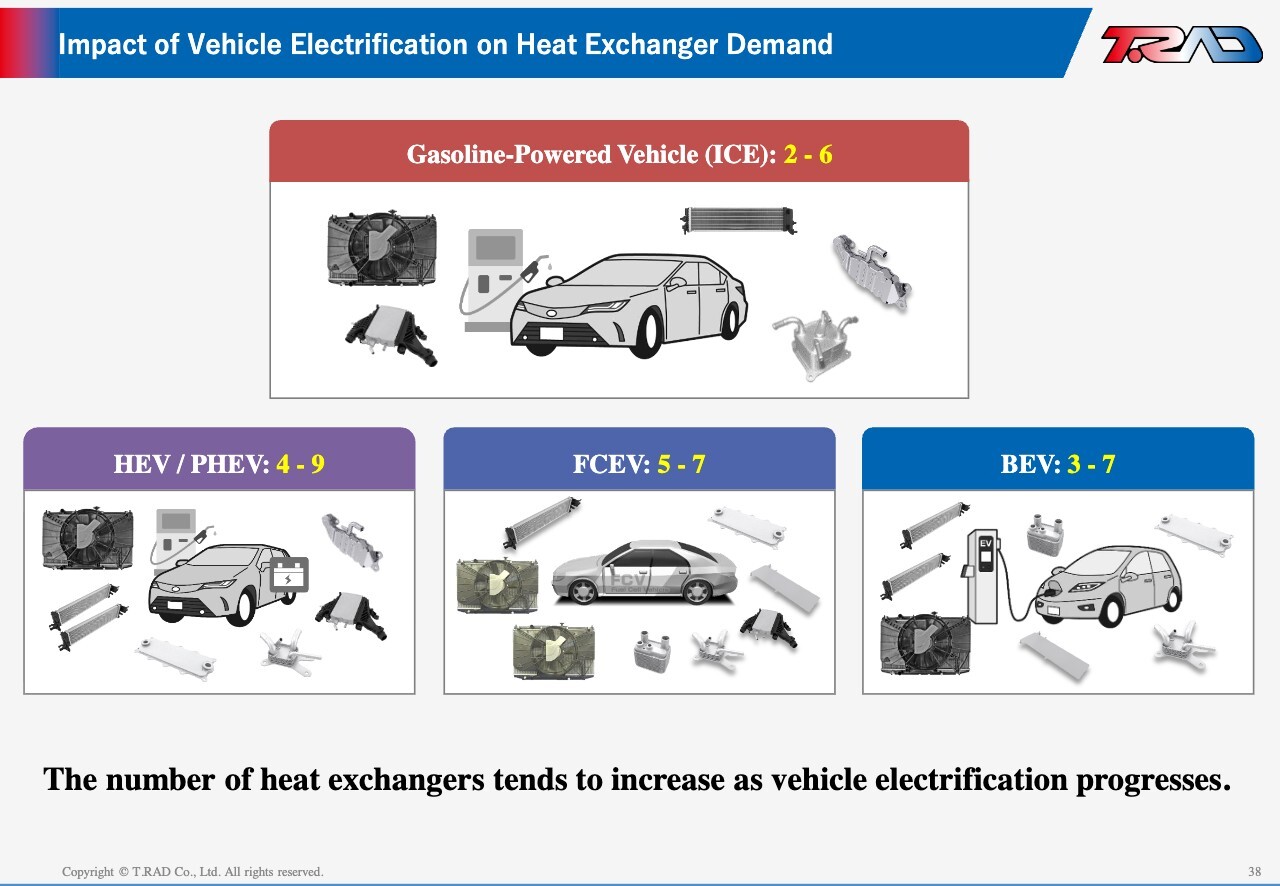
The number of heat exchangers per vehicle increases with electrification. Gasoline vehicles typically use 2 to 6 units, while hybrids use 4 to 9 units, and battery EVs use 3 to 7 units. In other words, as electrification advances, the number of heat exchangers installed per vehicle tends to rise.
Reference: Heat Exchanger Types and Layout
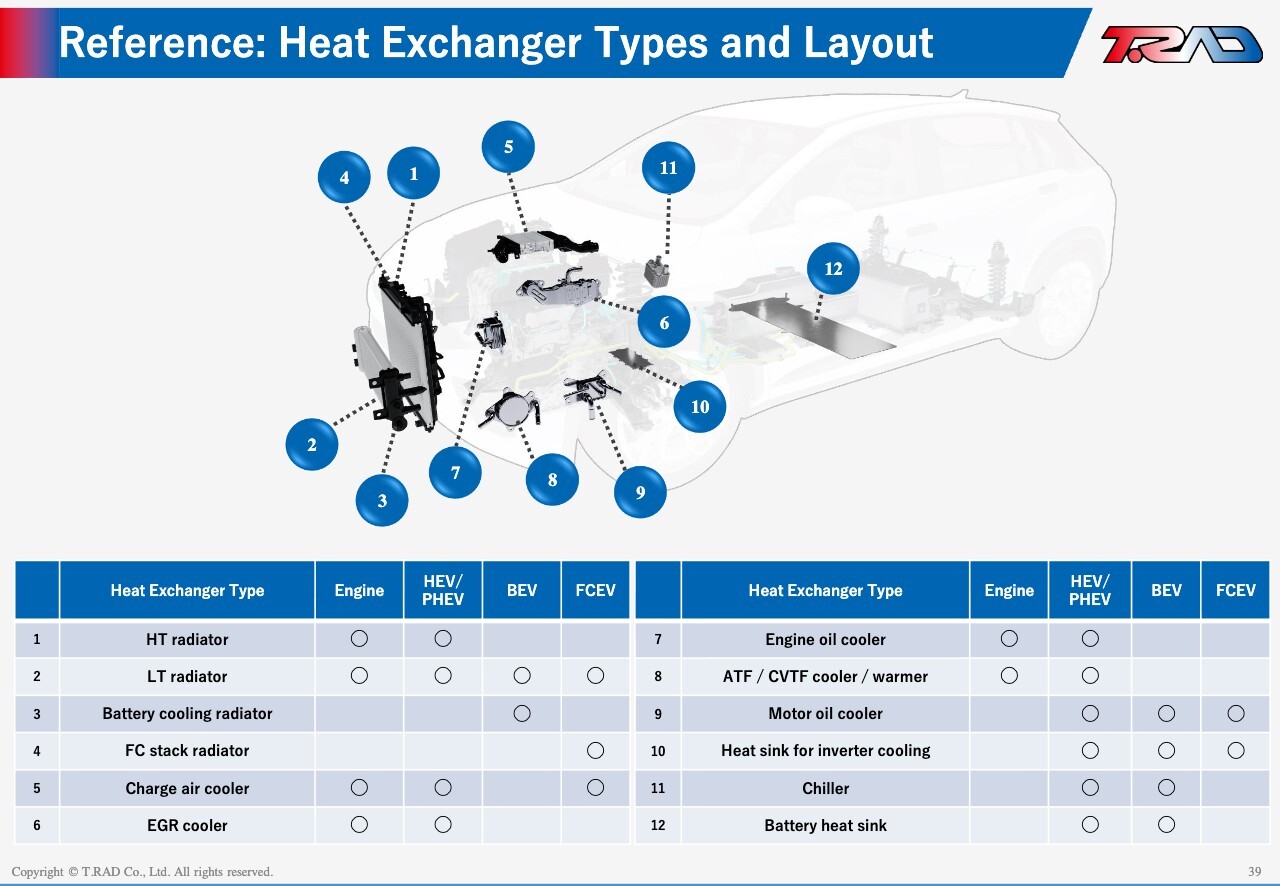
The range of heat exchangers installed is extensive. It includes high-temperature and low-temperature radiators, battery cooling radiators, fuel cell stack radiators, charge air coolers, EGR coolers, engine oil coolers, transmission coolers, motor coil coolers, inverter heat sinks, and battery heat sinks.
T.RAD’s Technological Advantages
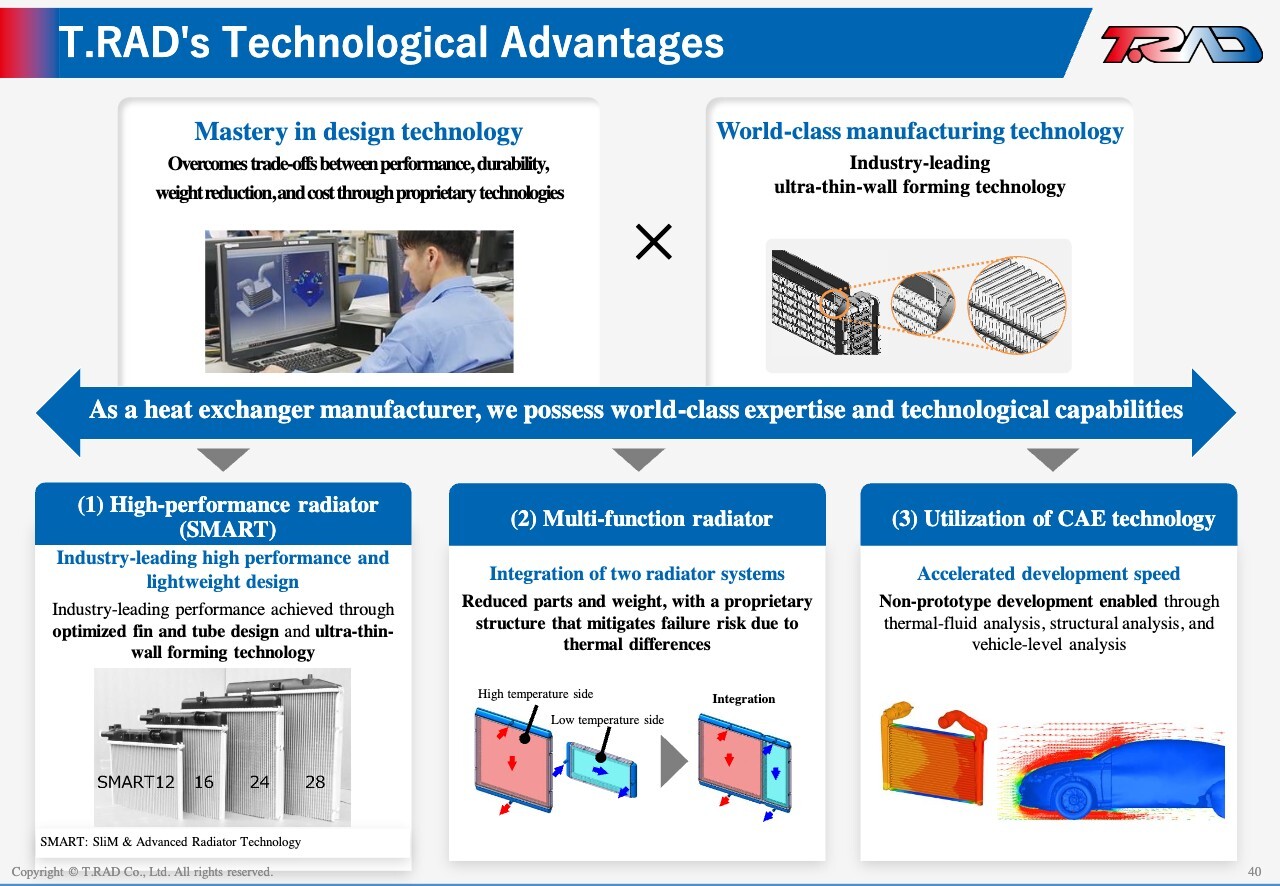
Our technological advantage lies in proprietary design capabilities that overcome trade-offs among performance, durability, weight, and cost, together with industry-leading ultra-thin-wall processing and manufacturing technologies. These strengths enable us to deliver high-performance, lightweight radiators and advanced multi-function radiators. In addition, by leveraging advanced simulation and analysis technologies, we significantly enhance development speed and efficiency.
Global Order Status of Multi-Function Radiator for Multi-Pathway Strategy
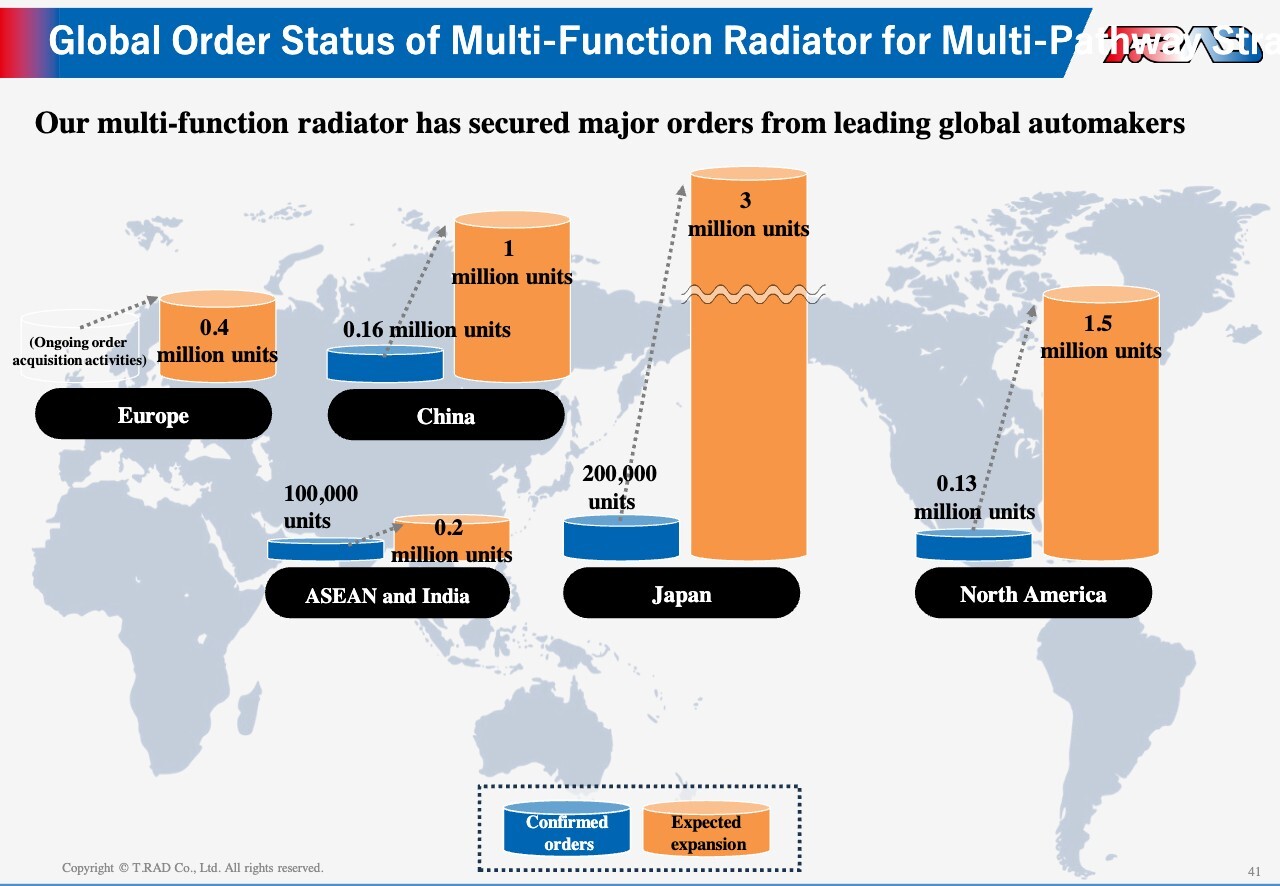
For multi-function radiators, we have already secured large-scale orders from major global automakers. Looking ahead to 2035, we estimate a market potential of approximately 6.1 million units across Japan, North America, ASEAN, China, and Europe. We are steadily building our order pipeline in each region and advancing preparations to capture this opportunity.
Sales Forecast by Category and Powertrain
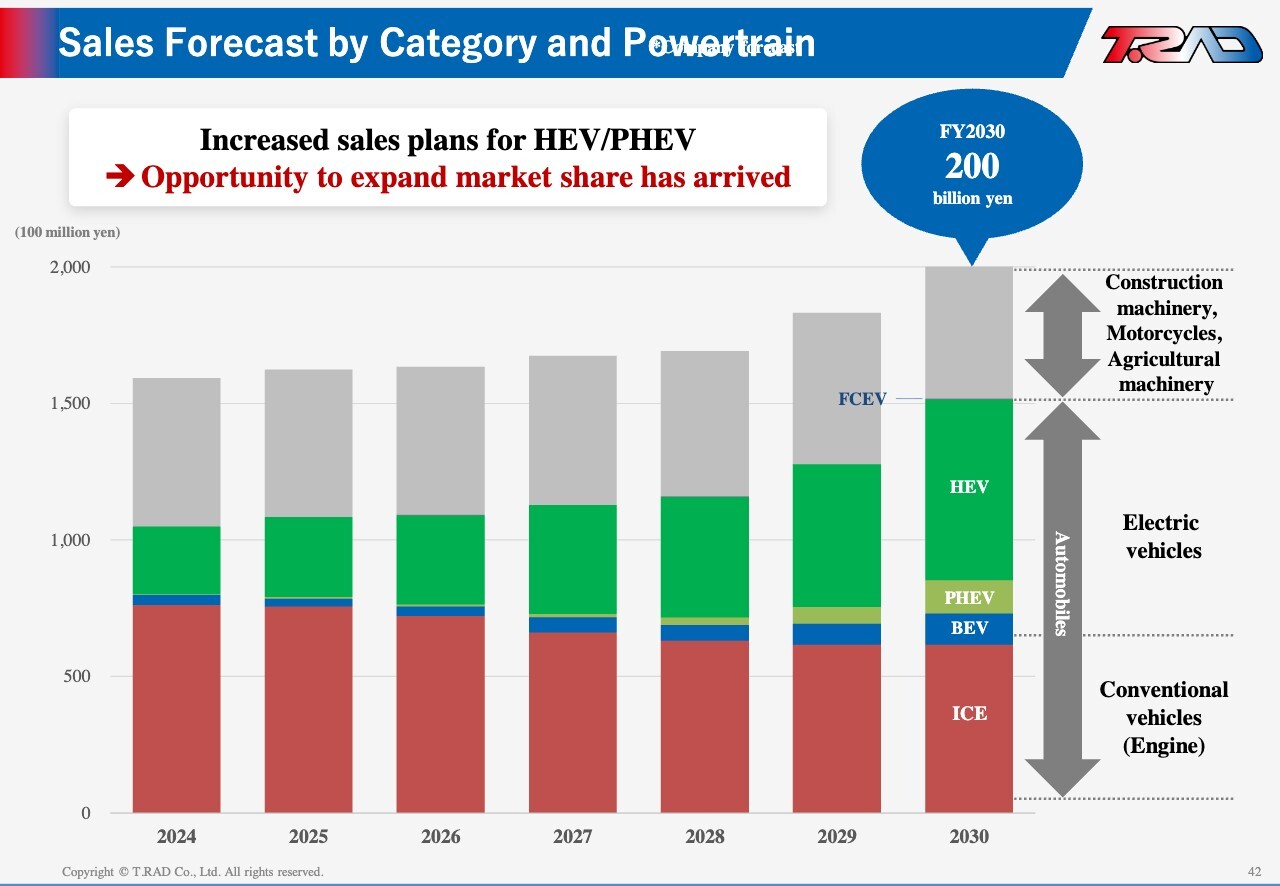
Looking at heat exchanger demand by powertrain, as we target net sales of ¥200.0 billion by FY2030, we believe hybrids will remain the primary driver of demand in the near term, reflecting a slowdown in BEV growth.
Promoting Local-for-Local Production Across Five Regional Hubs
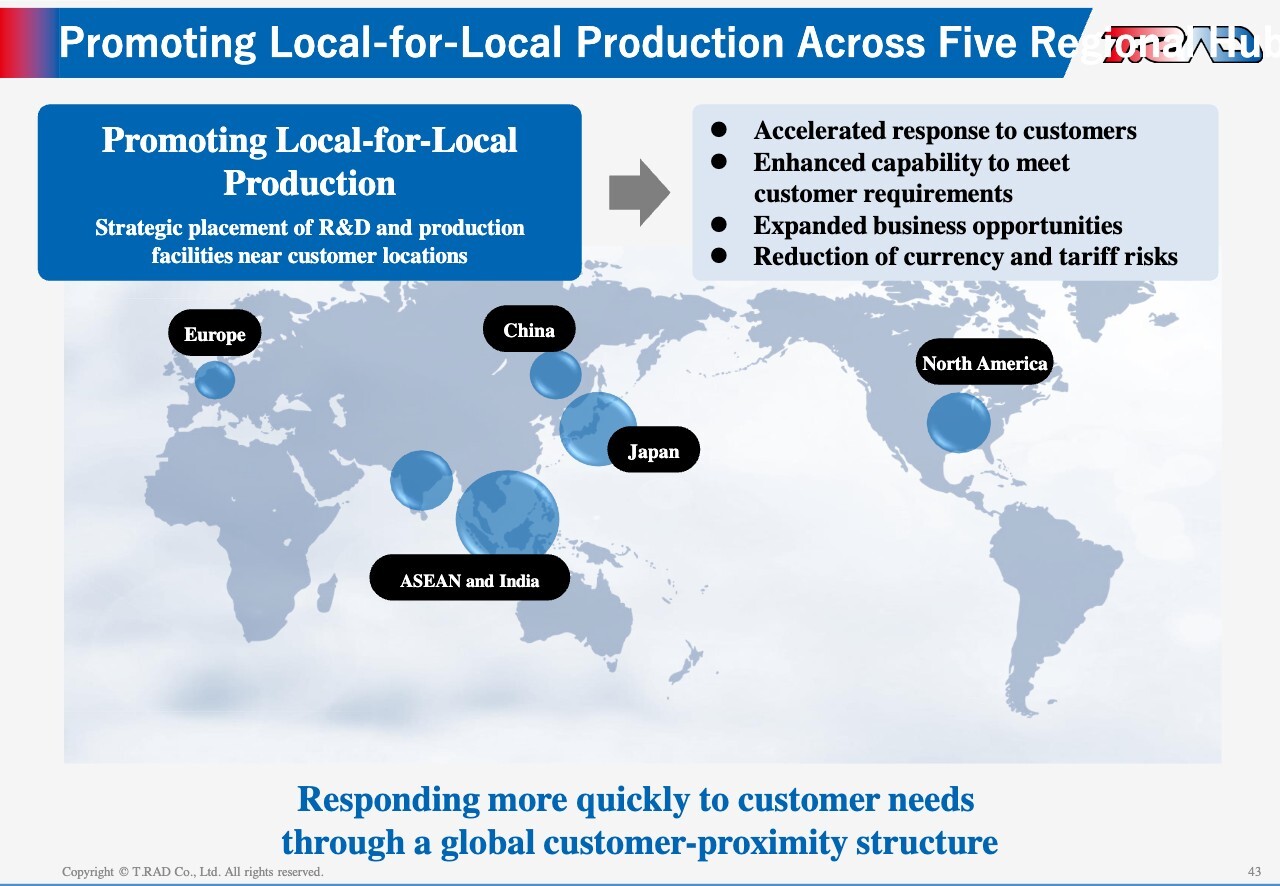
Our core policy is to advance a five-region global structure based on local production for local consumption. We strategically deploy development and production sites in the same regions where our customers operate and manufacture locally. This approach enables faster response times, strengthens our ability to meet customer needs, and supports the capture of additional business opportunities. It also helps mitigate tariff and foreign exchange risks, and we will continue to reinforce this framework.
Global Production Optimization in Practice: U.S. Subsidiary Case
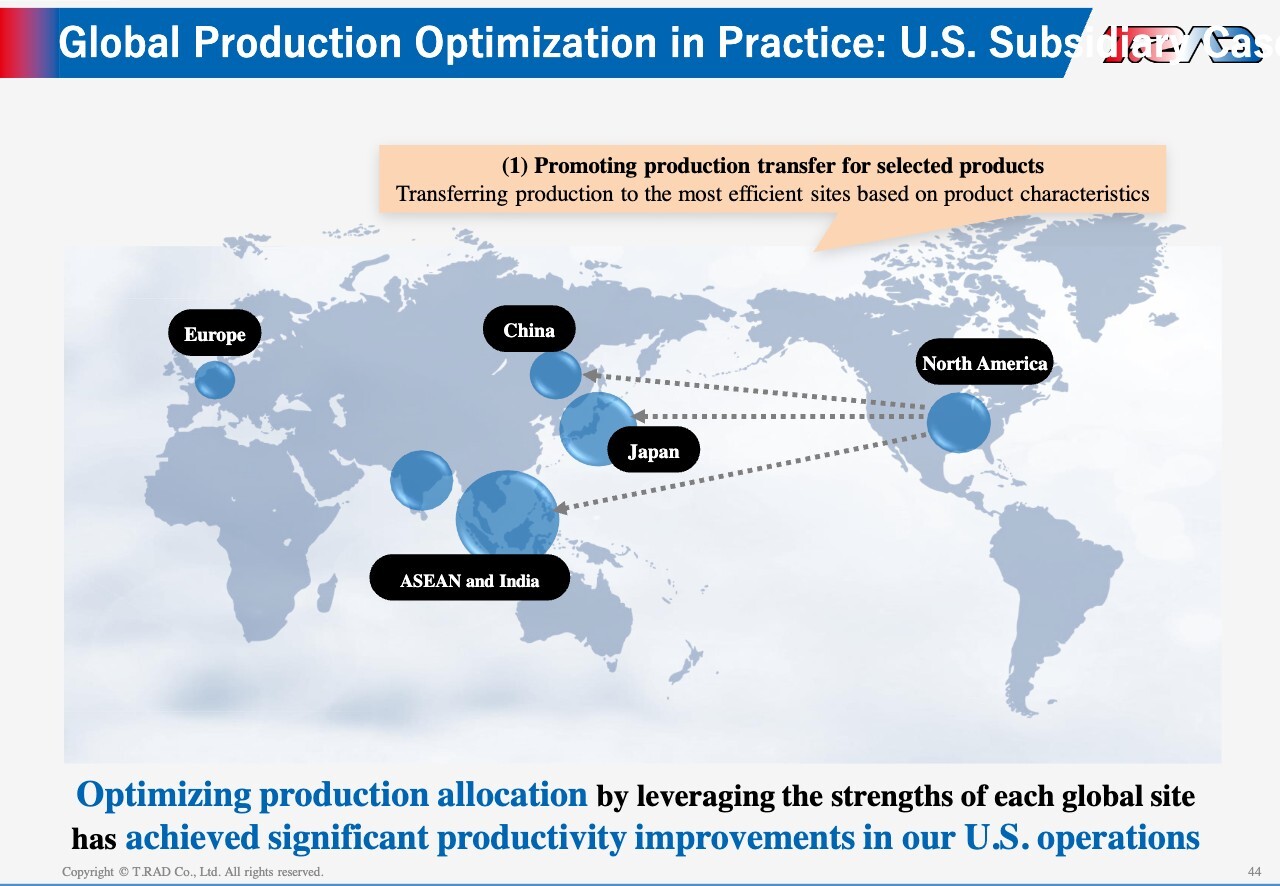
In the United States, we have addressed long-standing productivity challenges. We shifted production of products that do not require local manufacturing—such as ATVs—to ASEAN and Japan, improving overall productivity. As a result, we optimized production loads in the U.S., which drove a significant improvement in productivity and profitability.
Global Production Optimization in Practice: U.S. Subsidiary Case
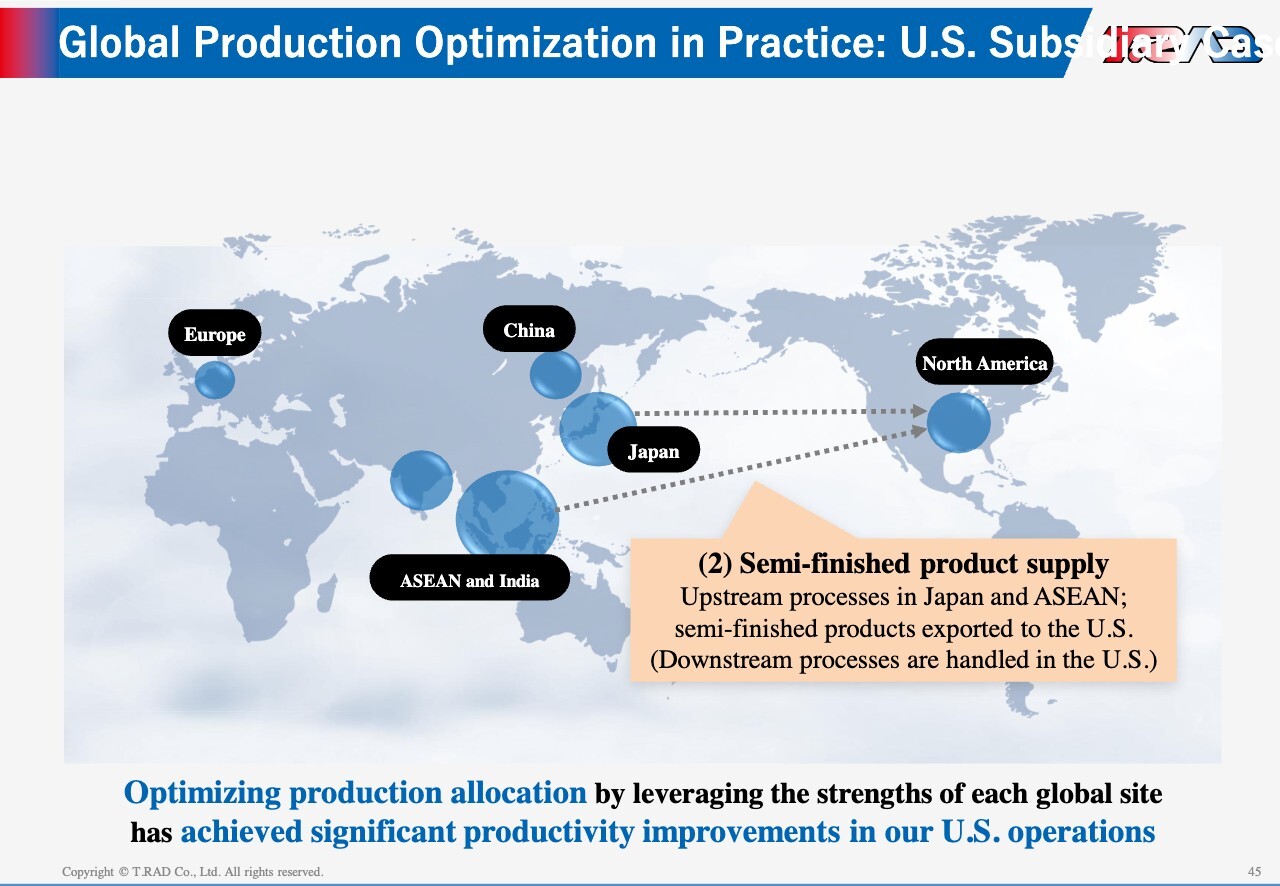
For products supplied to the U.S., we ship heat exchanger cores—the upstream components—in an efficient manner and carry out final assembly locally by attaching tanks and pipes. This division of roles enhances both logistics efficiency and productivity, contributing to improved profitability.
Image of DX Promotion at T.RAD
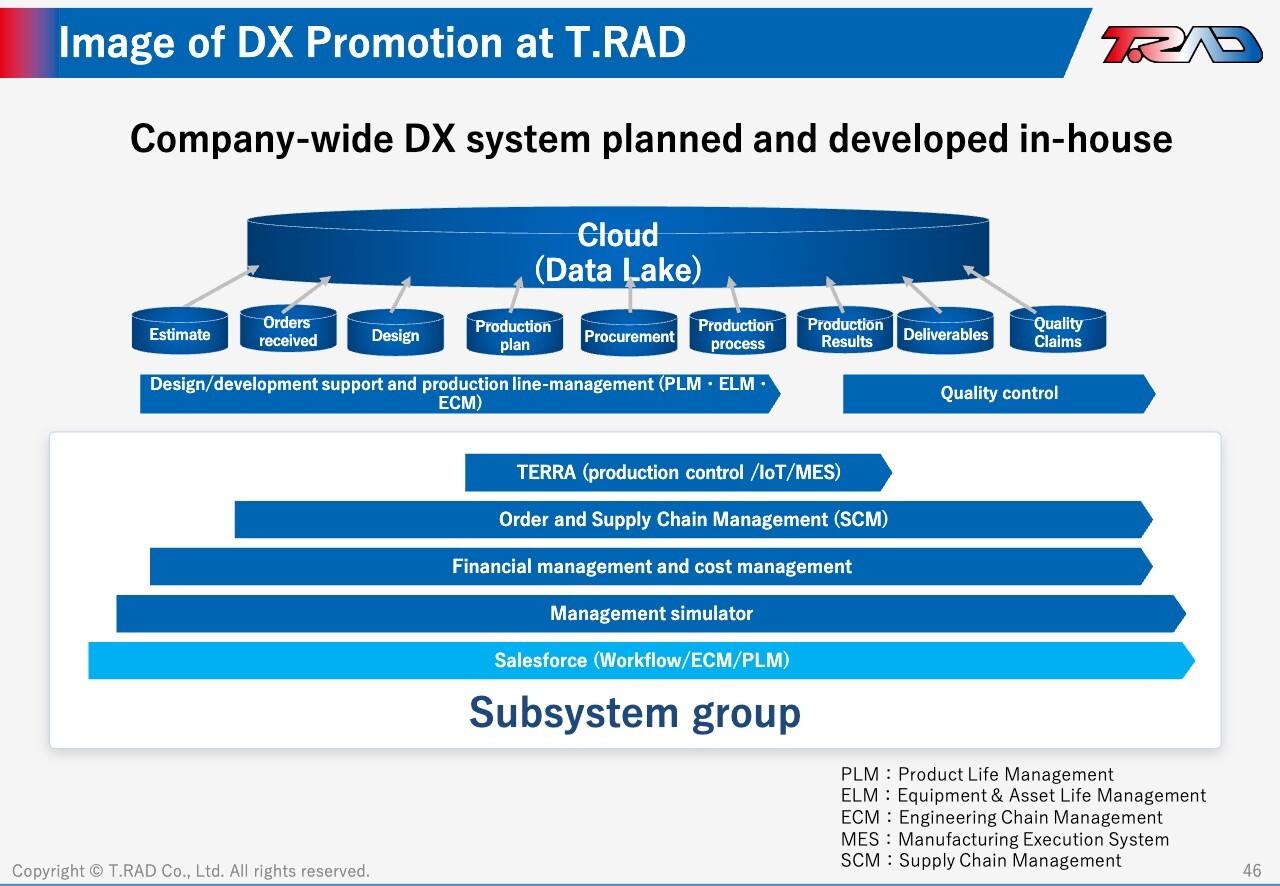
We are also advancing our DX initiatives by planning and developing a company-wide DX system in-house. We centralize all data—from order intake through design, production, planning, procurement, and quality—on the cloud and utilize it across the organization.
Establishment of a Global Integrated Production Management System
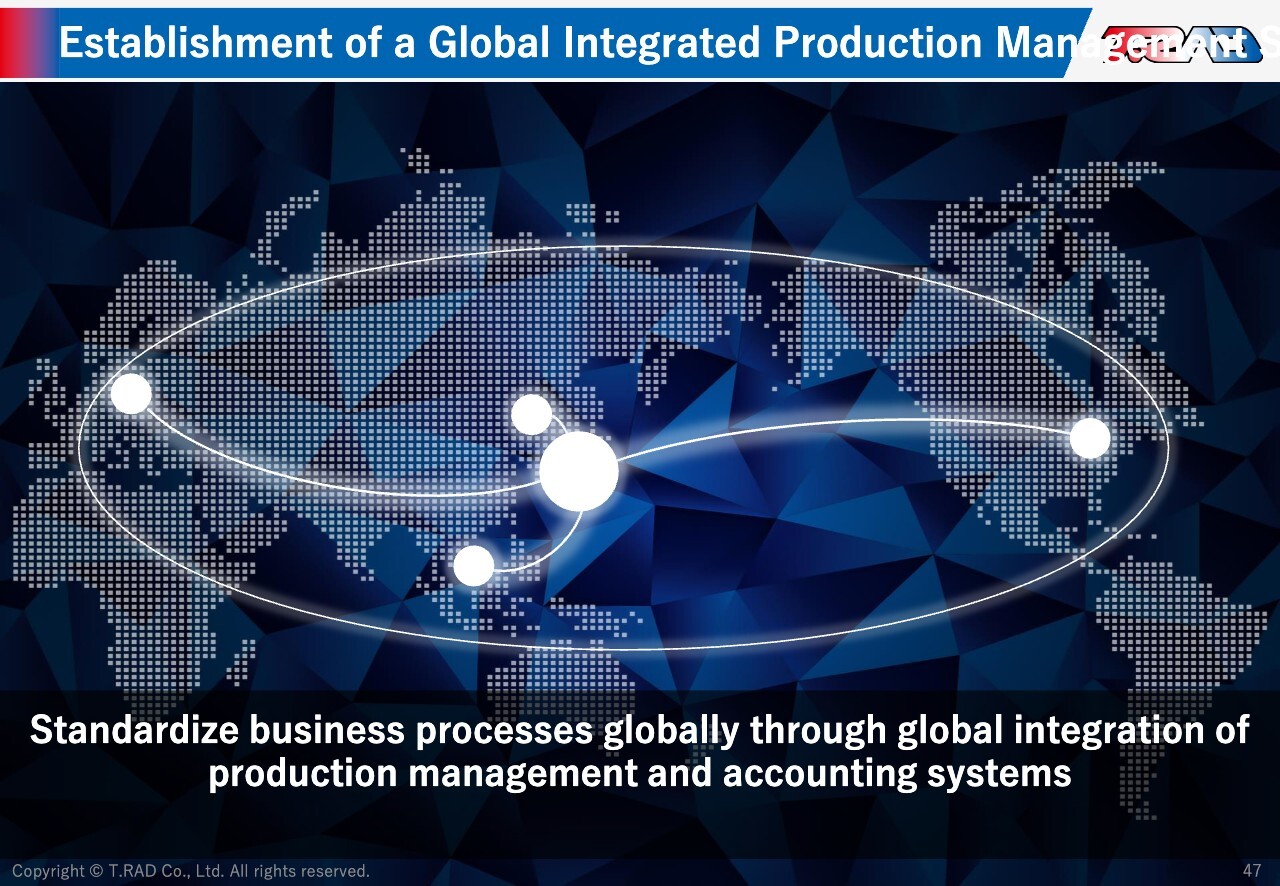
In addition, we are integrating production management and accounting systems on a global basis, standardizing business processes and improving efficiency.
Leveraging Data to Accelerate Decision-making
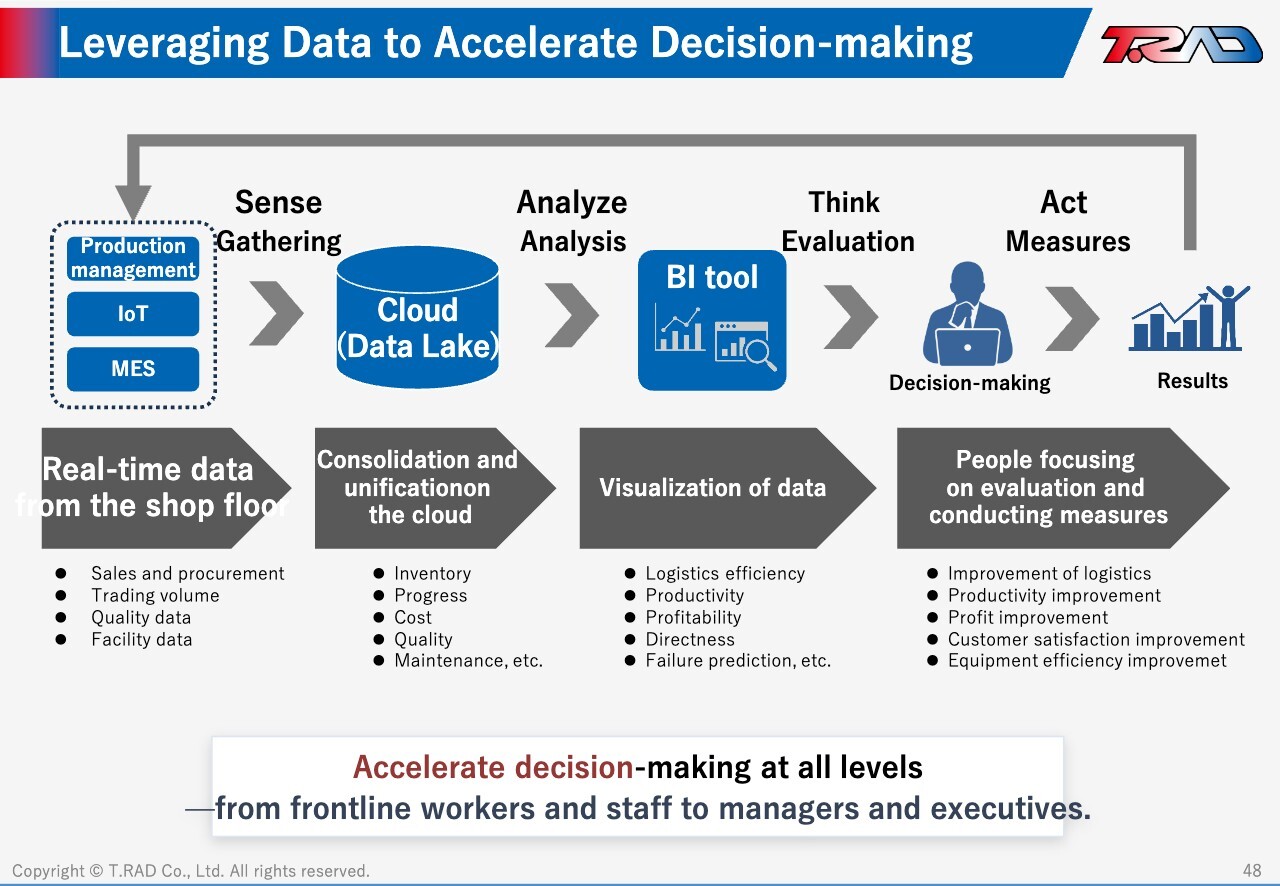
One of the key objectives of our DX initiatives is to accelerate decision-making. We collect and visualize on-site data and use it to drive evaluation and action, leading to cost reductions and productivity gains. By enhancing decision-making speed at every level—from frontline staff to senior management—we are advancing DX across the entire organization.
Sales Forecast by Region
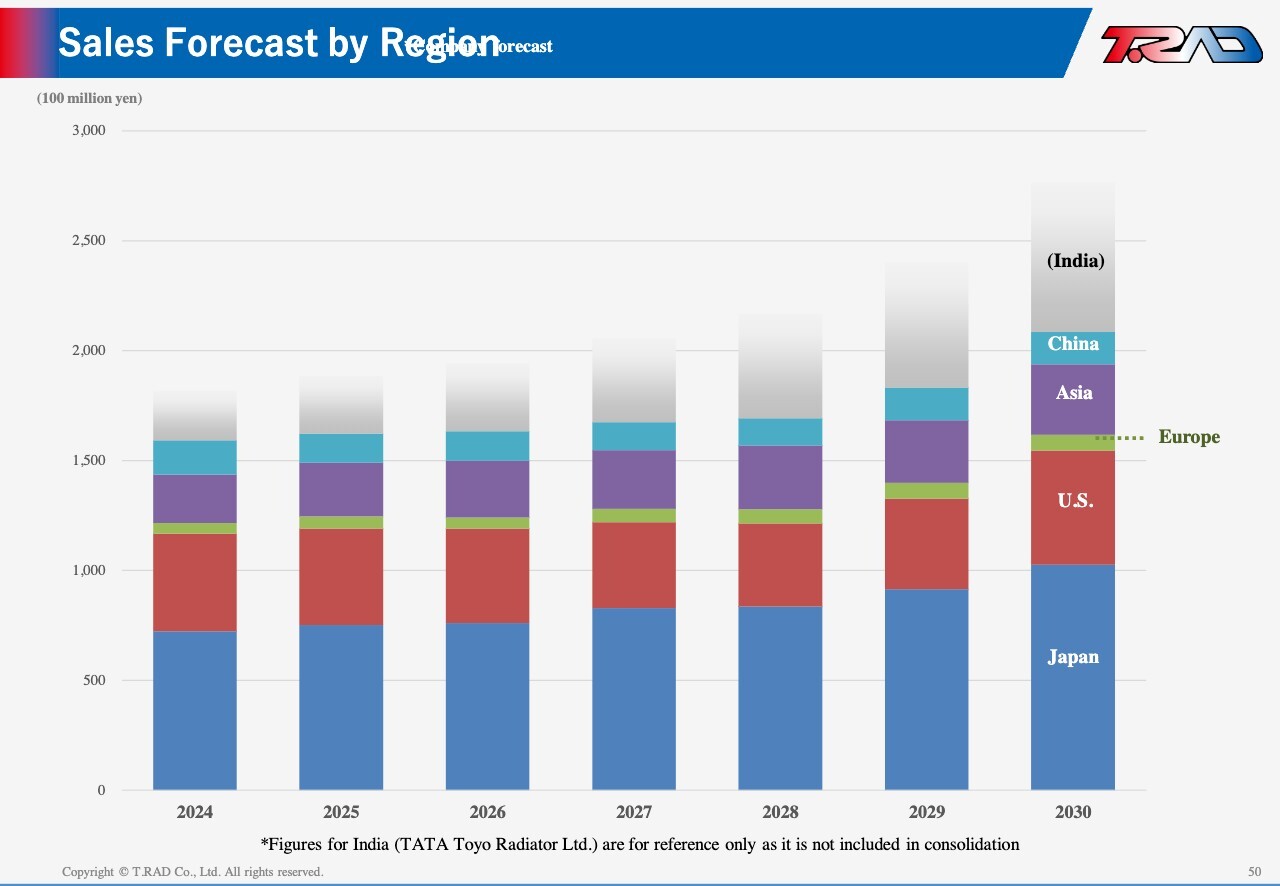
Let me turn to our global expansion. By region, we target net sales of ¥200.0 billion by FY2030. India is not included in consolidated net sales as it is accounted for under the equity method. However, we expect the Indian market to grow significantly and project net sales to exceed ¥50.0 billion by FY2030. We position India as our largest growth market.
U.S. Subsidiary (TRA) Performance Forecast
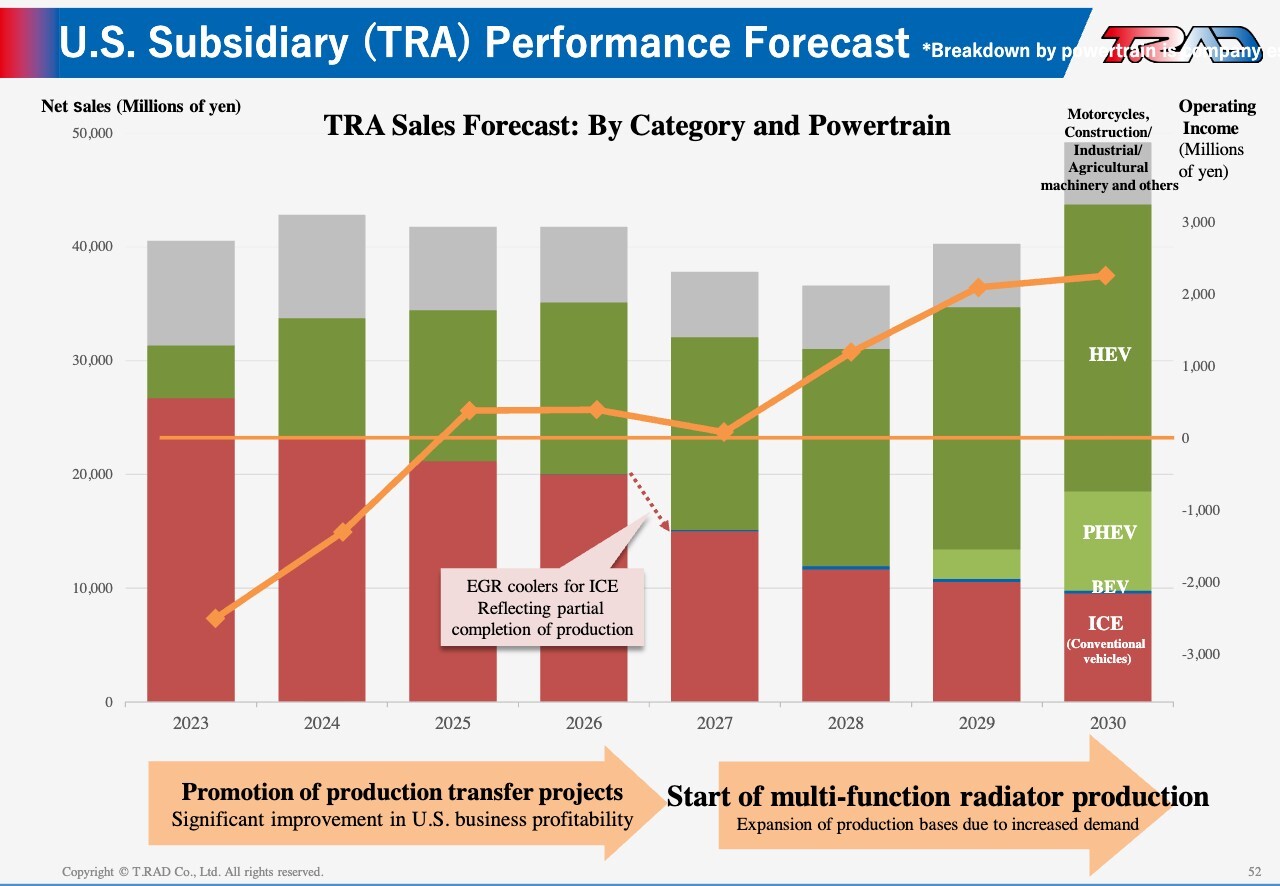
Let me discuss the U.S. and Europe. Our U.S. subsidiary turned profitable in FY2025, and we expect both net sales and profit to remain broadly flat in FY2026. In FY2027, net sales and profit margin will temporarily decline due to the end of production for certain products. However, from FY2028, we plan to begin mass production of multi-function radiators, which will put the business back on a growth trajectory.
Expansion of Production Footprint in Europe and North America (Medium-Term Strategic Plan)
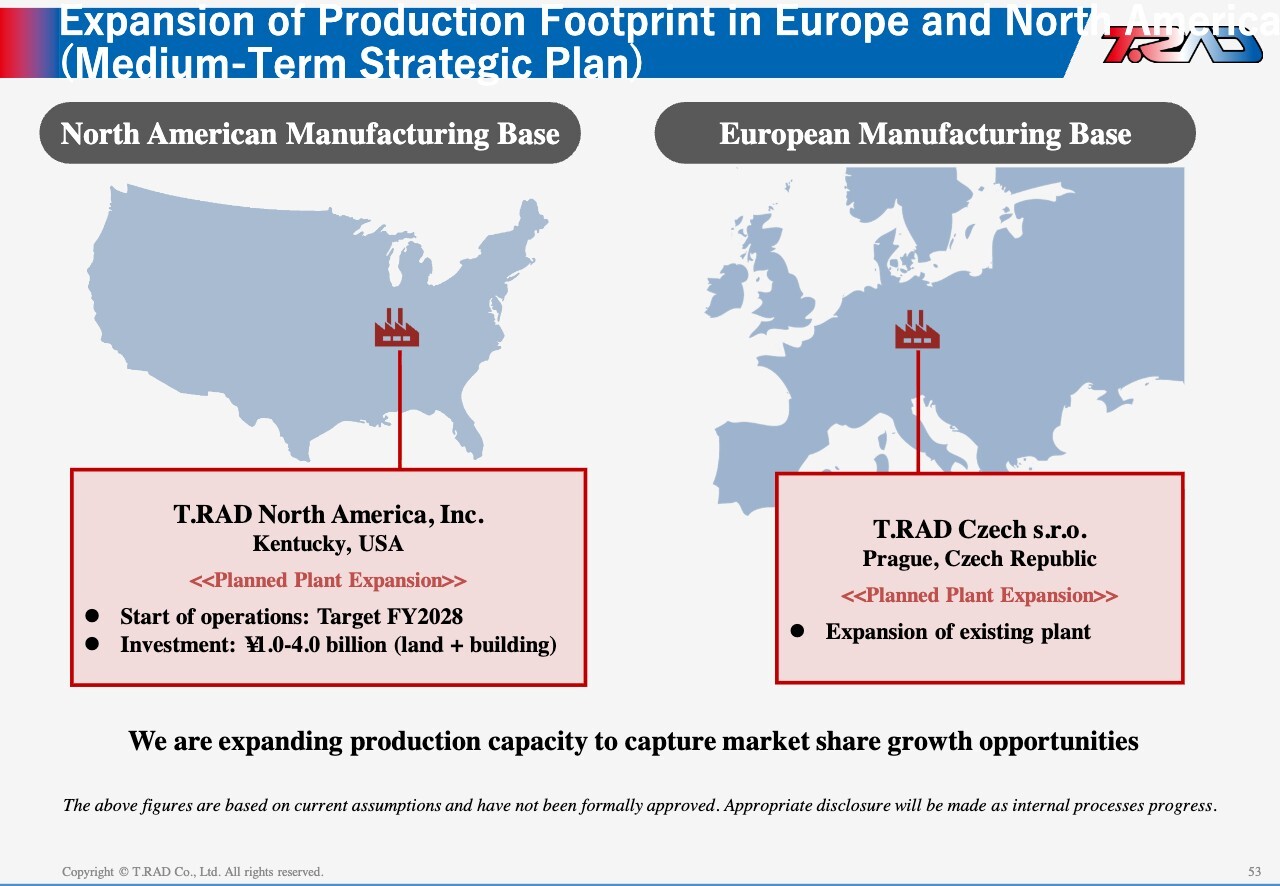
To support this ramp-up, we will expand our North American facilities and plan capital investment of ¥1.0 billion to ¥4.0 billion in FY2028. In Europe, we are also evaluating capacity expansion for multi-function radiators, adding new capabilities to existing plants that have traditionally focused on truck applications.
India Business
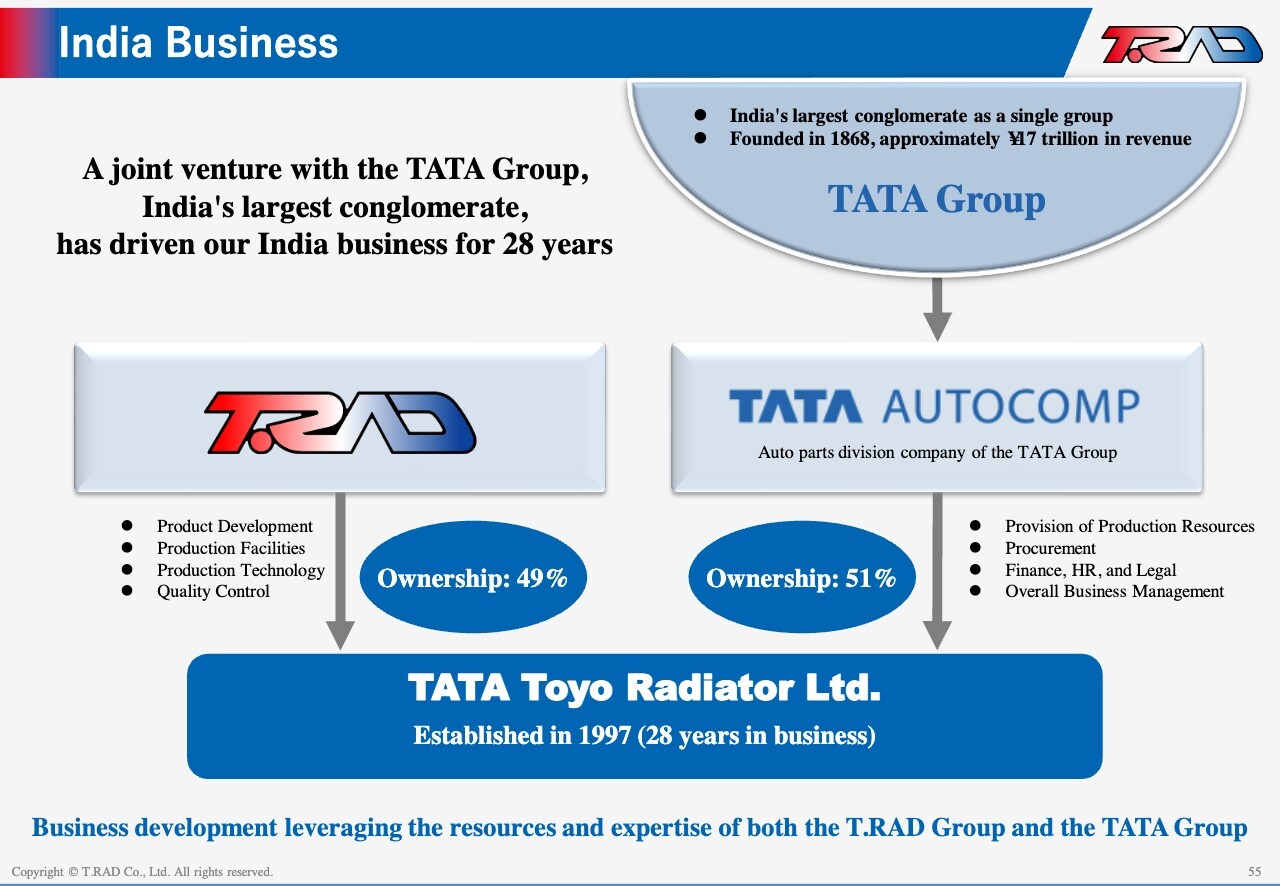
Let me turn to India. We established a joint venture with the TATA Group—India’s largest conglomerate—approximately 28 years ago and have built a strong partnership since then. We hold a 49% stake, while the TATA Group holds 51%.
We lead product development, production technology, and quality control, while the TATA Group provides production resources, procurement, human resources, and business management.
India Business
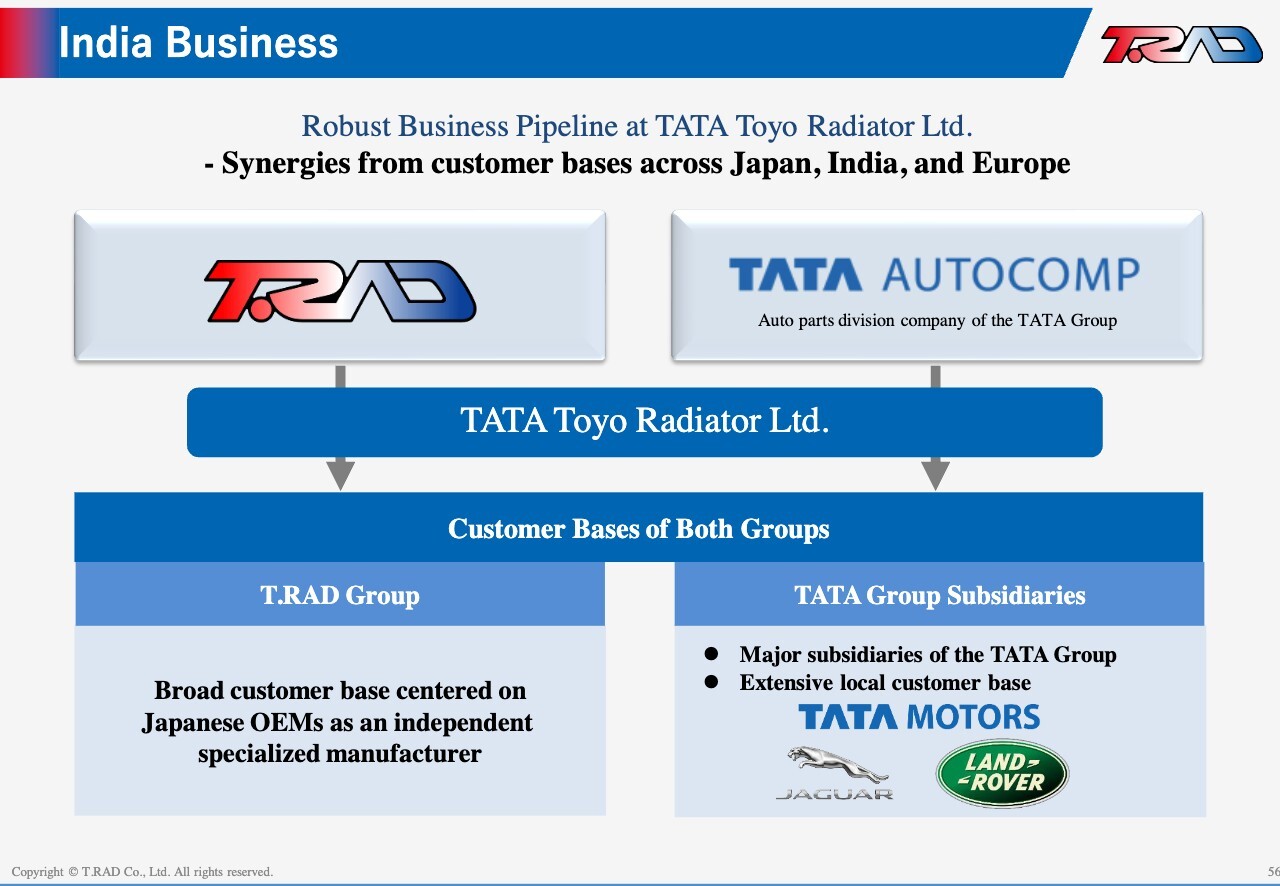
Through this collaboration, we are responding to market expansion by combining our customer base among Japanese OEMs with supply opportunities for Tata Motors, Jaguar, Land Rover and other customers.
India Business
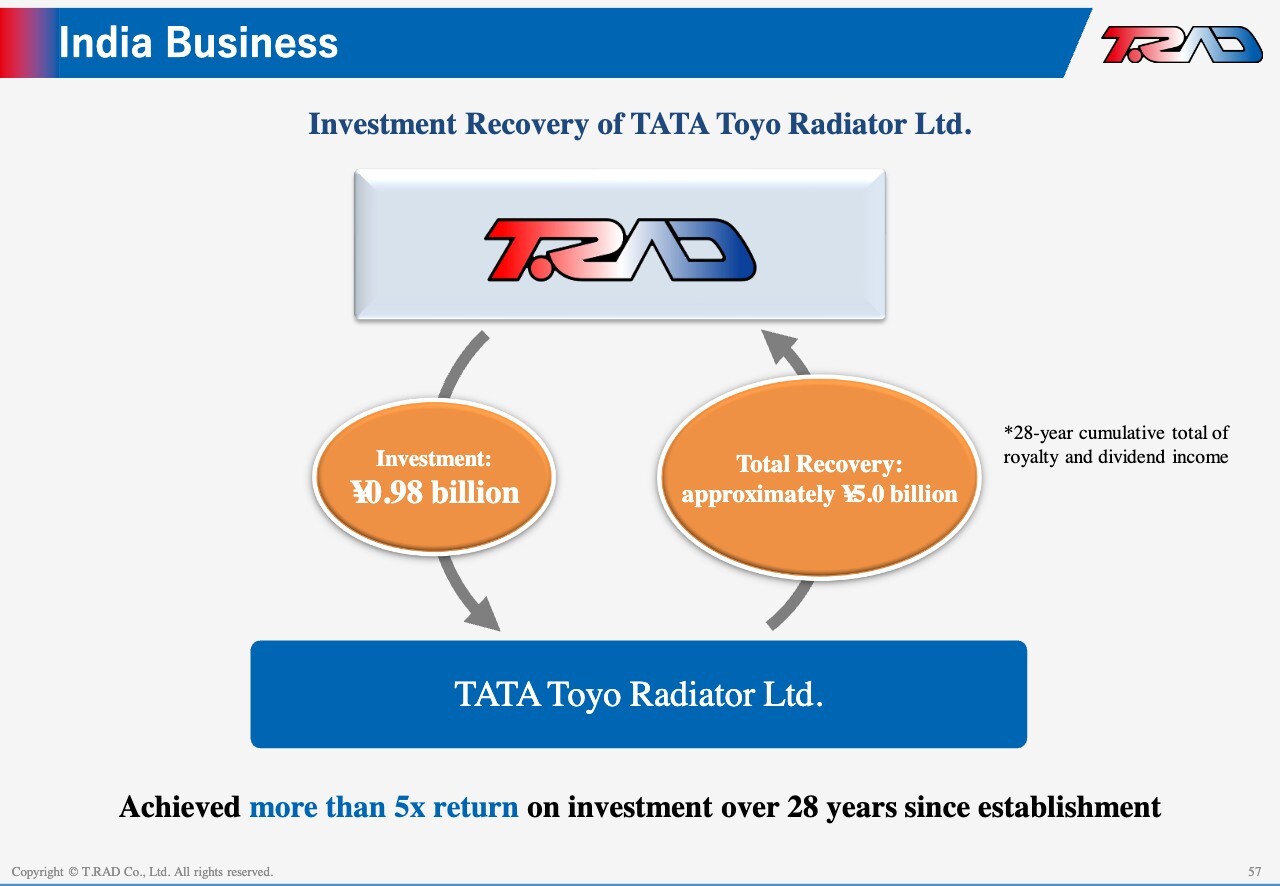
Against cumulative investment of approximately ¥0.98 billion, we have recovered about ¥5.0 billion through royalties and dividends, delivering a return of more than 5x.
India Business
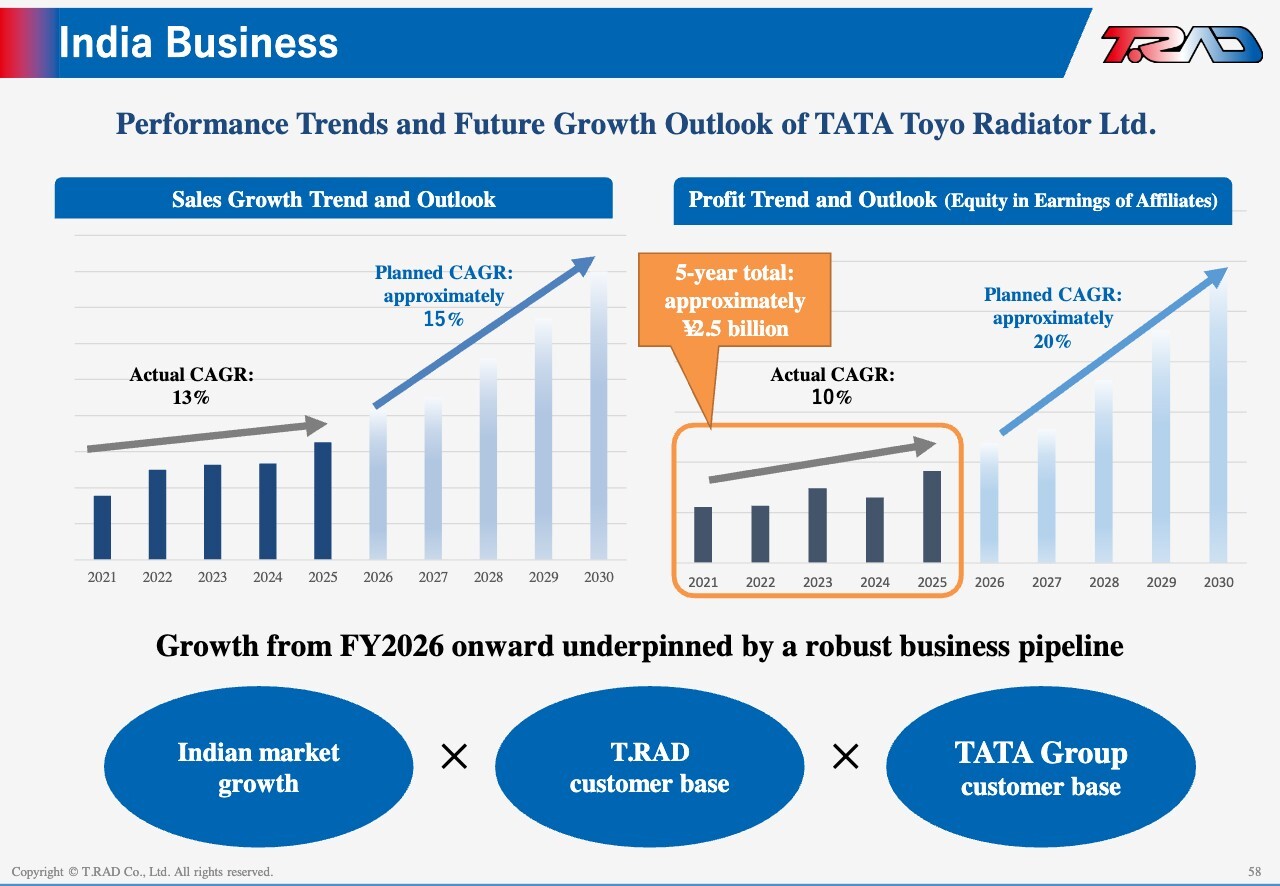
Over the past five years, sales recorded a CAGR of 13%, while net income recorded a CAGR of 10%, with cumulative net income totaling ¥2.5 billion. Over the next five years, we expect a sales CAGR of 15% and a profit CAGR of 20%, making this an important strategy for growth markets.
Expansion of Production Footprint (Medium-Term Strategic Plan)
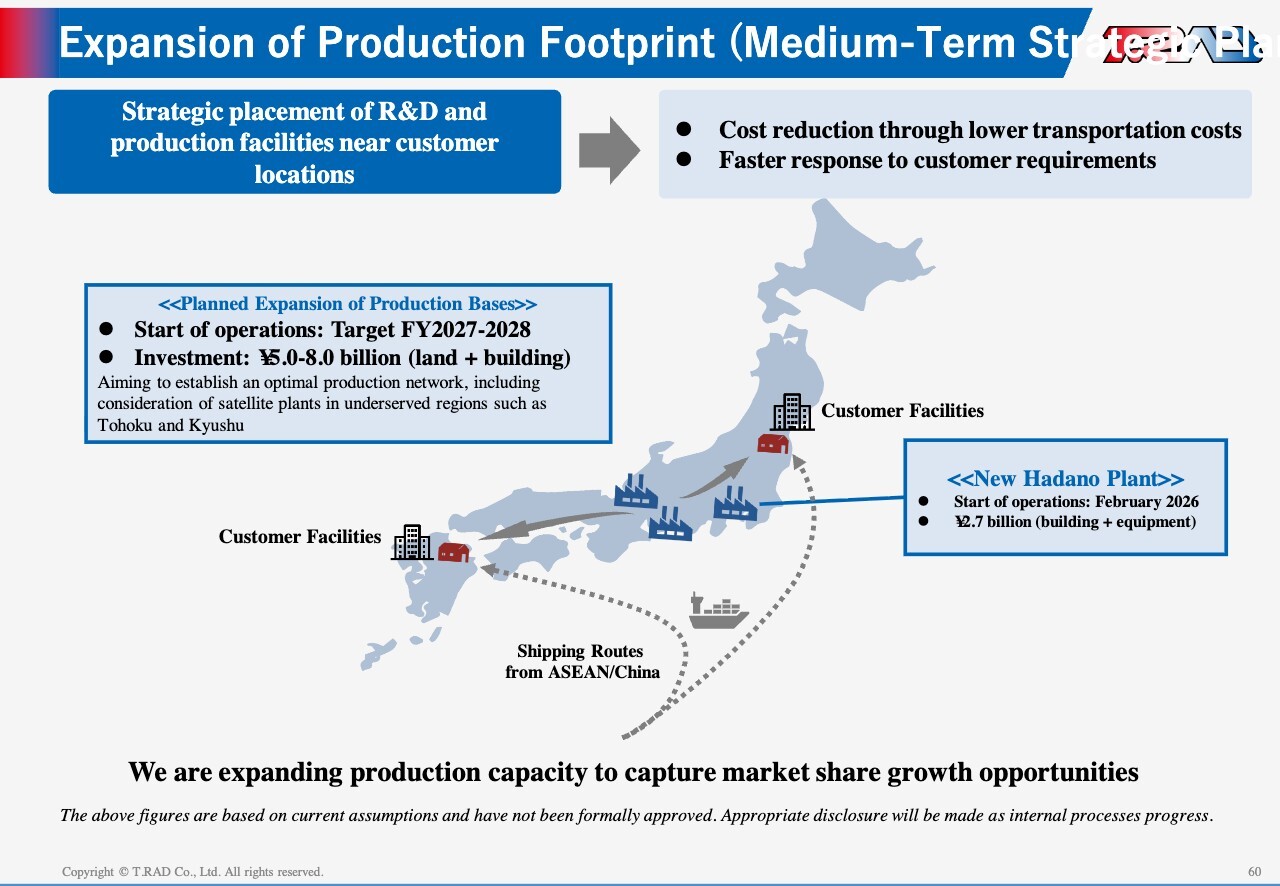
Let me turn to our domestic strategy. Demand in Japan is expanding, and we commenced operations at a new plant in Hadano in February 2026, following an investment of approximately ¥2.7 billion.
Even so, capacity remains tight. We plan to build satellite plants (downstream assembly sites) near customer facilities in the Tohoku and Kyushu regions. By locating final assembly close to customers, we will improve logistics efficiency and enhance cost competitiveness. We expect to invest approximately ¥5.0 billion to ¥8.0 billion over FY2027 to FY2028. Core components will be supplied from ASEAN and China.
Leveraging Our China Operations
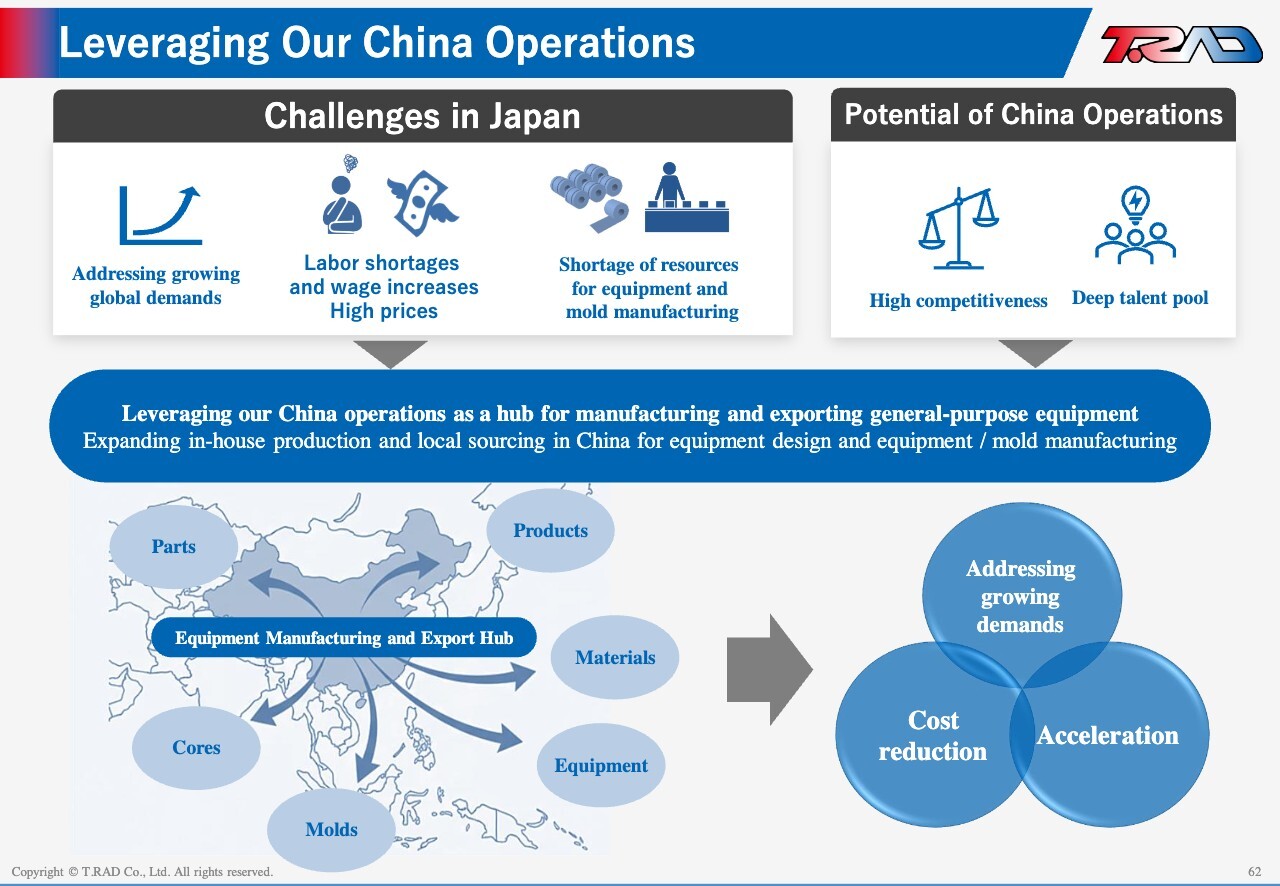
Turning to China, we see it as a key base for addressing the constraints we face in Japan. In Japan, rising demand is creating challenges, including labor shortages, rising costs, and limited equipment and supplier capacity. By contrast, China offers strong competitiveness in terms of both talent and cost, and we will leverage these advantages.
We will leverage our China operations as a production and export hub for general-purpose equipment, components, and materials, strengthening our global supply network. This approach will support demand growth, reduce costs, and improve speed to market.
Green Transformation (GX) Initiatives
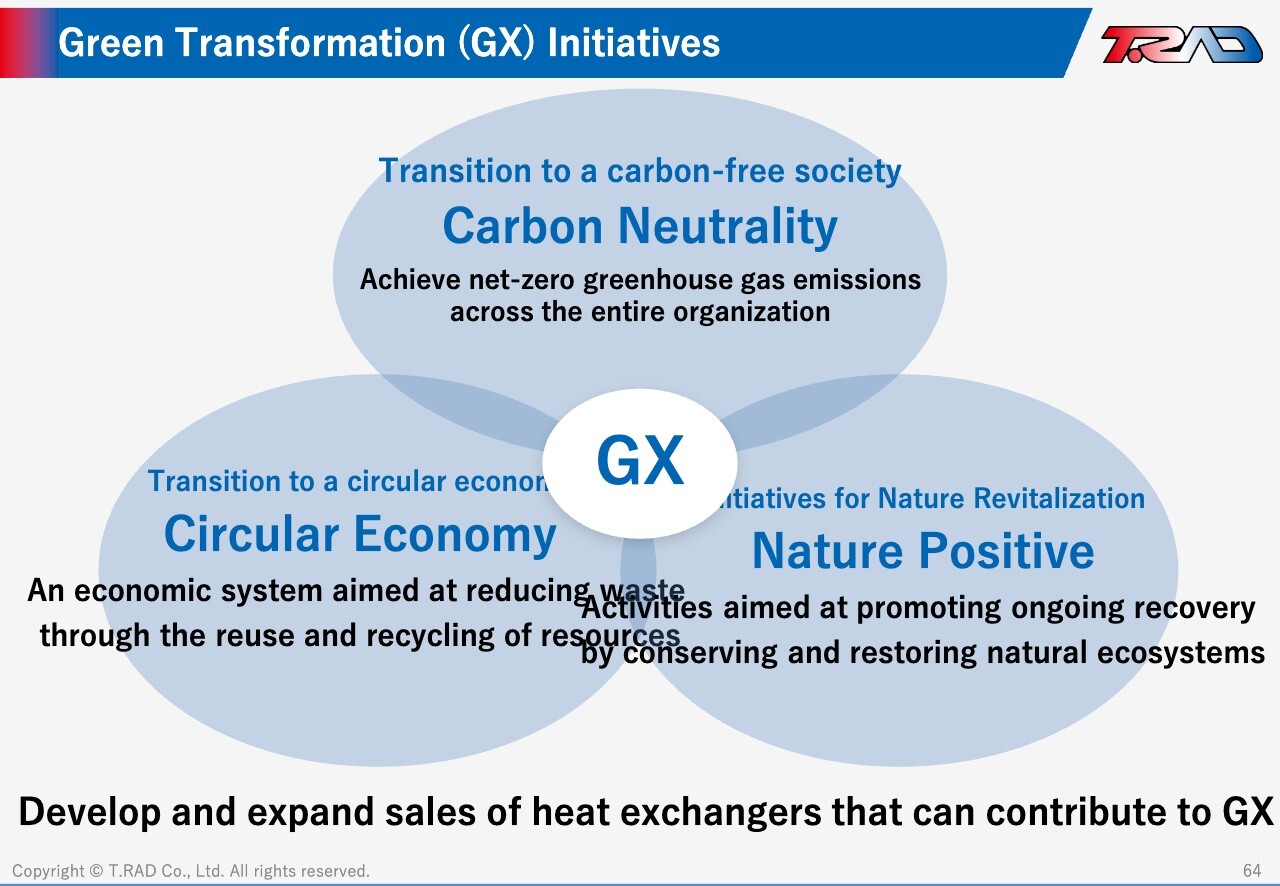
Let me turn to our GX initiatives. We focus on three pillars—carbon neutrality, circular economy, and nature positive—and are advancing the development of heat exchangers that contribute to these goals.
Promoting GX Initiatives: CO2 Emissions Trend
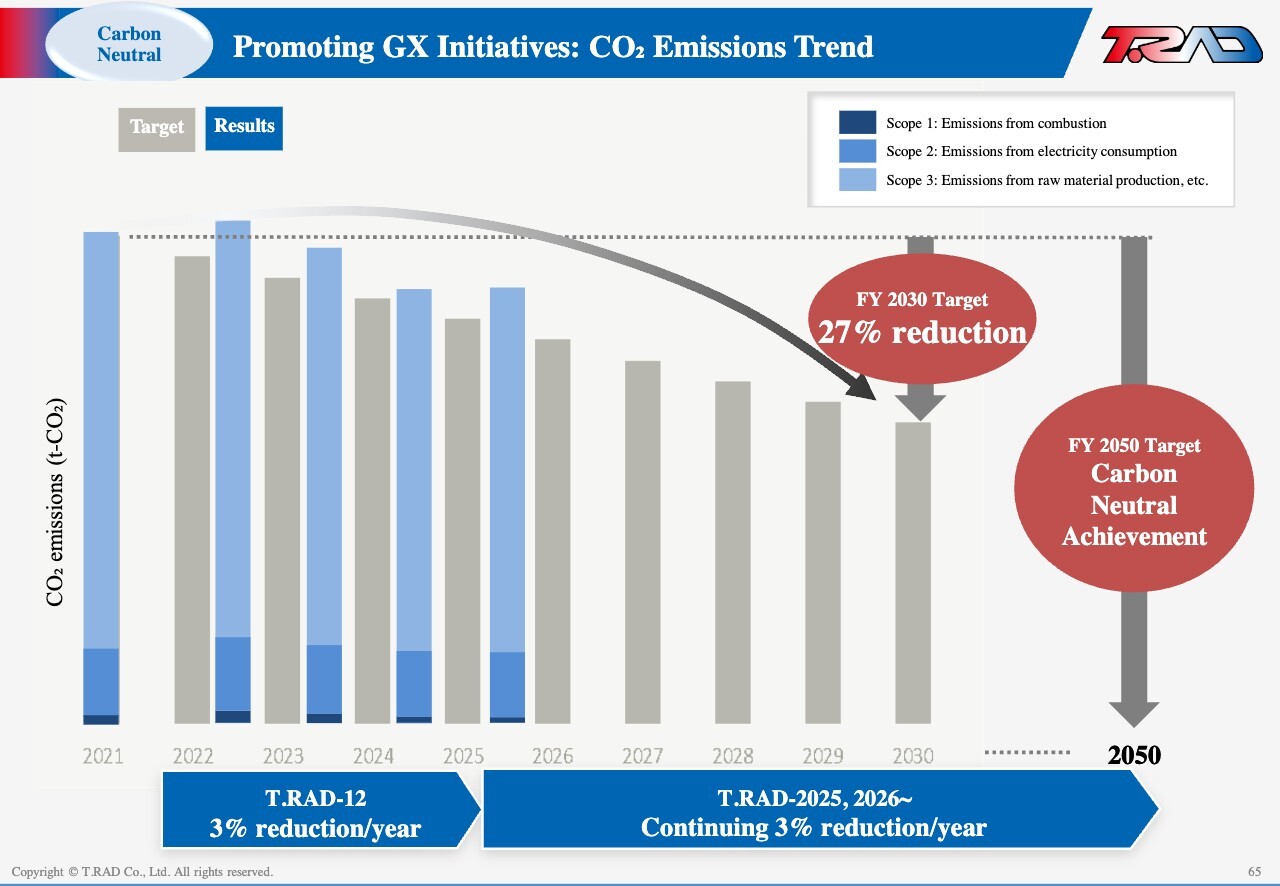
Toward achieving carbon neutrality by 2050, we have set a target to reduce CO₂ emissions by 3% annually. While we are making steady progress in reducing Scope 1 and Scope 2 emissions, our biggest challenge is Scope 3 emissions arising from aluminum materials.
Promoting GX Initiatives: CO2 Emissions Trend
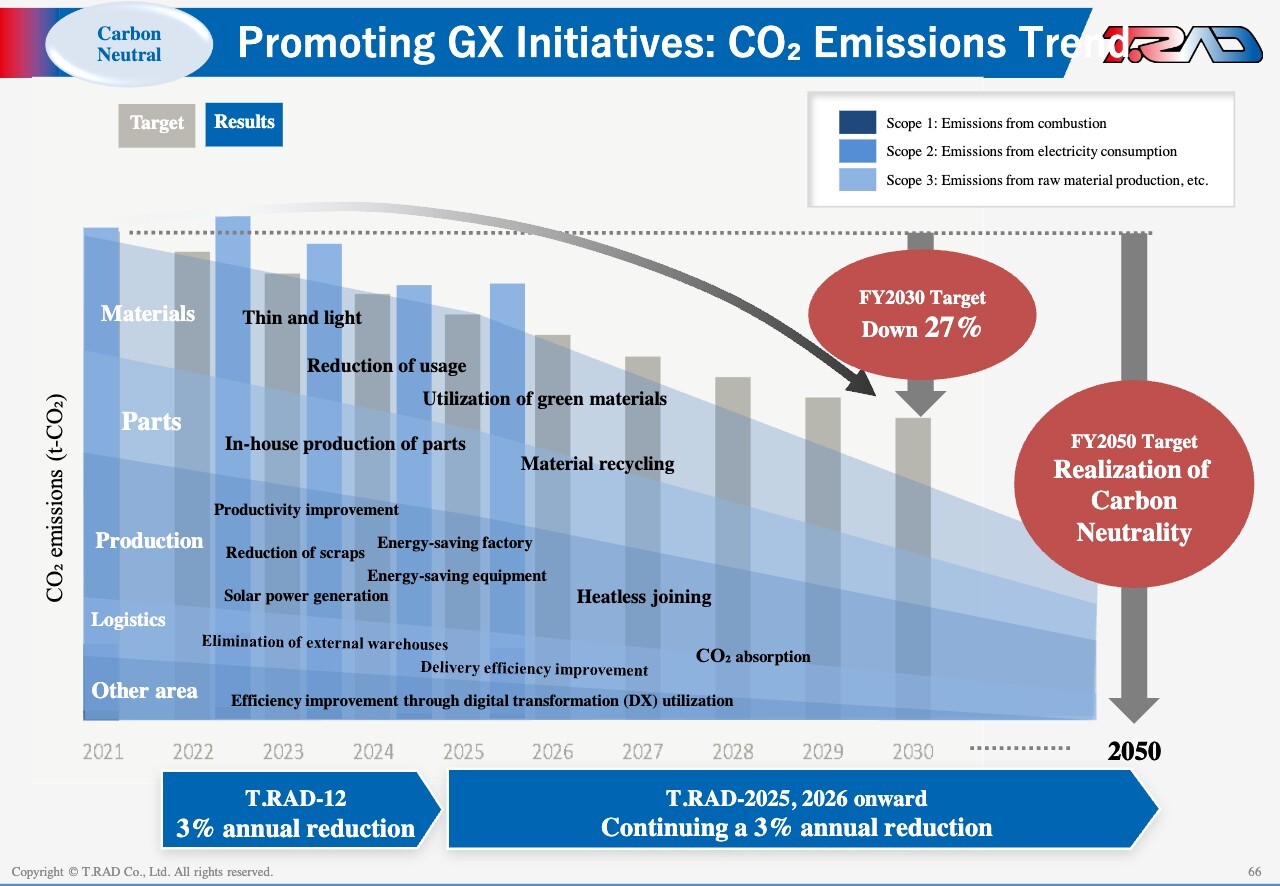
We will address Scope 1 and Scope 2 emissions through energy efficiency initiatives and the use of solar power. For Scope 3, we will focus on expanding the use of green aluminum and promoting recycling.
Promoting GX Initiatives: Solar Power Installation Status
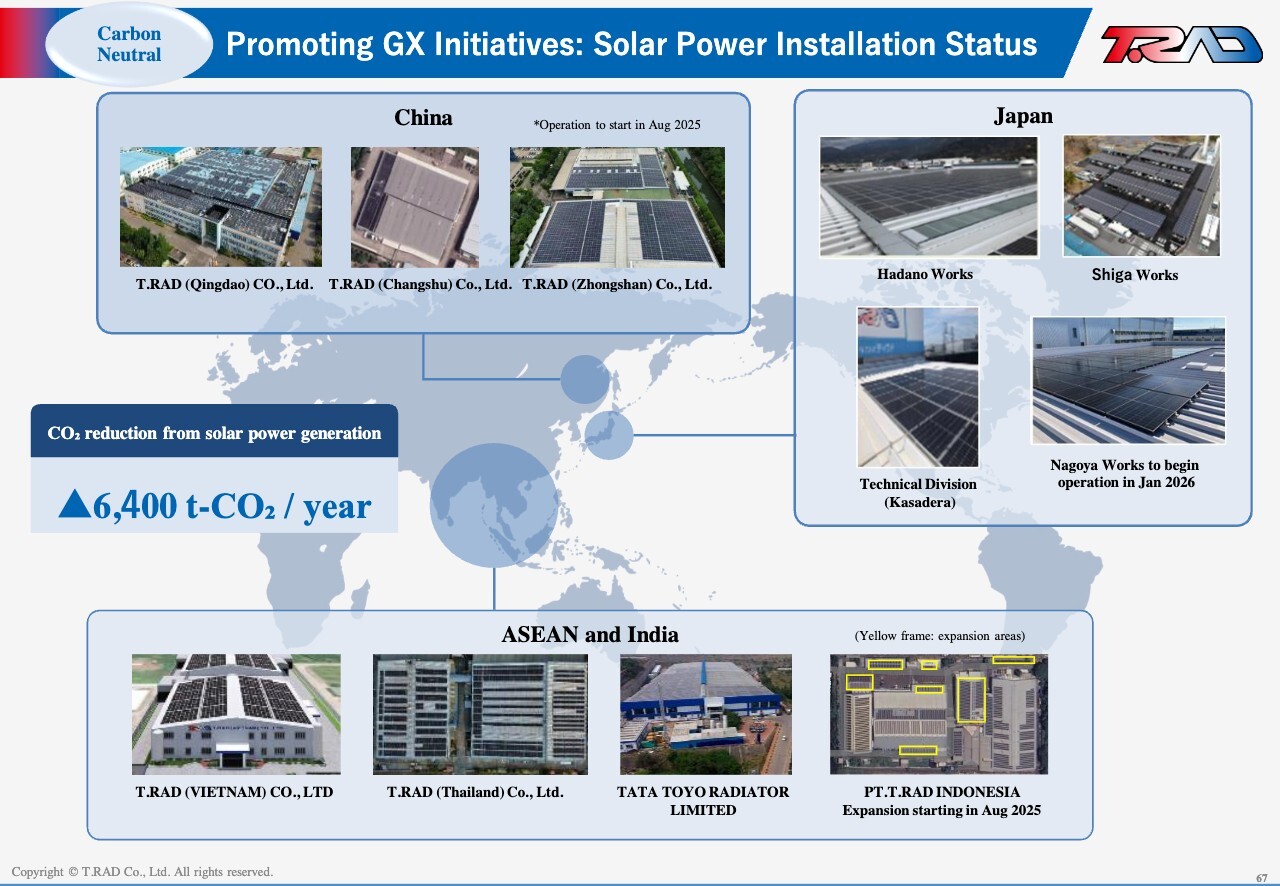
We are rolling out solar power generation across our global sites, reducing CO2 emissions by approximately 6,400 tons per year. This also lowers electricity costs, with an expected payback period of around 3 to 5 years.
Initiatives for Circular Economy
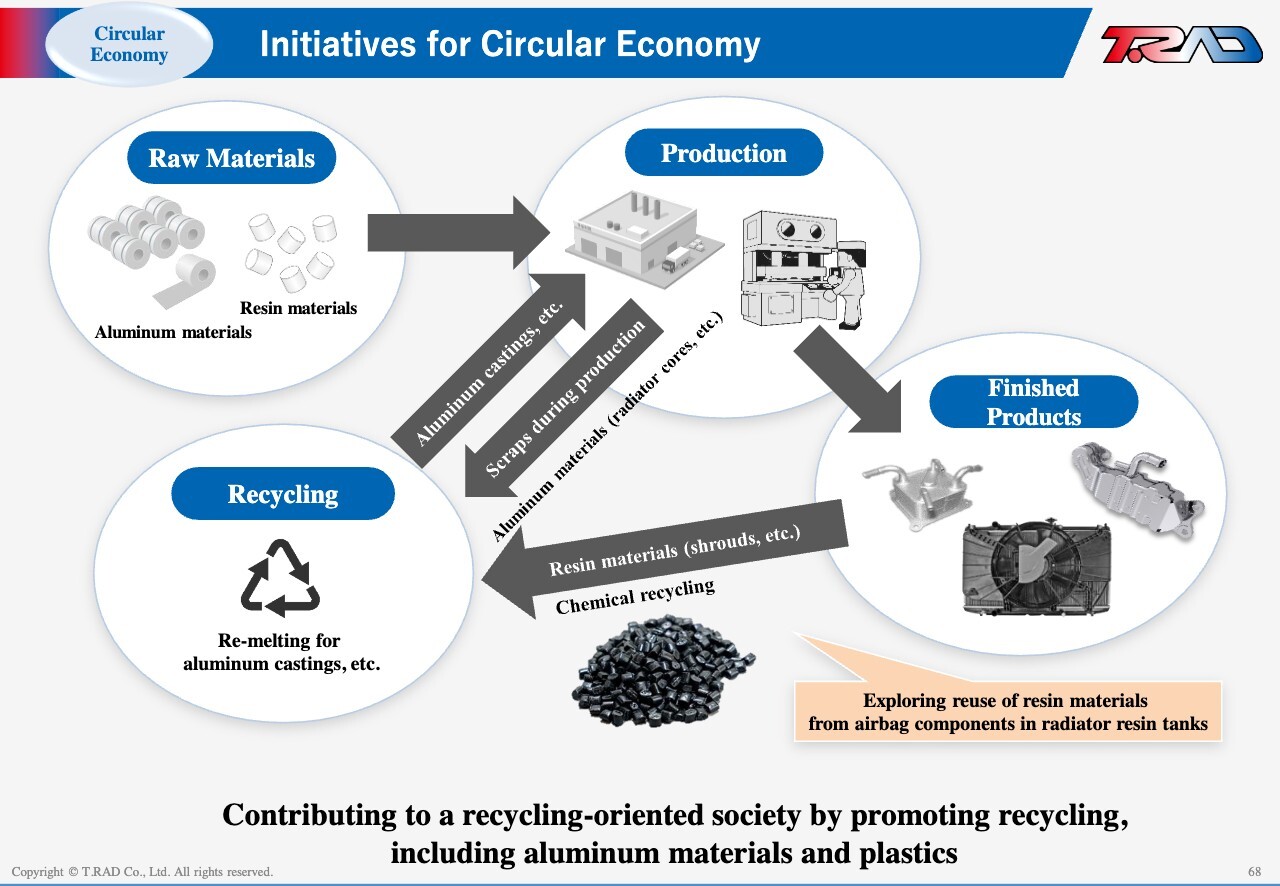
In addition, we are advancing the recycling of aluminum and resins to support a circular economy.
Nature Positive Initiatives
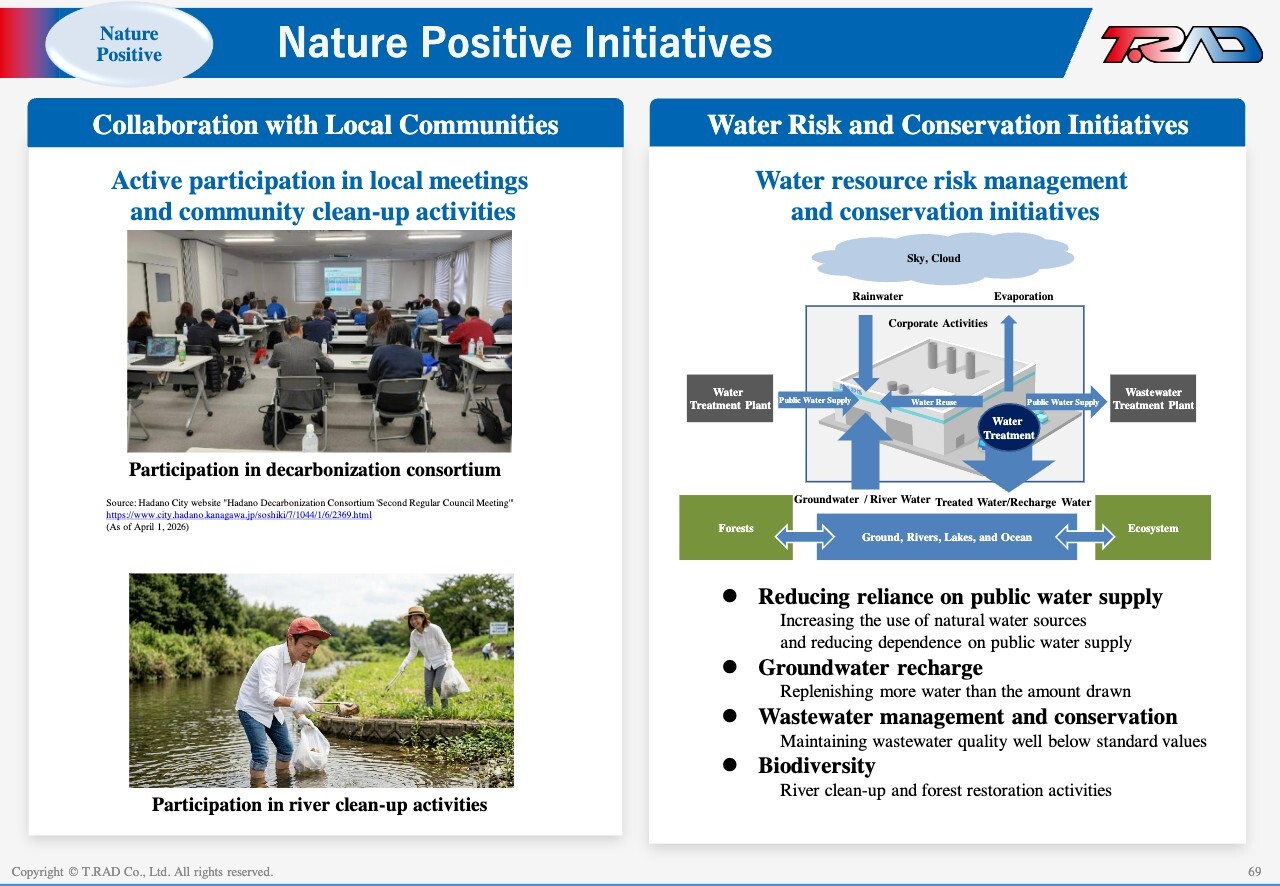
From a nature-positive perspective, we also engage in environmental initiatives in collaboration with local communities, including river clean-up activities, and water resource management.
Next-Generation Technologies and New Business Initiatives
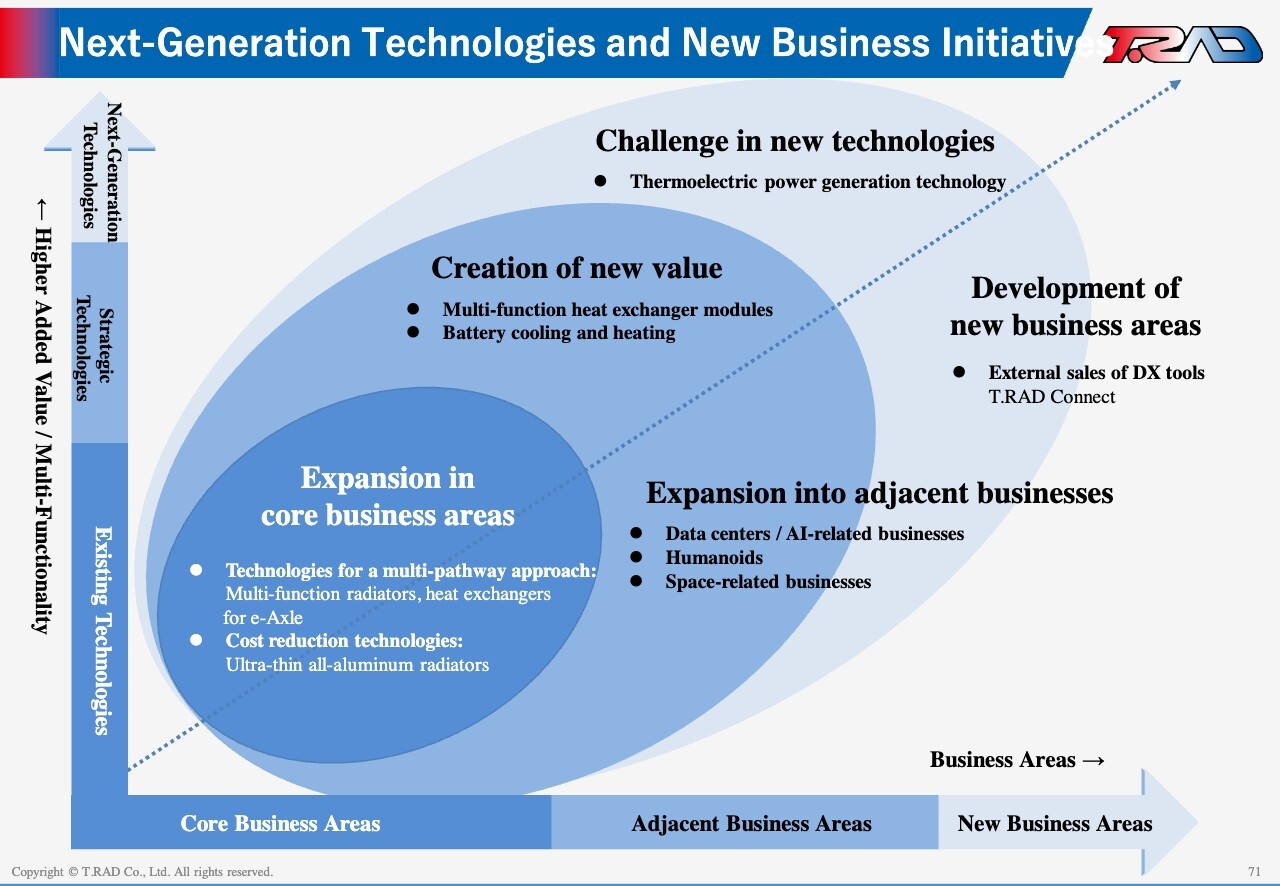
Let me turn to our new business initiatives.
Our business strategy starts with expanding our core areas, which remains our highest priority. Building on our multi-pathway technologies, as well as cost reduction and higher density design, we will drive vertical value enhancement by increasing the added value of our products. This includes developing multi-function heat exchangers and advancing technologies such as battery cooling. We are also pursuing new technologies, including thermoelectric power generation—radiators that convert heat into electricity—as part of our high-value-added innovation initiatives.
In addition, we will expand our business horizontally beyond our core automotive and motorcycle segments into adjacent fields. We believe heat exchangers are essential wherever heat is generated or utilized, and we will extend our applications beyond automotive markets. Specifically, we are targeting growth areas such as data centers, humanoid robots, and space-related applications.
In addition, we are entering an entirely new area by offering our DX tools externally. Under this initiative, we are developing a new business to provide the DX tools we use internally to external customers under the “T.RAD Connect” brand.
New Business (Thermoelectric Radiator/Waste Heat Generation Super Energy-Saving Furnace)
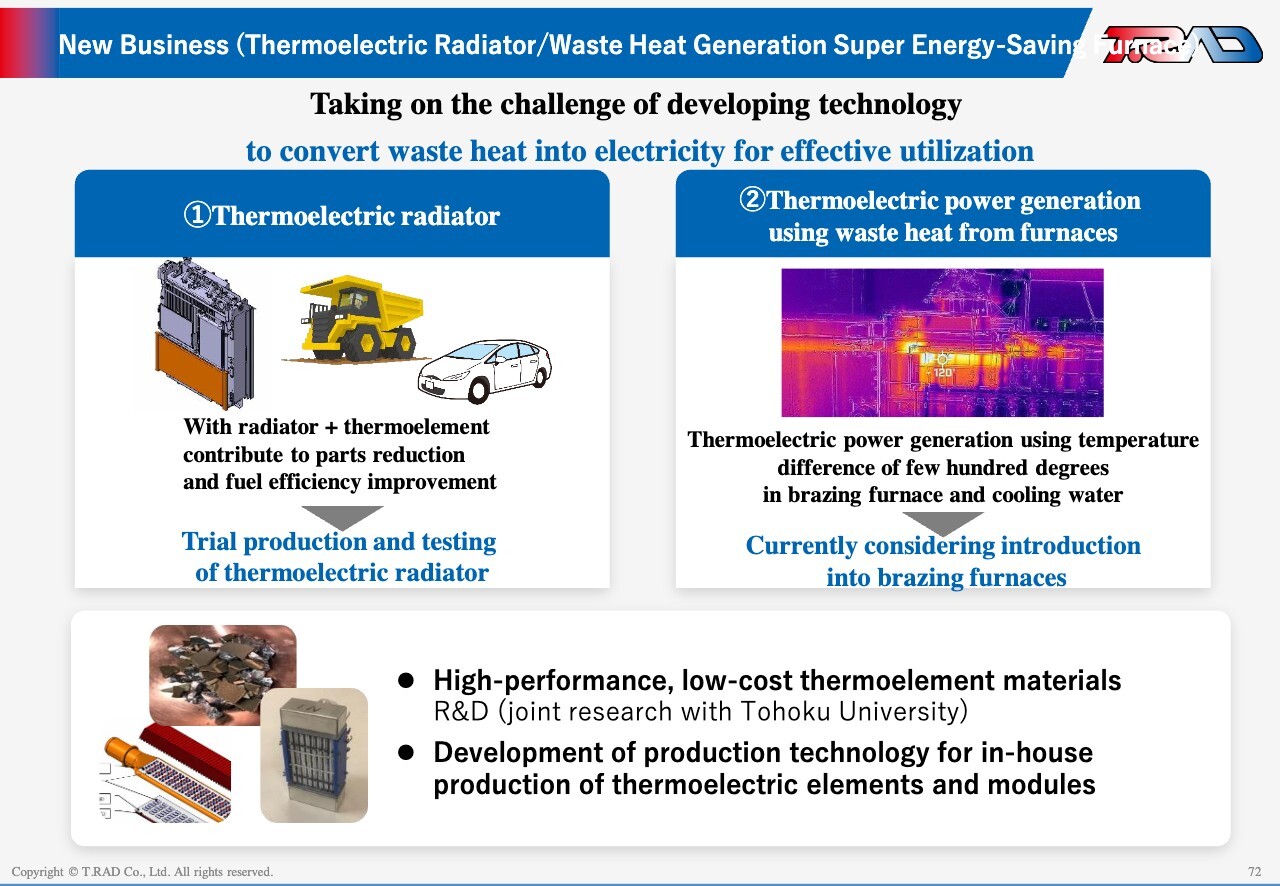
As part of our challenge in new technologies, we are also developing thermoelectric radiators. These radiators generate electricity when removing heat, and the generated power can be used by the vehicle. We believe this can help reduce auxiliary components such as alternators and contribute to energy savings.
Brazing is the most energy-intensive process in our radiator manufacturing. We are working to recover and reuse the heat generated in this process to further improve energy efficiency. While technically challenging, we are advancing development in collaboration with Tohoku University on thermoelectric elements, including module design and the establishment of mass-production technologies.
Sales of Manufacturing DX Solutions through T.RAD Connect
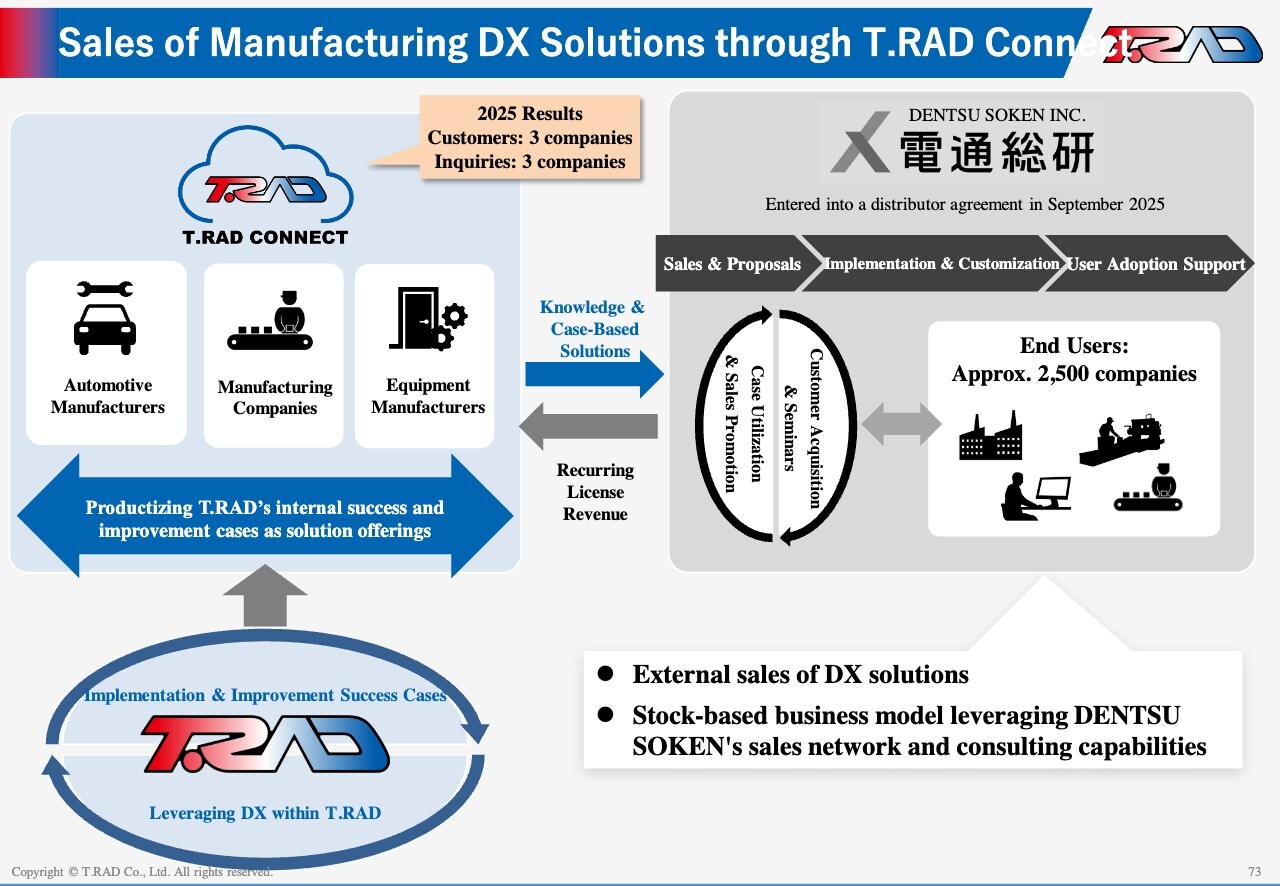
For our new business, T.RAD Connect, we signed a partnership agreement with DENTSU SOKEN last September and announced it publicly. Under this collaboration, T.RAD provides its DX solutions and applications—developed through its manufacturing operations—as licensed offerings, while DENTSU SOKEN proposes and deploys them to end users.
Reference: DENTSU SOKEN Company Profile/Business Overview
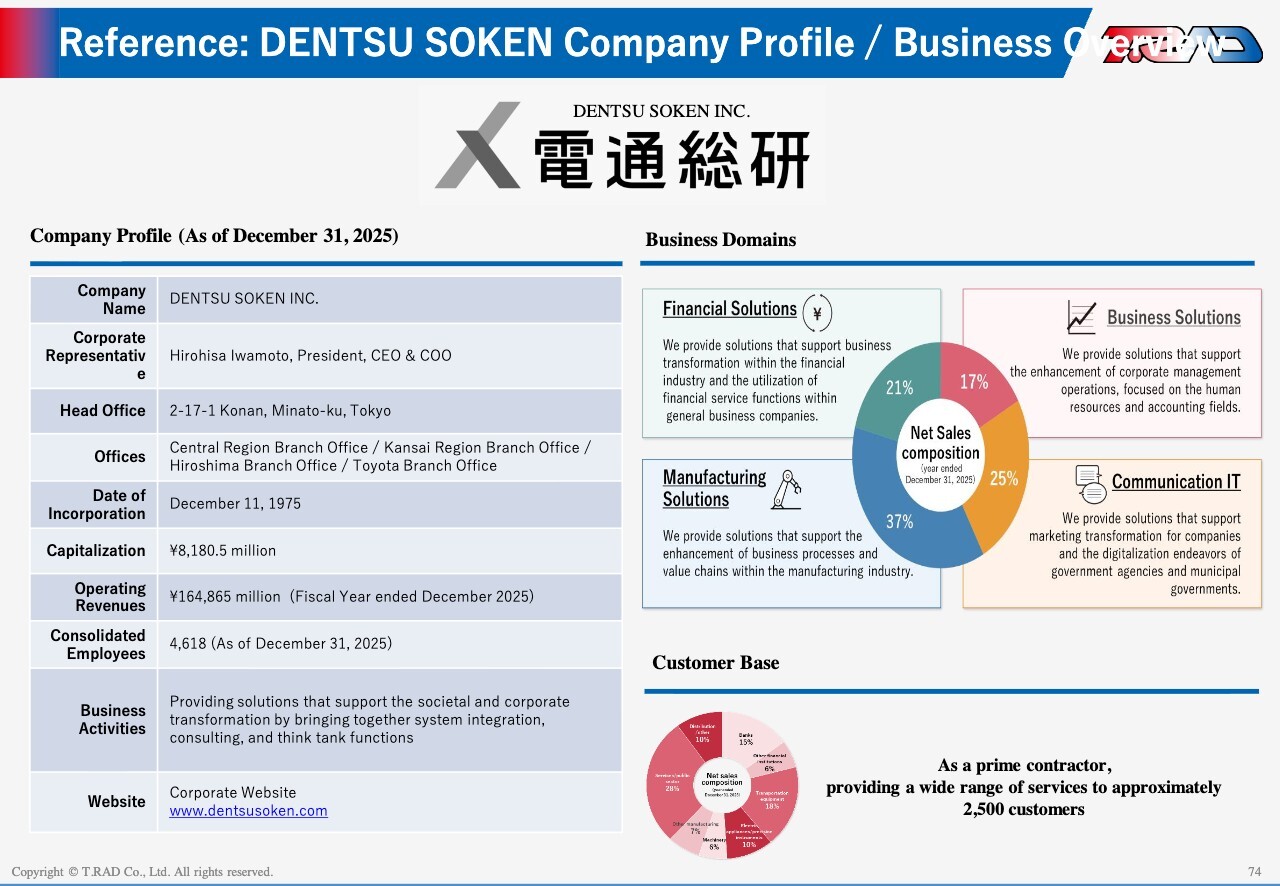
DENTSU SOKEN brings a strong customer base—approximately 500 manufacturing clients and 2,500 clients across all industries—enabling a robust go-to-market approach that combines our solutions with proven use cases.
In FY2025, our solutions have already been deployed by three companies and we are currently in discussions with an additional three prospective customers.
DENTSU SOKEN has approximately ¥160.0 billion in sales from its system integration business and around 4,600 engineers. Under this collaboration, DENTSU SOKEN provides these resources, while T.RAD contributes the track record and expertise it has developed in the manufacturing industry. This clear division of roles forms the basis for our collaboration.
T.RAD-2026 Equity Allocation Policy
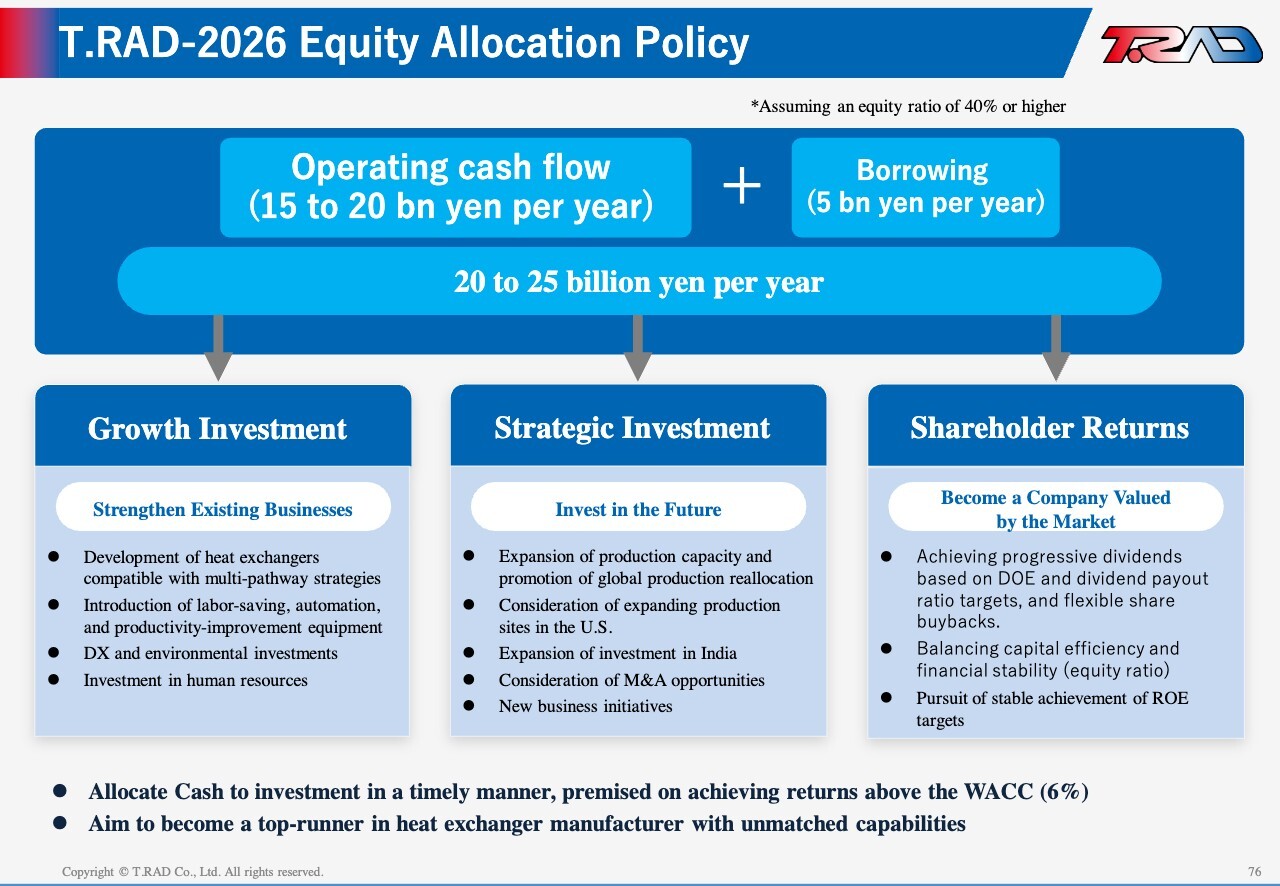
Next, let me address our approach to stable profitability.
We expect operating cash flow of ¥15 billion to ¥20 billion. Including adjustments to borrowings, we plan to allocate ¥20 billion to ¥25 billion annually to growth investments, strategic investments, and shareholder returns.
For growth investments, we will strengthen our core business by advancing multi-pathway technologies, promoting labor-saving and automation, and investing in equipment to improve productivity, as well as in DX and human capital. For strategic investments, we will focus on future growth by expanding global production capacity, increasing investment in the U.S. and India, and pursuing new business opportunities and potential M&A.
Regarding shareholder returns, we aim to become a company that is valued by the market and trusted by stakeholders. To this end, we will combine ROE and dividend payout ratio targets, progressive dividends, and flexible share buybacks.
T.RAD-2026 Shareholder Return Targets
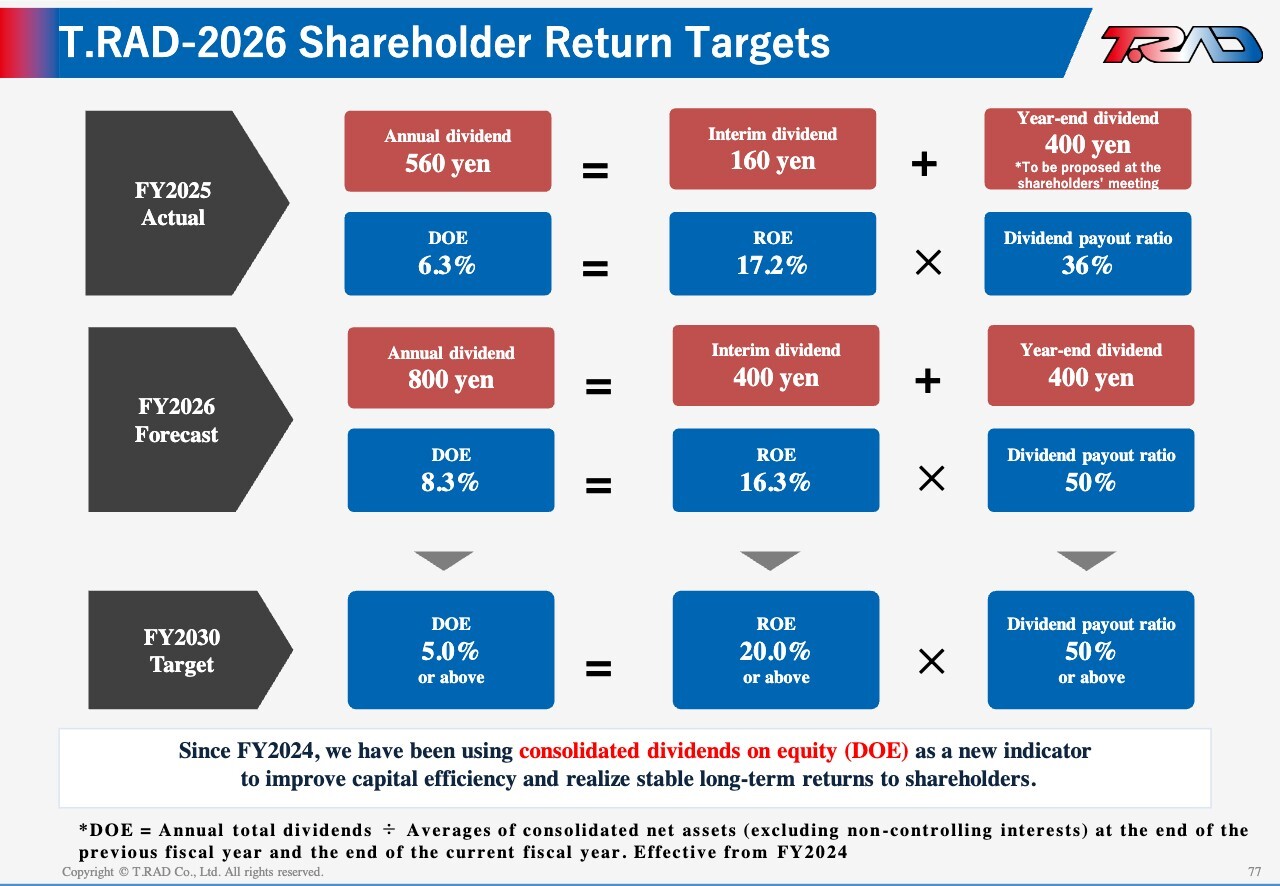
On shareholder return targets, we set the FY2025 year-end dividend at ¥400 per share, bringing the annual dividend to ¥560 per share. For FY2025, ROE was 17.2%, the dividend payout ratio was 36%, resulting in DOE of 6.3%.
For FY2026, we expect a progressive dividend with a floor of ¥400 per share, comprising an interim dividend of ¥400 and a year-end dividend of ¥400, for a total annual dividend of ¥800 per share. Based on this, we project ROE of 16.3%, a dividend payout ratio of 50%, and DOE of 8.3%. Going forward, we will strengthen shareholder returns with a policy of DOE of 5% or higher, a dividend payout ratio of 50% or higher, and progressive dividends.
T.RAD-2026 Management Targets and Shareholder Return Measures
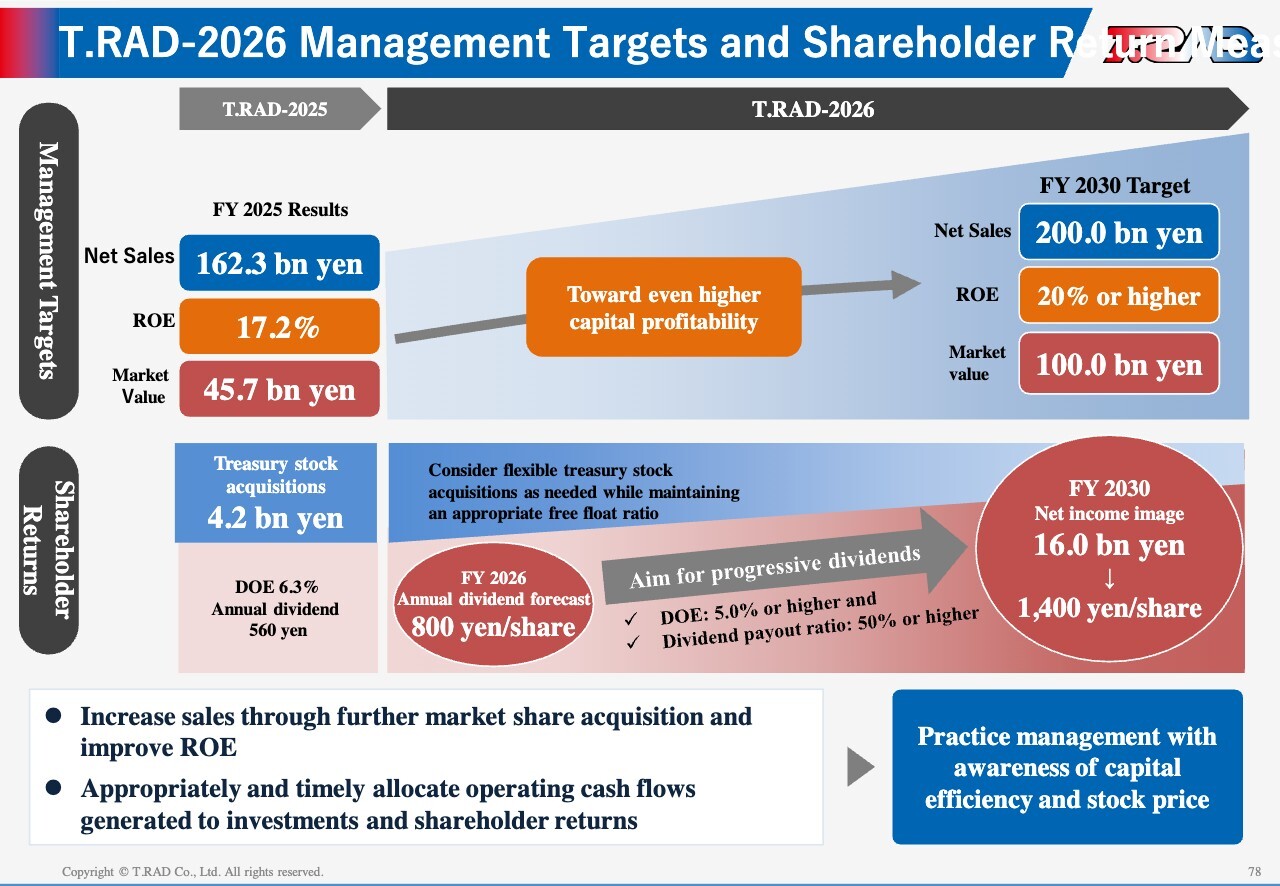
In FY2025, we executed share buybacks of ¥4.2 billion and paid an annual dividend of ¥560 per share, resulting in DOE of 6.3%. Looking ahead to FY2030, we target net sales of ¥200.0 billion, ROE of 20%, and a market capitalization of ¥100.0 billion, while further strengthening shareholder returns.
For FY2026, we plan an annual dividend of ¥800 per share and will increase dividends progressively. By FY2030, we aim to deliver net income of ¥16.0 billion and a dividend of ¥1,400 per share.
Initiatives to Increase Corporate Value
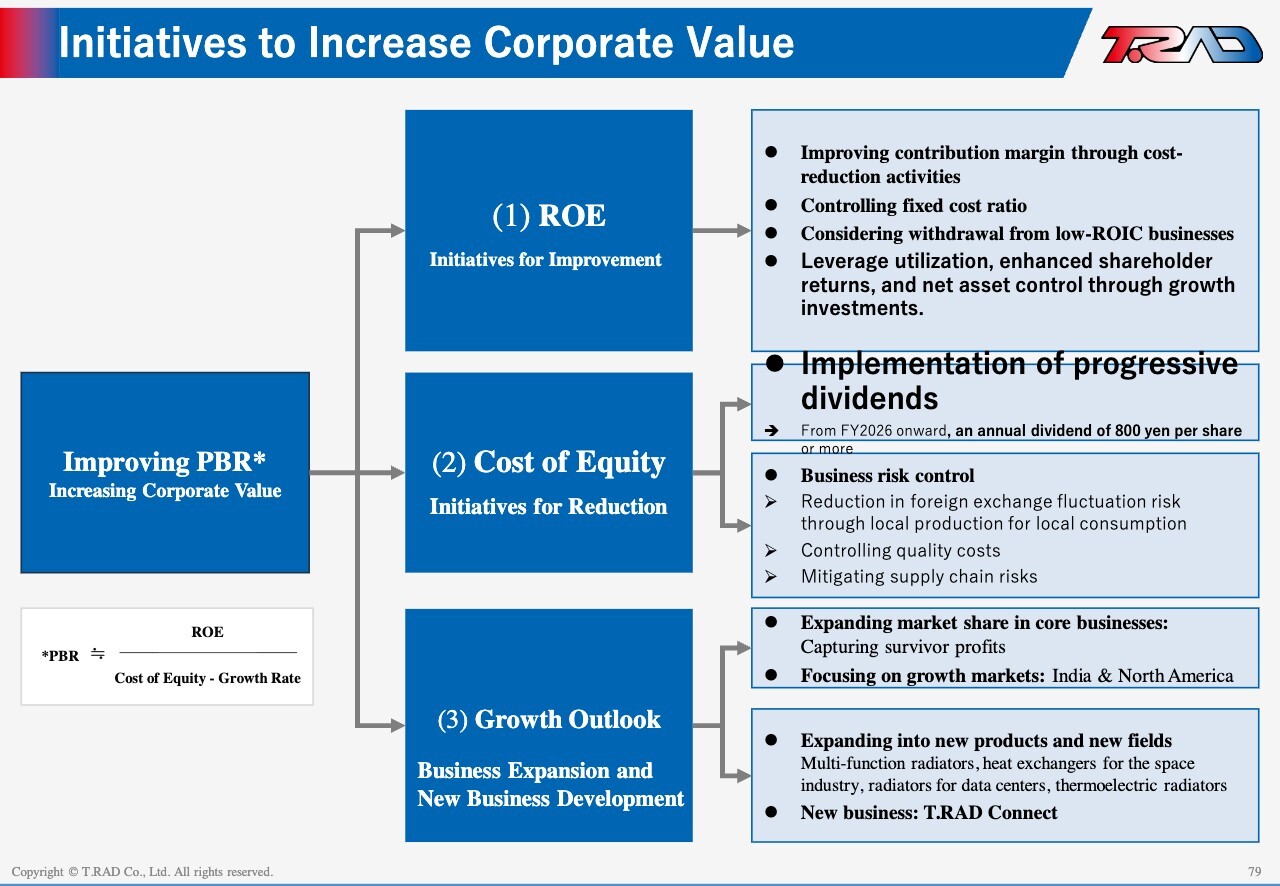
To enhance corporate value, we view sustained improvement in PBR as critical. To achieve this, we focus on three key drivers: improving ROE, reducing cost of equity, and increasing growth and growth outlook. We are executing specific initiatives under each of these areas.
To improve ROE, we will enhance contribution margins through cost reductions, control fixed costs, and review potential exits from low-return businesses. We will also utilize leverage through borrowings, strengthen shareholder returns, and manage net asset control through disciplined growth investments.
To reduce the cost of equity, we will maintain stable earnings and consistent shareholder returns despite the cyclical nature of the automotive industry, thereby strengthening market confidence and lowering our capital equity. As part of this approach, we have set a progressive dividend target of ¥800 per share annually.
To reduce business risk, we will promote local production for local consumption to mitigate tariff and foreign exchange risks, prevent quality issues to control quality-related costs, and mitigating our supply chain risks.
To enhance growth outlook, we will expand market share in our core businesses while increasing our focus on high-growth markets such as India and North America. At the same time, we will drive new growth by expanding into new products and fields, including space and data center applications.
Promoting T.RAD-2026 Employee Stockholders
Next, let me explain our initiative to promote “employee shareholders.”
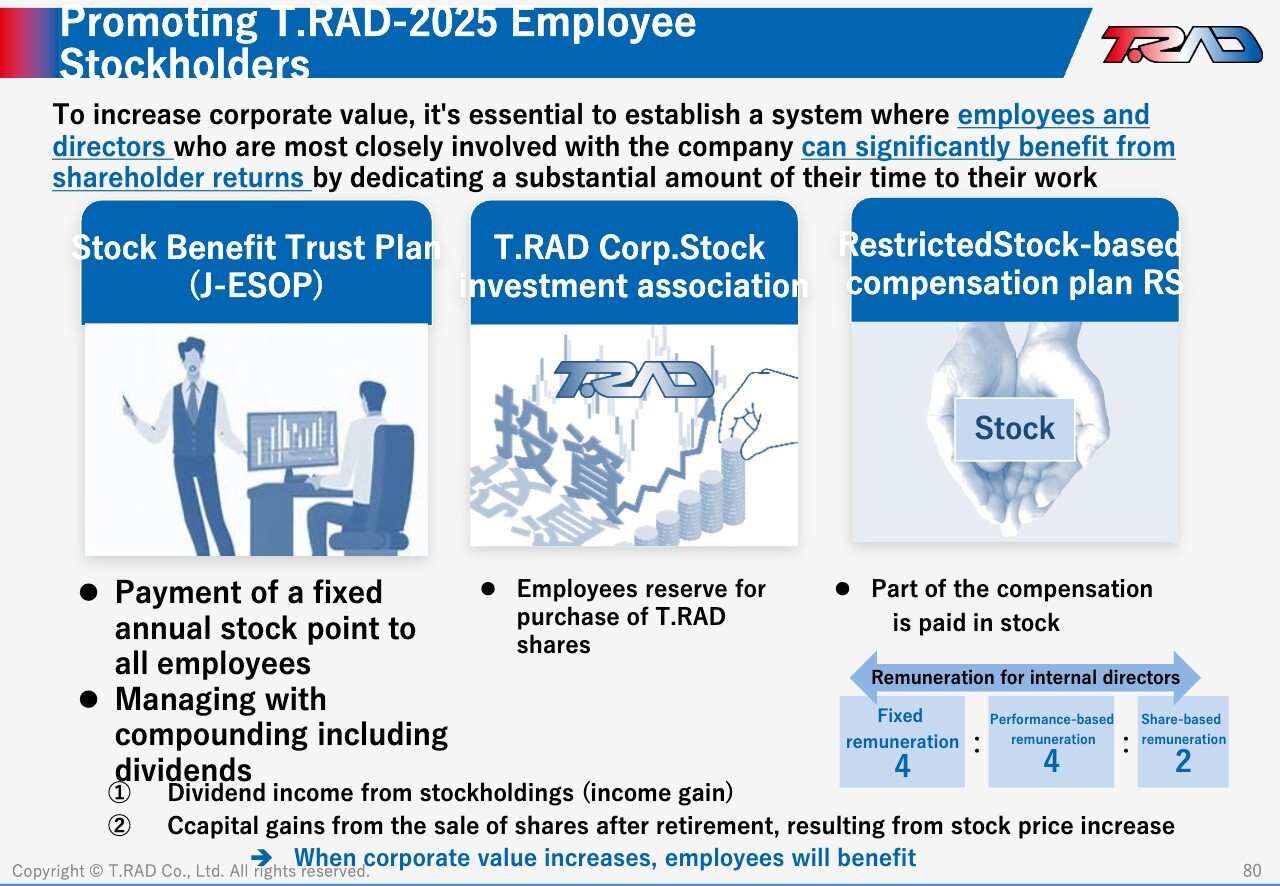
We believe it is important for employees and executives to share value with shareholders. To support this, we have introduced a stock benefit trust plan, or J-ESOP, for all employees. Under this program, we grant points to employees, and their shareholdings increase on a compounded basis, including dividends.
We also use an employee stock ownership plan and restricted stock (RS) compensation plan for executives to align incentives and drive value creation from a shareholder perspective.
Compensation for internal directors is structured with an approximate ratio of 40% fixed remuneration, 40% performance-linked remuneration, and 20% share-based remuneration, placing strong emphasis on share price and performance alignment. This structure ensures that both employees and executives take responsibility for enhancing corporate value and share in future returns.
Initiatives to Enhance IR Activities (FY2025)
Next, let me outline how we are strengthening our IR activities.
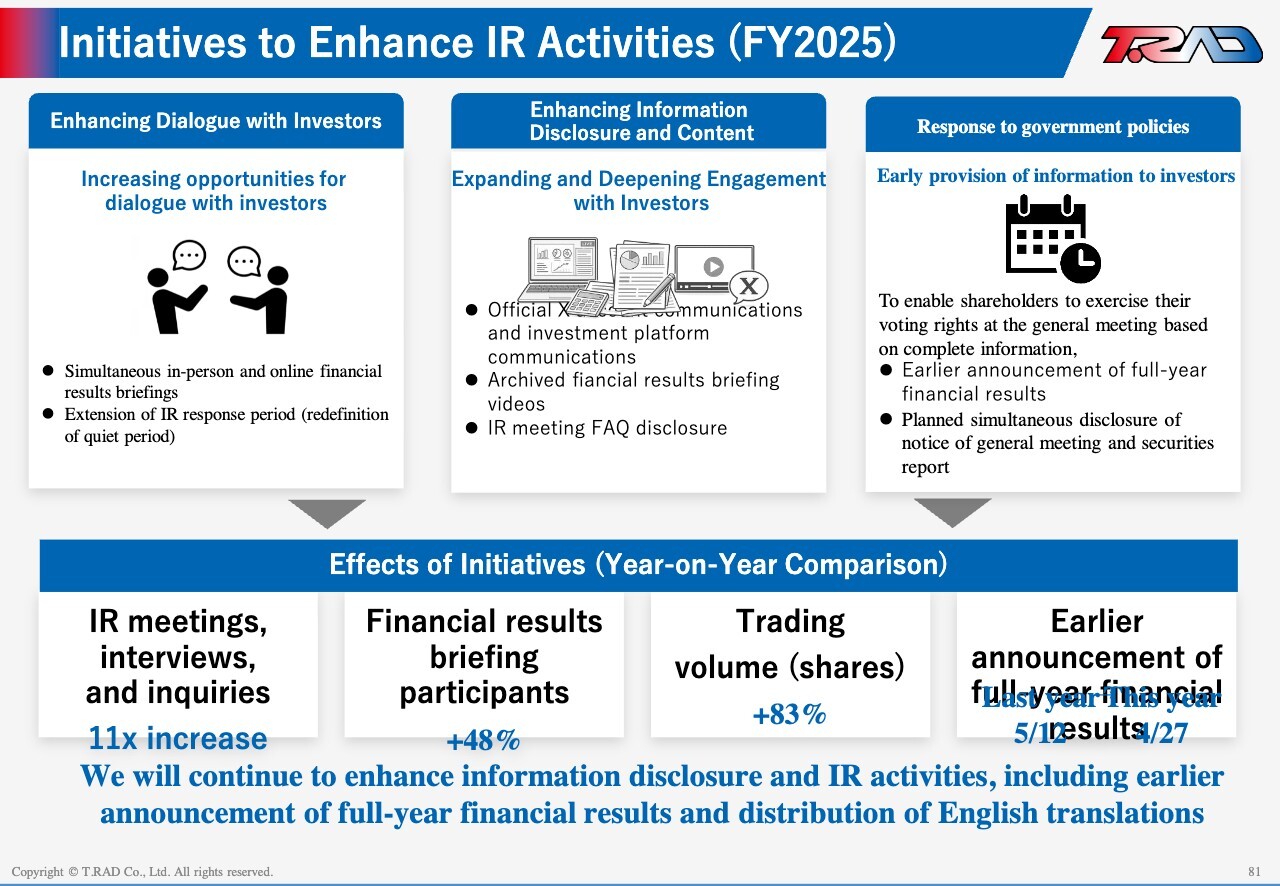
In FY2025, we expanded engagement with investors by increasing opportunities for dialogue, strengthening online meetings, and enhancing our IR activities. We also broadened our disclosure content through social media and video distribution of our finical results briefings.
In addition, to enhance the timeliness of investor disclosure, we plan to begin releasing our annual securities report concurrently with the notice of the annual general shareholders’ meeting starting this fiscal year.
As a result, the number of IR meetings and media inquiries increased 11-fold year on year, and participation in our finical results briefings rose by 48%. Annual trading volume also increased by 83%.
We also brought forward our finical results disclosure by more than two weeks from the previous year and released it on April 27. We will continue to further strengthen our disclosure practices and IR activities.
Summary
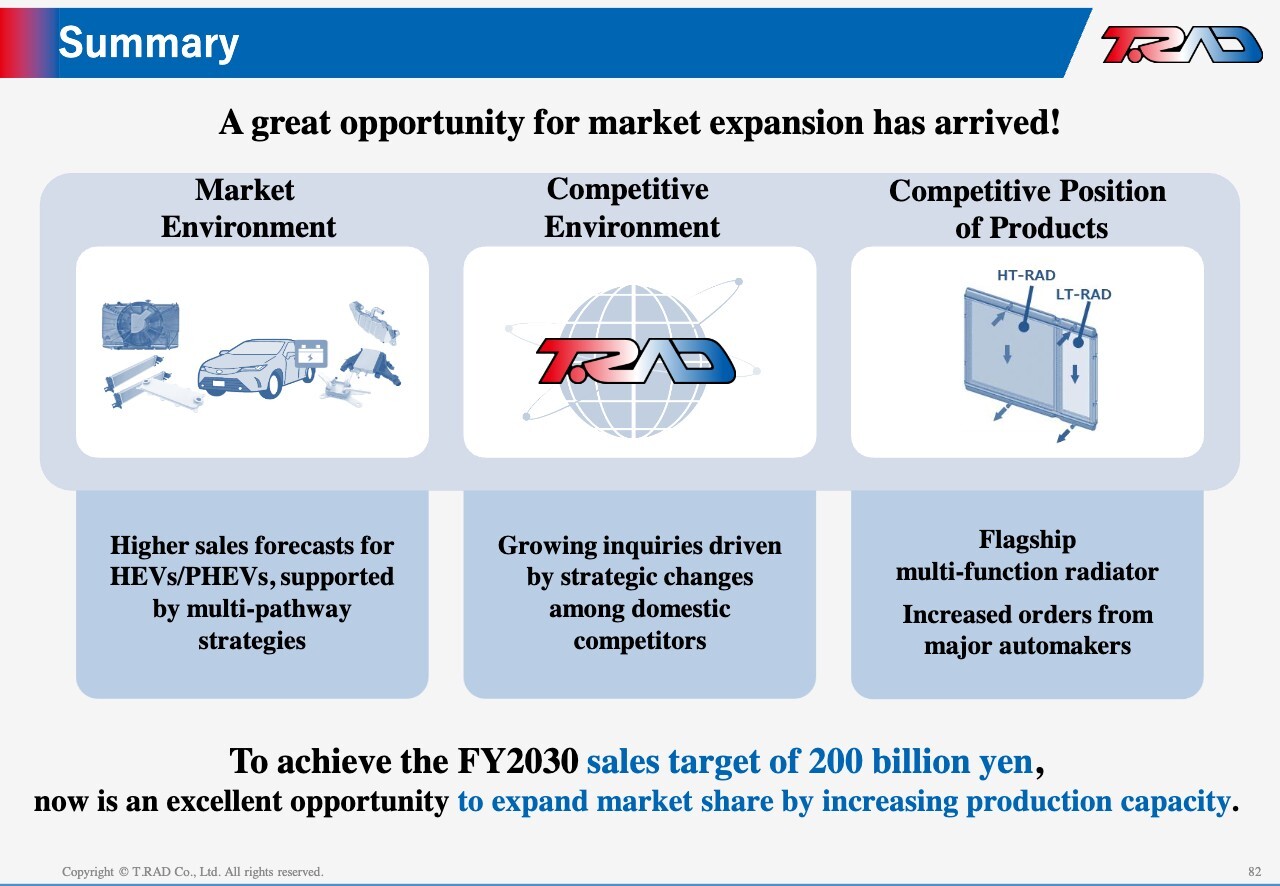
In summary, we believe we are currently operating in a highly favorable environment across the market, competitive landscape, and product portfolio.
As the shift to a multi-pathway approach drives growth in HEVs, some competitors have strategically deprioritized heat exchangers. Against this backdrop, inquiries to us have increased significantly. At the same time, we have successfully developed multi-function radiators and secured new orders, positioning us to capture a meaningful growth opportunity.
We will mobilize the entire organization to achieve our FY2030 net sales target of ¥200.0 billion.
Q&A: Impact of the Middle East Situation
Moderator: Please explain the currently anticipated impact of the Middle East situation on your P/L and B/S, as well as your future response measures. In addition, please provide your outlook for the current fiscal year in light of rising crude oil prices, including naphtha.
Kinoshita: We are closely monitoring price trends of key materials such as aluminum, copper, and resins. However, as we have established frameworks with customers to pass through material price fluctuations, and given the difficulty in forecasting future price trends, such impacts have not been incorporated into our earnings forecast for FY2026 at this time. We do not currently foresee any issues with material procurement itself, nor do we anticipate any balance sheet impact, such as inventory buildup. We will continue to closely monitor market developments going forward.
Q&A: Management Targets for FY2030
This is a question regarding T.RAD-2026 management targets and shareholder return policies.
Moderator: In the Mid Term Management Plan, you set a FY2030 market capitalization target of ¥100.0 billion. However, based on the assumptions for net income and net assets, the implied valuation metrics—such as PER, PBR, and dividend yield—appear relatively low. Could you explain the background behind this?
Miyazaki: This target was set as the minimum level we believe we must achieve, taking into account the need to stably maintain the Prime Market listing criteria and to reach the level required for selection under the new TOPIX criteria. We recognize that share prices are determined by the market. At the same time, in addition to further strengthening our IR activities, we will work to enhance corporate value, or PBR, through specific initiatives in three areas: improving ROE, reducing the cost of capital, and executing our growth strategy.
Q&A: Multi-function Radiators
Moderator: The market potential for multi-function radiators is estimated at approximately 6.1 million units. However, there appears to be a gap between this potential and your FY2030 targets of ¥200.0 billion in net sales and a 4.3% CAGR. Could you explain the reason for this gap?
Miyazaki: The figure of 6.0 million units shown in the materials is based on our outlook through around 2035. Taking into account the competitive landscape, we have set an order target of approximately 2.2 million units for FY2030. For multi-function radiators, product adoption requires a certain lead time, so we expect orders to expand gradually in stages. Over the medium to long term, we believe this area offers significant growth potential.
Q&A: About New Business Areas
Moderator: For new areas such as data centers, AI, and humanoid, what is the expected timeline to commercialization and meaningful profit contribution?
Miyazaki: In the data center field, our products may be applied both to heat sinks used for cooling server CPUs and to heat exchangers for emergency power generation systems essential for stable data center operations (such as radiators and charge air coolers for diesel engines).
For the former, copper heat sinks are currently widely used; however, we believe that aluminum heat sinks may be increasingly adopted in the future to reduce costs, and that our products—leveraging out mass production experience in automotive inverter heat sinks—have the potential to be adopted. For the latter, we already have a track record of adoption and mass production of our heat exchangers, and we plan to expand production in line with growing data center demand.
In the humanoid field, we believe that technologies cultivated through inverter heat sinks can be utilized.
In the space field, our cooling and heating technologies can be applied to extreme environments ranging from approximately -180°C to 100°C, and we are currently engaged in initial discussions with potential partners.
We expect contributions to earnings from the data center, humanoid, and space-related fields in approximately 5–10 years.
Q&A: Questions from Webinar Participants (1)
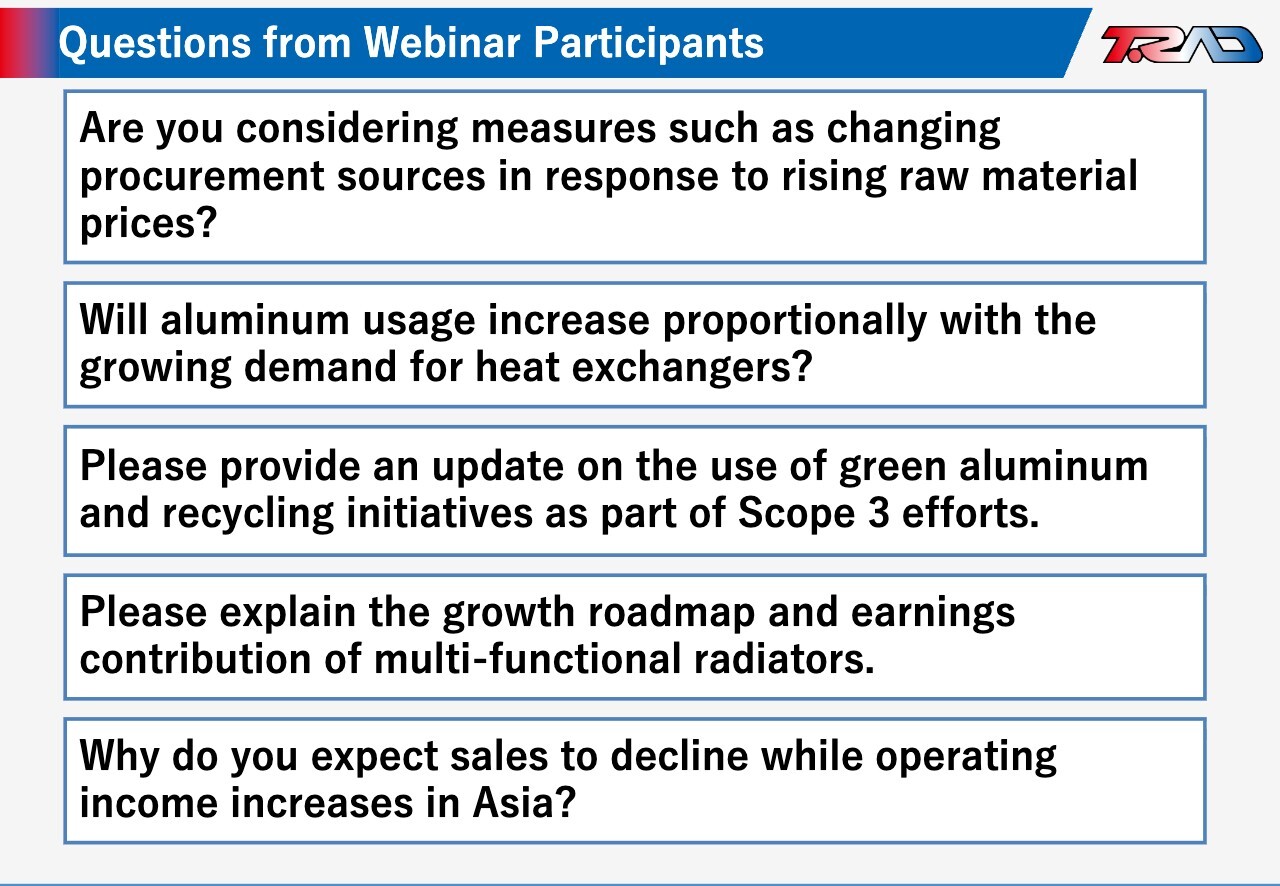
Moderator: With aluminum and other material prices rising due to developments in the Middle East, are you considering measures such as changing procurement sources?
Kinoshita: At present, we do not anticipate any disruptions to procurement of key materials. Regarding aluminum supply, we understand that the Middle East accounts for approximately 9% of global market share, and we do not currently procure aluminum from the region. While some petroleum-based products from the Middle East have become more difficult to obtain, we are working closely with customers to implement countermeasures, including the consideration of alternative materials.
Q&A: Questions from Webinar Participants (2)
Moderator: As demand for heat exchangers is expected to increase both in Japan and overseas, do you expect aluminum usage to rise in line with higher unit volumes?
Miyazaki: While aluminum usage increases with higher production volumes, we are simultaneously promoting material reduction through product downsizing and thinner designs. Therefore, usage will not increase strictly in proportion to volume growth. Optimizing material usage is a key factor in strengthening cost competitiveness, and we will continue these efforts.
Q&A: Questions from Webinar Participants (3)
Moderator: How do you plan to expand the use of low-carbon aluminum as part of your Scope 3 initiatives? Also, how are you advancing aluminum recycling efforts?
Miyazaki: Although there are cost challenges associated with green aluminum, its adoption is gradually progressing on the premise of cost sharing across customers and the broader supply chain. Regarding the recycling of aluminum and other materials, there are technical challenges, particularly for multilayer materials where full circularity is difficult to achieve. We will continue to explore resource circulation, including reuse in other applications.
Q&A: Questions from Webinar Participants (4)
Moderator: For multi-function radiators, you have set an ambitious order target. Could you provide more detail on the roadmap to achieve it? Also, how much contribution do you expect from multi-function radiators to sales and profit in FY2030?
Miyazaki: We expect production of approximately 2.2 million units by FY2030, with projected sales of approximately ¥10.0 billion. This is expected to account for around 20% of our overall radiator business. We are also receiving increased inquiries from OEMs and will aim to expand orders by strengthening cost competitiveness and supply capabilities.
Q&A: Questions from Webinar Participants (5)
Moderator: In your forecast for the next fiscal year, net sales in Asia are expected to decline while operating income is projected to increase. Could you explain the reasons behind this?
Kinoshita: The decline in sales is partly due to reduced sales to group companies in regions such as the United States. The increase in operating income is expected to be driven by an improved product mix with a higher proportion of high-margin products such as EGR coolers, as well as the effects of productivity improvements and cost reduction initiatives.