Growth cycle driven by “Internal Growth” & “Return of Gain on Sales”
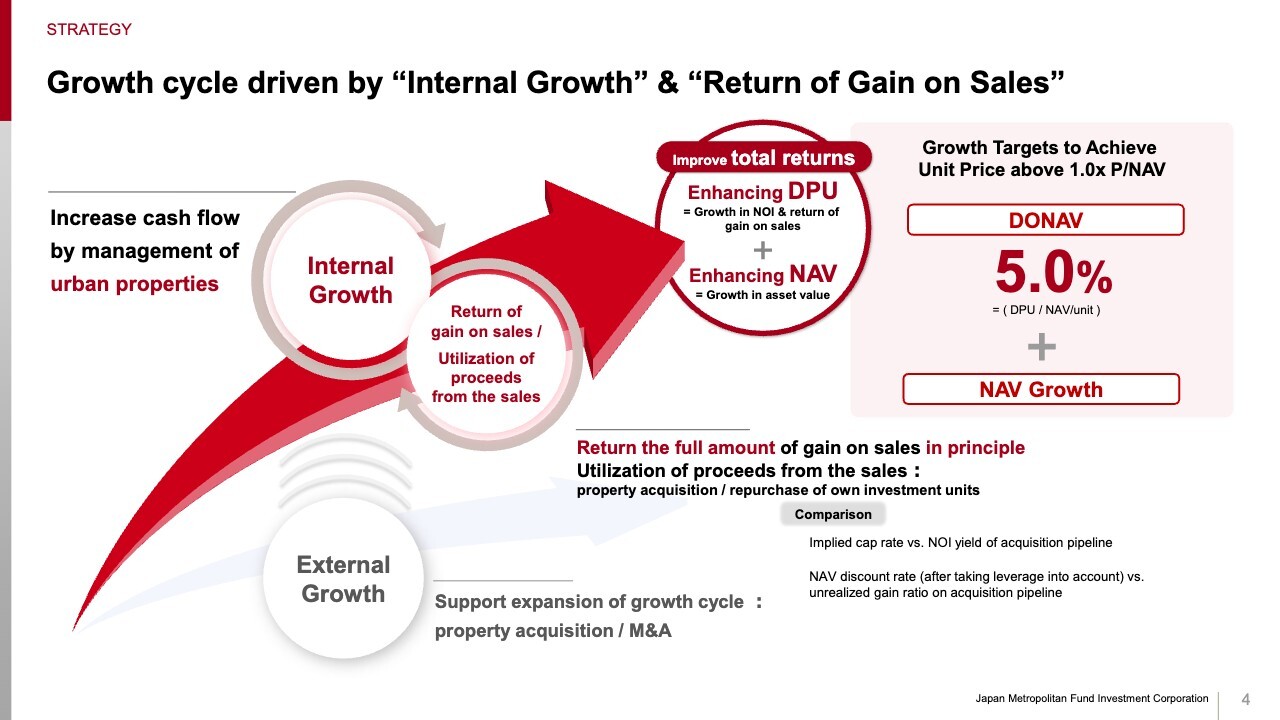
Mr. Takuya Machida (“Machida”): I am Takuya Machida from KJR Management, responsible for managing Japan Metropolitan Fund Investment Corporation (“JMF”). Today, I will walk you through JMF’s financial results for the 48th fiscal period. This slide outlines JMF’s current growth strategy and the quantitative targets we have already disclosed.
Significant progress toward achieving DONAV 5% + NAV Growth
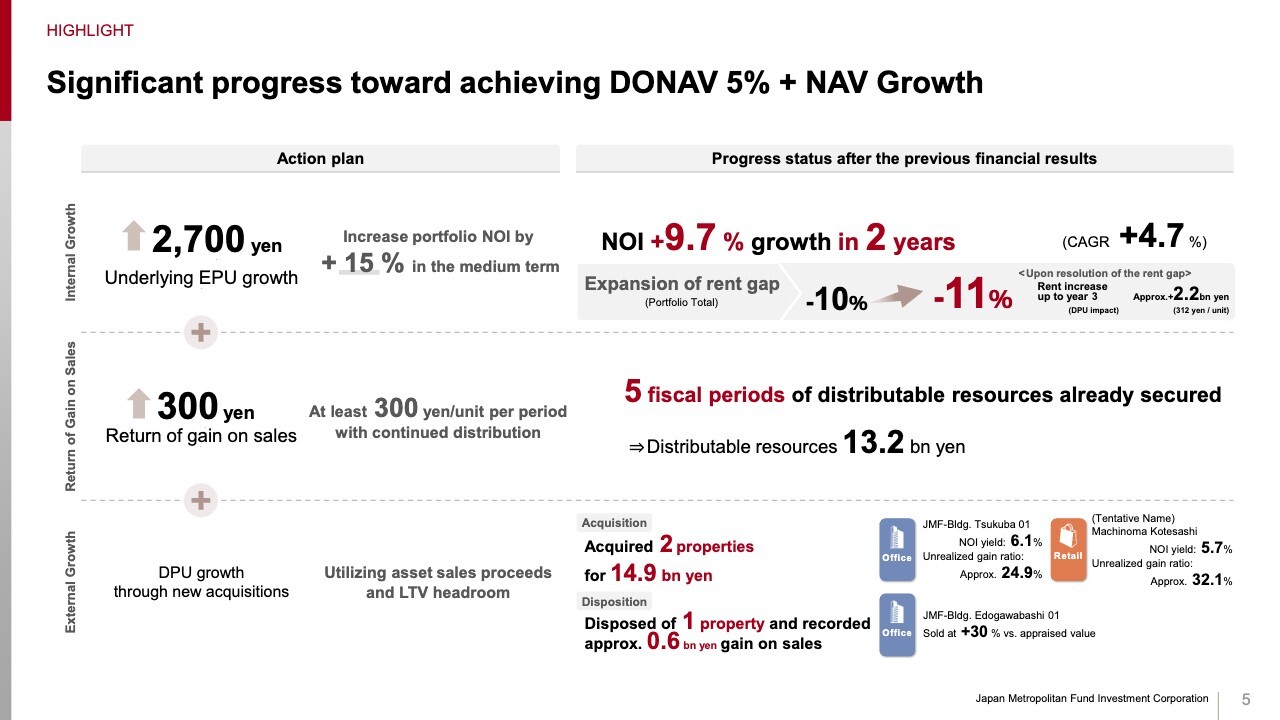
Let me begin with our progress against those targets. To achieve these goals, we are pursuing three key initiatives: raising portfolio NOI by 15% over the medium term, returning at least 300 yen per unit each period through return of gains on sales, and driving further earnings growth through asset replacements and effective use of LTV headroom.
First, NOI is expected to increase from 29.2 billion yen in the 46th fiscal period to a forecast of 32.1 billion yen in the 50th fiscal period, representing growth of 9.7% over two years, or 4.7% on an annualized basis, marking a significant increase. We have also secured meaningful upside from the 51st fiscal period onward, so we are making steady progress toward our 15% target.
Next, regarding the return of gains on sales, as explained in the previous period, we have already secured distributable resources equivalent to 300 yen per unit for each fiscal period through the 53rd fiscal period ending August 2028. We are also planning additional asset sales from the 50th fiscal period onward and intend to further build up these distributable resources.
Finally, on external growth. We sold office assets with unrealized losses and limited upside, and acquired 15.0 billion yen of assets that offer both higher yields and future growth potential. We have achieved an improvement in DPU through asset replacement.
As you can see, we are making solid progress toward our targets across internal growth, return of gains on sales, and external growth.
Looking ahead, we will aim to achieve these targets by driving internal growth through closing the portfolio rent gap, which has widened to 11% as market rents have risen; pursuing asset sales focused on realizing gains; and continuing CRE carve-outs, while making disciplined acquisitions from the real estate market that leverage JMF’s unique strengths.
DPU reached 3,000 yen, driven by internal growth and Return of Gain on Sales Underlying EPU +4.5% and Total Return 13.8% (48th FP)
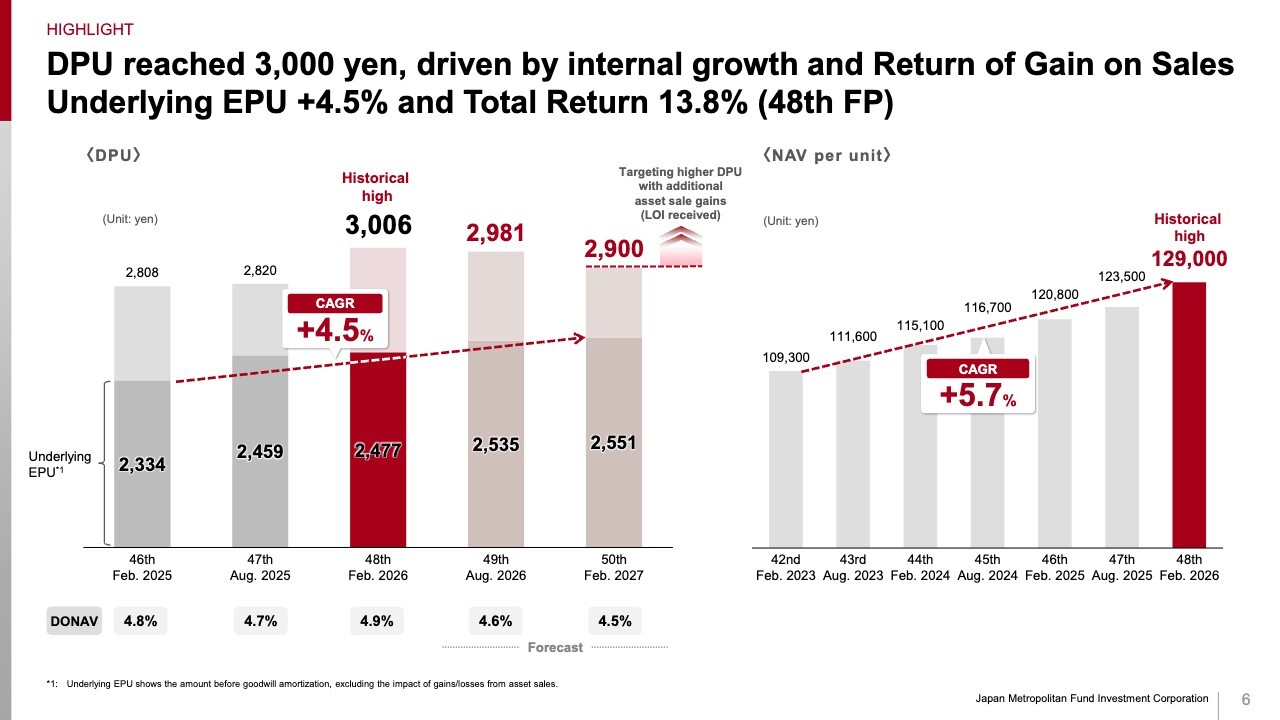
DPU for the 48th fiscal period was 3,006 yen, up 6.6% from the previous period, surpassing the 3,000 yen milestone for the first time and reaching a new record high. For the 49th fiscal period, we now forecast DPU of 2,981 yen, a significant increase from the previously announced forecast of 2,850 yen.
For the 50th fiscal period, we forecast DPU of 2,900 yen. We have already received an LOI for an asset sale, and if that transaction is completed, this would bring DPU to roughly the same level as in the 49th fiscal period.
NAV per unit also increased, rising 4.5% from the previous period to 129,000 yen. This was achieved despite returning unrealized gains through asset sales, supported by higher appraised values driven by NOI growth, as well as the acquisition of FUJI SOFT’s office portfolio, which carries substantial unrealized gains.
On an underlying EPU basis, which adds back goodwill amortization to net income and excludes the impact of gains/losses from asset sales, we expect approximately 9% growth, from the 2,300 yen range in the 46th fiscal period to around 2,550 yen in the 50th fiscal period, despite the rising interest rate environment. The main driver is the NOI growth I discussed earlier.
Roadmap to DPU 3,000 yen + α
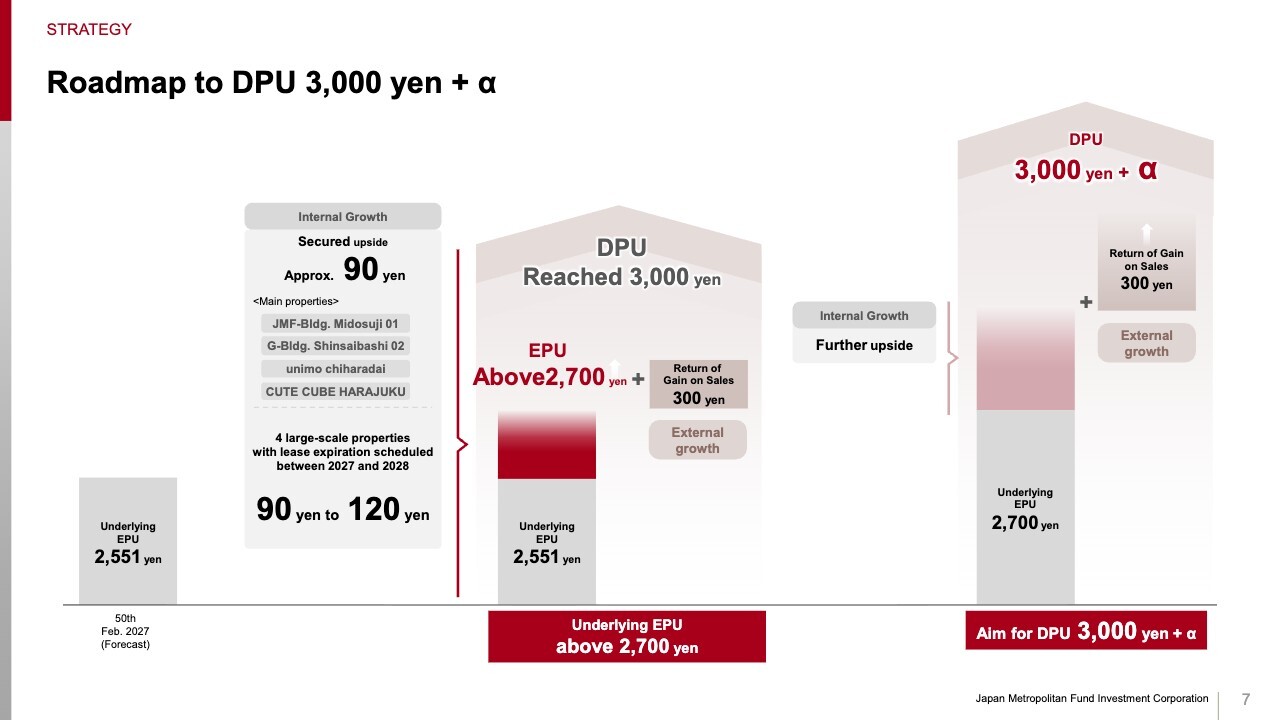
As I mentioned, our underlying EPU as of the 50th fiscal period is expected to be around 2,550 yen. However, we have multiple sources of rent upside already secured from the 51st fiscal period onward, including JMF-Bldg. Midosuji 01, G-Bldg. Shinsaibashi 02, and unimo chiharadai. Including these upside drivers, underlying EPU is already at a level that puts us in the mid-2,600 yen range.
On top of that, if upside from the four large properties with lease expirations in 2027 and 2028 is realized, including G-Bldg. Omotesando 02 and Ario Otori, where we are already in active negotiations, then even after factoring in higher debt costs from rising interest rates, underlying EPU should clearly exceed 2,700 yen based on these projects alone.
We have already secured the 300 yen per unit return of gains on sales, bringing DPU of 3,000 yen well within reach. In addition, meaningful rent gaps remain not only for the confirmed upside and the four large-scale properties, but also across other assets in the portfolio. As a result, underlying EPU has the potential to exceed 2,700 yen by a significant margin.
In addition to steadily capturing these upside opportunities, we will continue to enhance underlying EPU through external growth and return gains on sales. We believe this puts us in a position where achieving DPU above 3,000 yen is fully realistic.
Aiming to raise DPU distributions through maximizing gain on sales
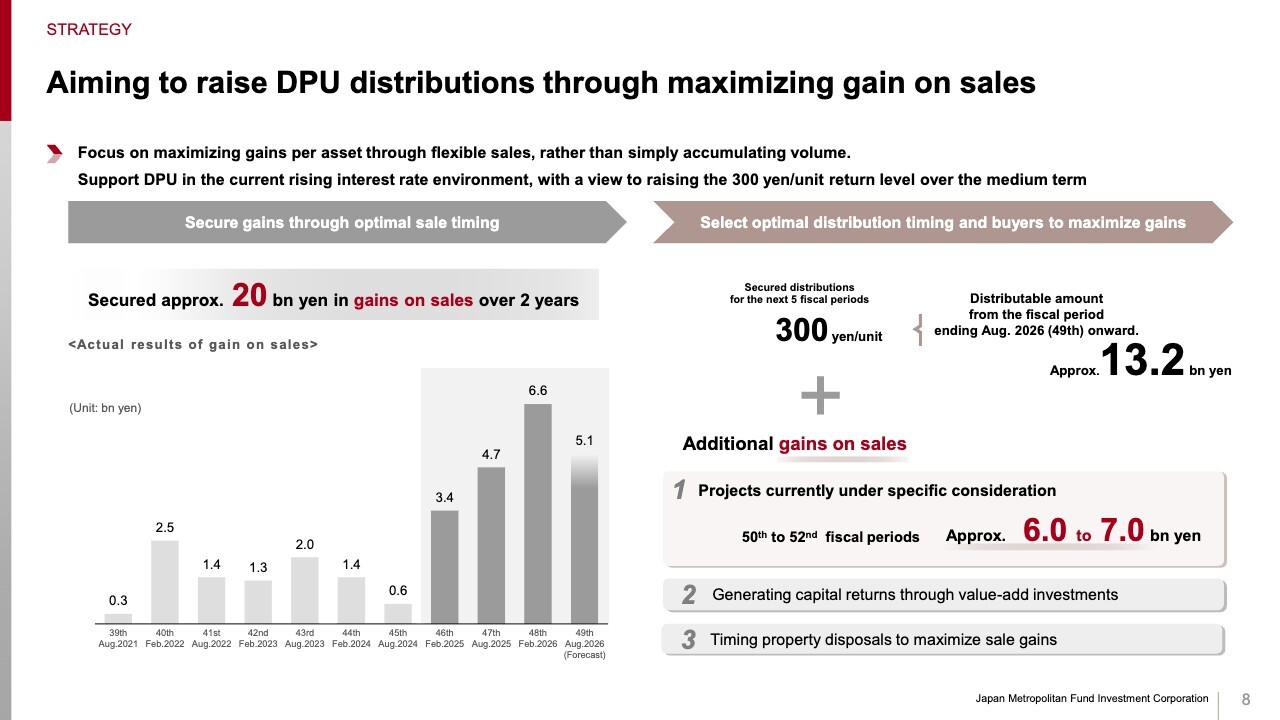
Let me explain our policy on returning gains on sales. Since becoming JMF through the merger, we have continued to execute asset sales and have steadily recorded gains on sales for 10 consecutive fiscal periods. In particular, we accelerated asset sales from the 46th through the 49th fiscal periods and expect to record approximately 20.0 billion yen in gains on sales over this period.
For the 50th fiscal period onward, no gains on sales have been secured at this point. That said, we are currently progressing disposals that could generate gains of 6.0 billion yen to 7.0 billion yen from the 50th through the 52nd fiscal periods, and some of these assets are already under active negotiations.
In principle, we intend to return all profits generated from these sales to unitholders and steadily deliver higher DPU over the medium term.
External growth driven by KJRM’s acquisition capabilities - next driver of EPU growth
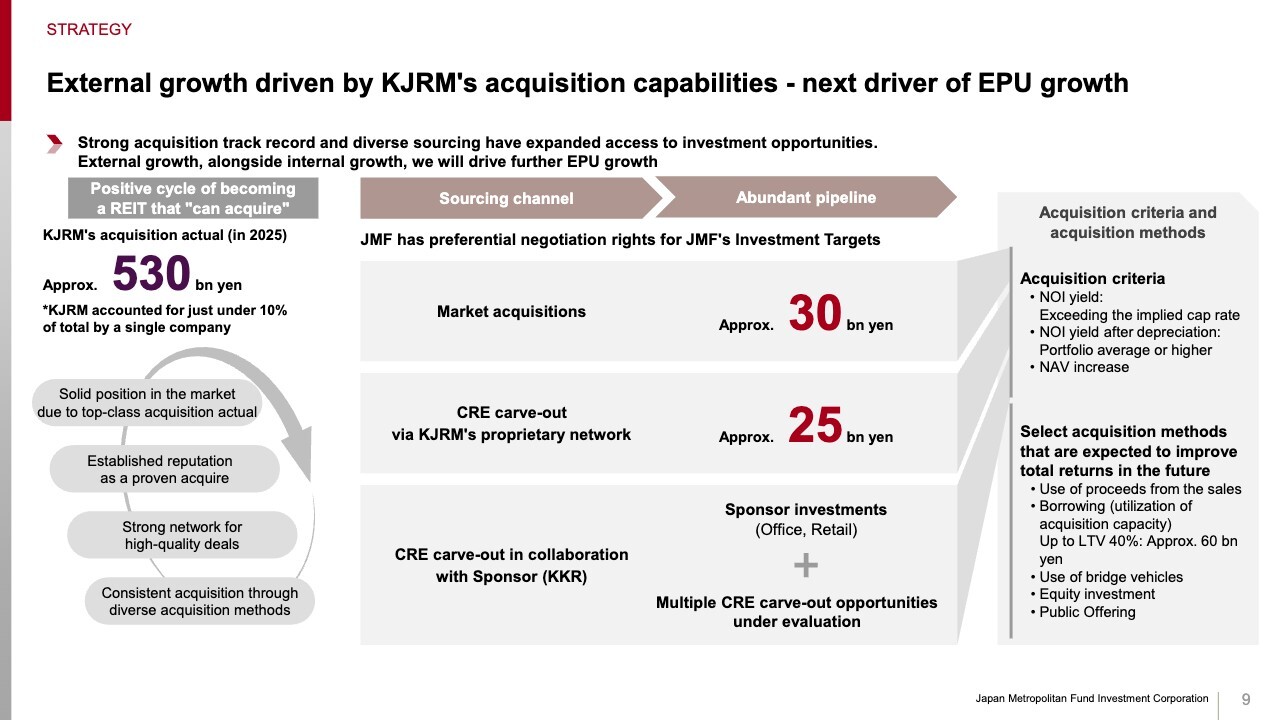
Let me move on to external growth.
Last year, the KJRM Group acquired approximately 530.0 billion yen of real estate. With annual real estate transaction volume in Japan estimated at around 6 trillion yen, this represents roughly a 10% market share.
Behind our ability to consistently execute acquisitions of this scale is a unique approach that sets us apart from other companies.
Specifically, this includes CRE carve-outs executed jointly with our sponsor KKR, as well as KJRM’s own proprietary CRE carve-outs leveraging the know-how built through these efforts. We also have a disciplined process to screen a large number of opportunities and focus on assets that are attractively priced and offer clear upside.
In addition, our proven track record of executing large transactions has established us in the market as a buyer that can get deals done.
As a result, we continue to receive a broad range of opportunities, including strong deal flow, direct inquiries from property owners, and collaboration proposals at the acquisition stage. This has created a virtuous cycle that drives further acquisitions.
At JMF, we carefully select the assets that meet our investment criteria from this broad opportunity set. We already have a pipeline of roughly 30.0 billion yen sourced from the market and approximately 25.0 billion yen from our own CRE carve-outs. In addition, while we cannot disclose the amount, we have also built a pipeline through CRE carve-outs with KKR.
Several additional projects with KKR are progressing off-market, and we will continue to steadily expand our pipeline under disciplined investment approach.
We have ample investment capacity through future asset sales and available LTV headroom. We can also use bridge funds and bridge vehicles, and where appropriate, shift to equity-style investments to improve capital efficiency.
Given our ample investment capacity and flexibility to use bridge structures, we will consider equity issuance only if both DPU and NAV improve meaningfully, and once the market appropriately reflects expectations for external growth in the unit price.
Advance to the next stage of growth with JMF’s unique “Diversified Premium”
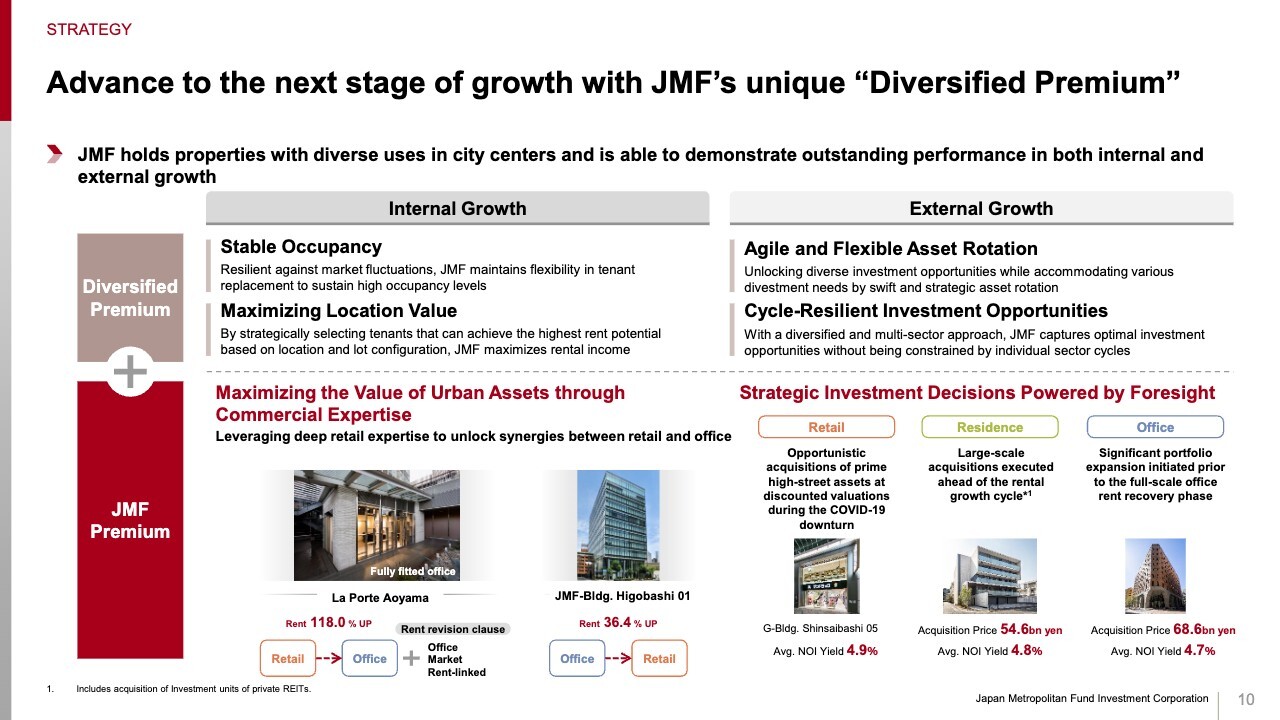
The diversified REIT premium and the JMF premium that we discussed in the previous period continue to show through clearly this period as well. For example, La Porte Aoyama, an urban retail property, we converted space in a retail zone that was constrained from a traffic-flow perspective and therefore difficult to lease at attractive rents into fitted office space.
As a result, we achieved a 118% increase versus the previous rent and also succeeded in introducing an automatic rent revision clause linked to the office market.
At JMF-Bldg. Higobashi 01, we focused on the retail potential of the lower floors and optimized the use mix through retail leasing, which resulted in a 36% increase in rent versus the previous level.
From an external growth perspective, we are also strategically evaluating acquisitions at attractive prices that can generate strong long-term returns. This includes residential assets in the Nagoya area, where the transaction market has temporarily stalled due to supply-demand imbalances. It also includes well-located retail properties, where long-term leases limit near-term upside and valuations are relatively subdued in an inflationary environment.
By continuing to deliver internal and external growth that sector-focused REITs cannot easily replicate, we intend to further demonstrate the value of the diversified REIT premium.
Factors affecting DPU : 48th Fiscal Period ended Feb. 2026 (forecast vs. actual)
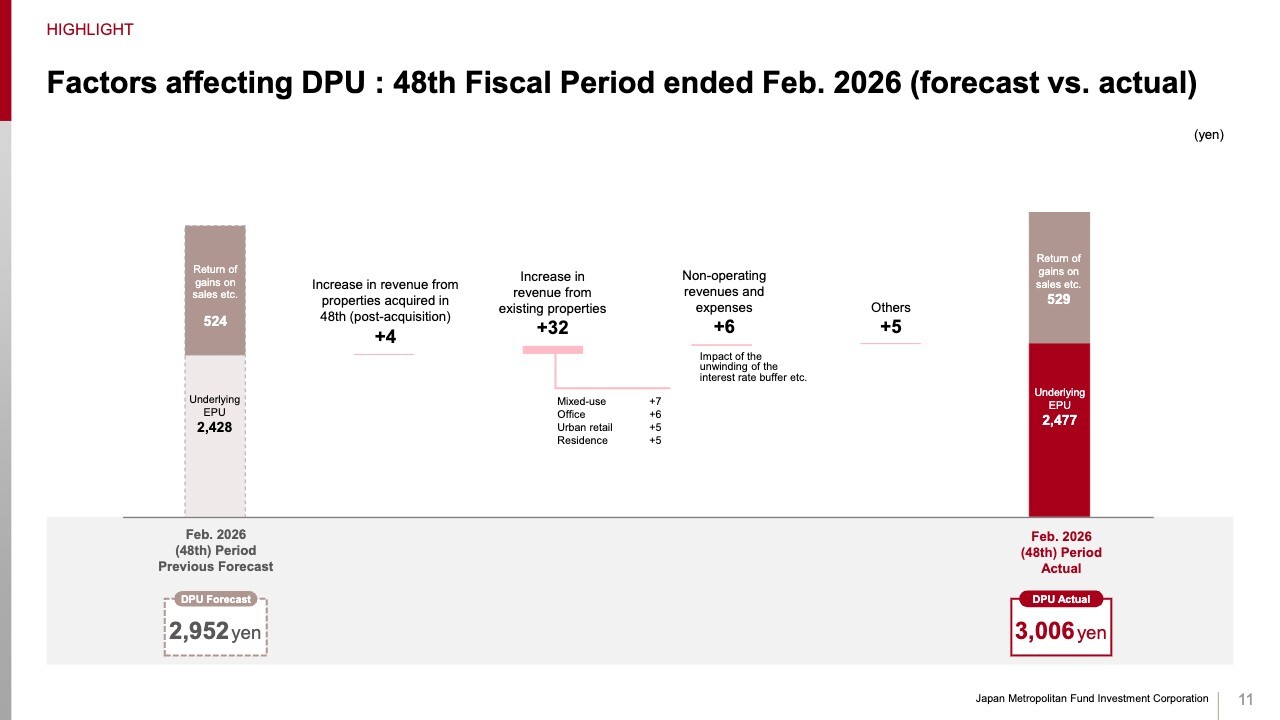
Let me now turn to the key drivers behind the changes in DPU for the actual results for the 48th fiscal period and our forecasts for the 49th and 50th fiscal periods.
For the 48th fiscal period, DPU came in at 3,006 yen, which was 54 yen above the previously announced forecast of 2,952 yen. Looking at the main drivers on an underlying EPU basis, the upside primarily came from stronger-than-expected revenue from properties acquired in the 48th fiscal period, as well as revenue growth from existing properties.
Factors affecting DPU : Aug. 2026 and Feb. 2027 Forecast
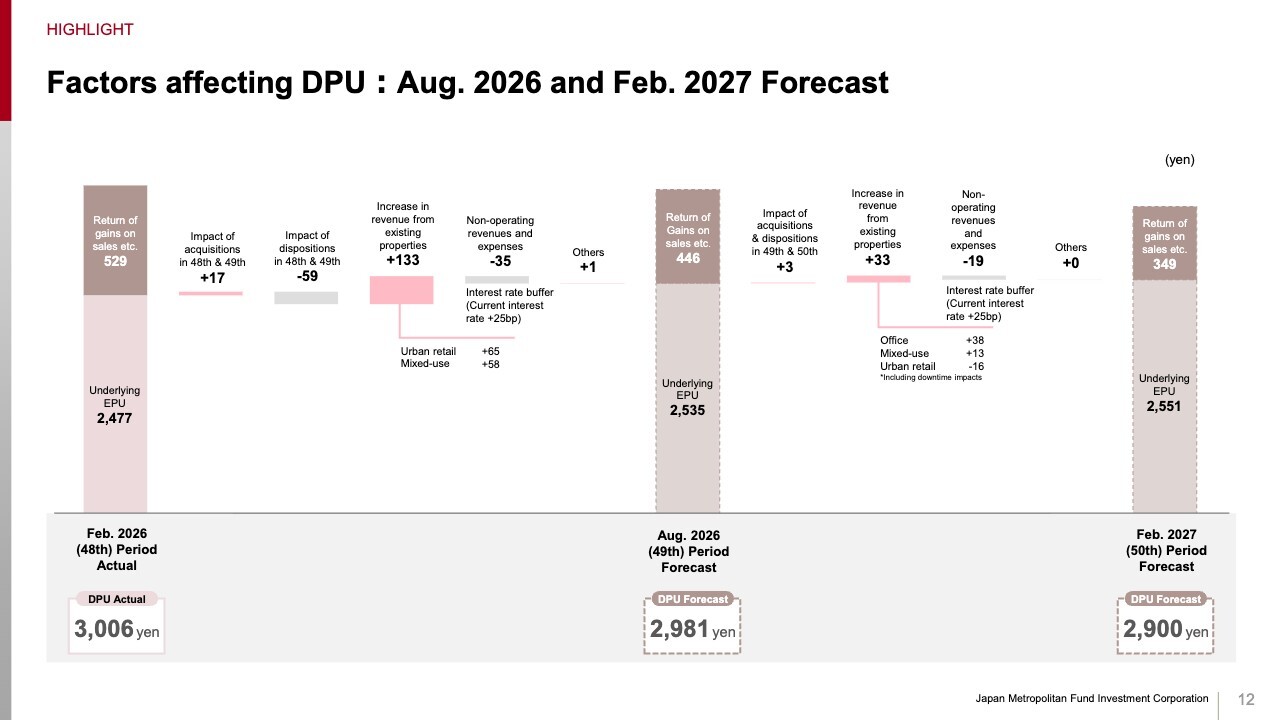
Next is our forecast for the 49th fiscal period. We forecast DPU of 2,981 yen, down 25 yen from the previous period, while underlying EPU is expected to increase by 58, from 2,477 yen to 2,535 yen.
The main drivers are strong revenue growth at existing properties, led by lease renewals and lease-up at urban retail and mixed-use assets. This more than offsets lower revenue from properties sold in the previous and current periods, as well as weaker non-operating income and expenses, resulting in higher underlying EPU.
For the 50th fiscal period, which we are announcing for the first time, we forecast DPU of 2,900 yen, down 81 from the previous period, and underlying EPU of 2,551 yen, up 16 yen. We are factoring in a 25 basis point margin on top of current interest rates to reflect the possibility of rising rates, which will weigh on non-operating income and expenses. Even so, we expect revenue growth from existing properties to more than offset that impact.
Just to reiterate, if the asset sale for which we have already received an LOI is executed as planned, we intend to raise DPU to roughly the same level as in the 49th fiscal period.
That concludes the main drivers behind DPU for the actual results of the 48th fiscal period and our forecasts for the 49th and 50th fiscal periods.
NOI (existing portfolio) +3.5%; further upside from reducing rent gap
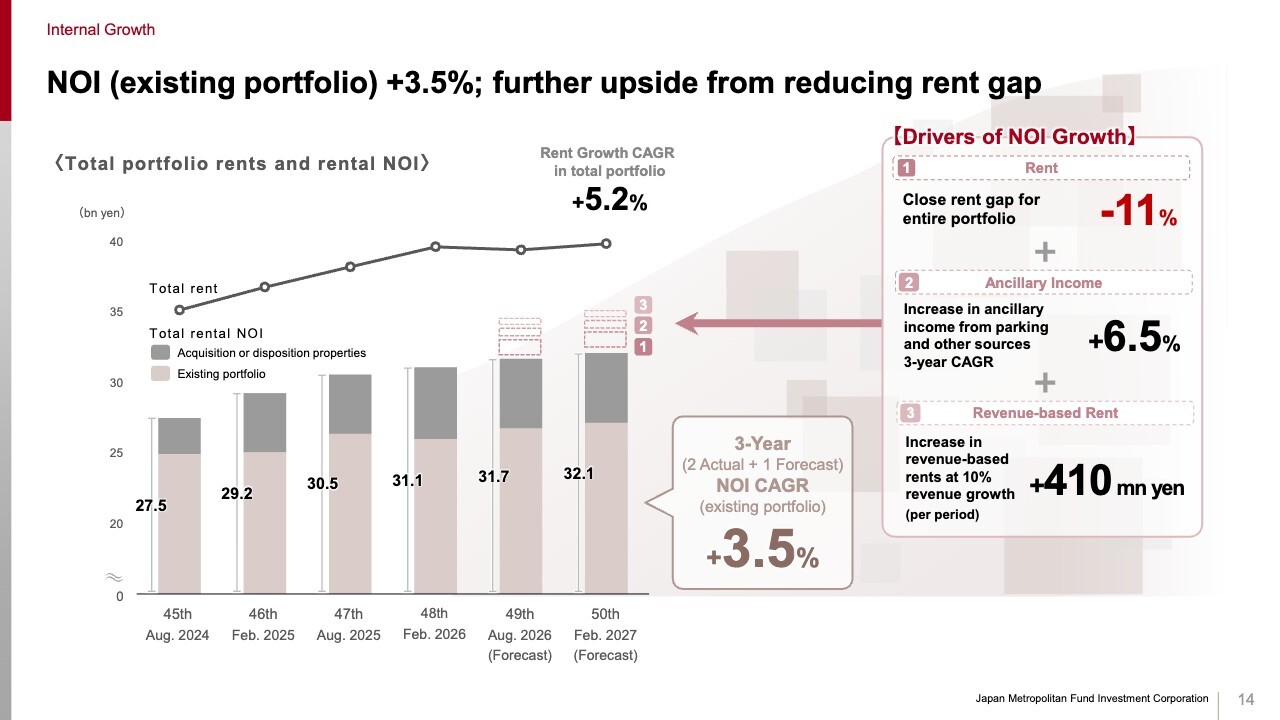
Let me start with an overview of internal growth, which is the main driver of our growth strategy. Over the three-year period consisting of the past two years and the coming year, the existing portfolio NOI is expected to deliver a compound annual growth rate of 3.5%, up from the 3.2% we showed in the previous period.
Rents are rising steadily across all sectors—retail, office, residential, and hotel—and we are also steadily building ancillary income while keeping cost increases under control. As a result, we continue to deliver strong NOI growth.
Going forward, we will continue to focus actively on raising fixed rents by closing the 11% portfolio rent gap, while also increasing revenue-based rent as tenant sales continue to grow.
JMF’s Unique Retail Management Capabilities and New Initiatives
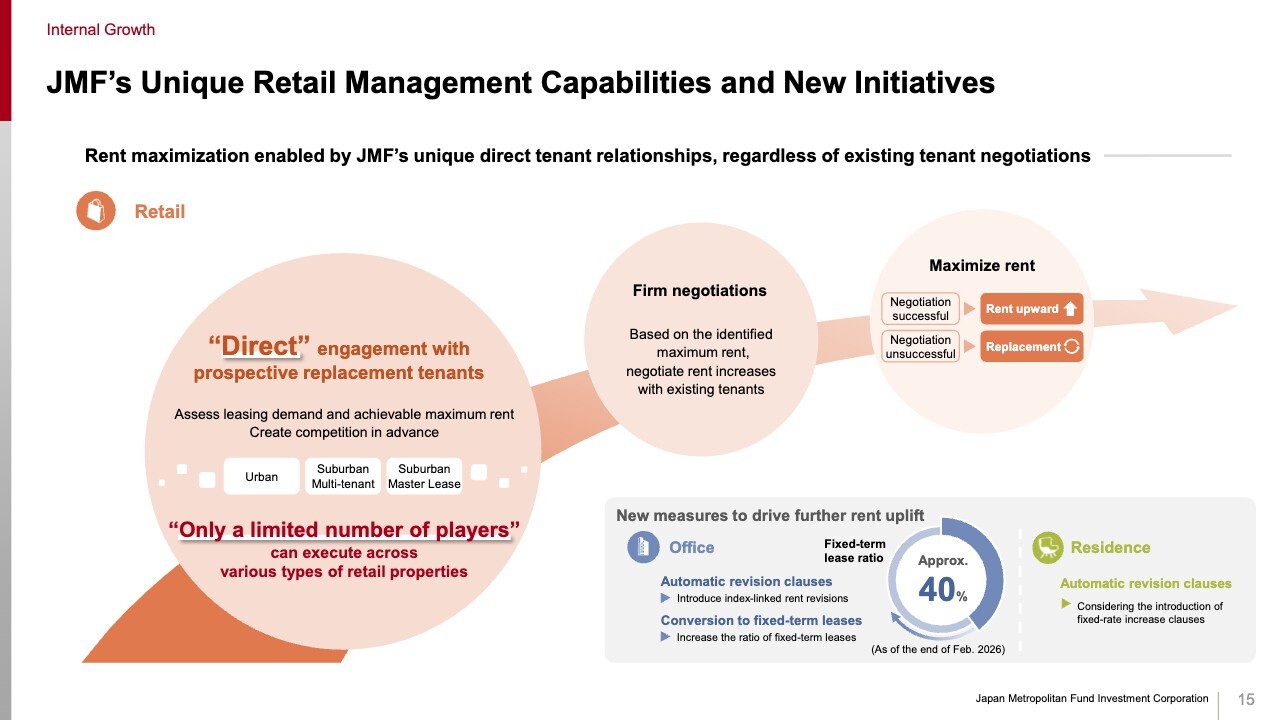
Let me revisit the reasons why JMF’s asset management platform is so strong in driving internal growth. Starting with retail. JMF has direct tenant relationships developed over more than 20 years of operating retail properties. More than 90% of the retail tenants in JMF’s portfolio are on fixed-term leases.
Leveraging these unique relationships, we hold in-depth discussions with prospective replacement tenants well in advance of lease expiry to assess whether tenant replacement is feasible and what rent levels could be achieved. Based on the demand and rent levels identified through this process, we negotiate assertively with existing tenants for rent increases.
In retail, there are tenants with very strong demand for specific locations and facilities, and some are prepared to offer rents well above market levels. Using those real demand-backed rent levels as the benchmark in negotiations with existing tenants is central to our ability to capture upside beyond the current rent gap.
This approach, based on early-stage engagement with prospective tenants, is difficult for conventional leasing brokers—whose primary role is filling vacant space—to replicate. This represents a key competitive advantage unique to JMF.
In both office and residential sectors, we are implementing initiatives to create upside. In the office segment, we have begun discussing clauses that provide for automatic rent revisions based on indices such as market rent levels and CPI with tenants with lease terms are five years or longer.
We are also actively promoting conversion to fixed-term leases. The fixed-term lease ratio was 40% as of the end of February 2026, and we are negotiating new leases based on a policy of using fixed-term leases in principle.
For residences as well, we are working to introduce automatic rent revision clauses that provide for fixed-rate rent increases upon contract renewal, and have already succeeded in introducing them at multiple properties.
Contract Renewal Achievement in the February 2026 (48th) fiscal period
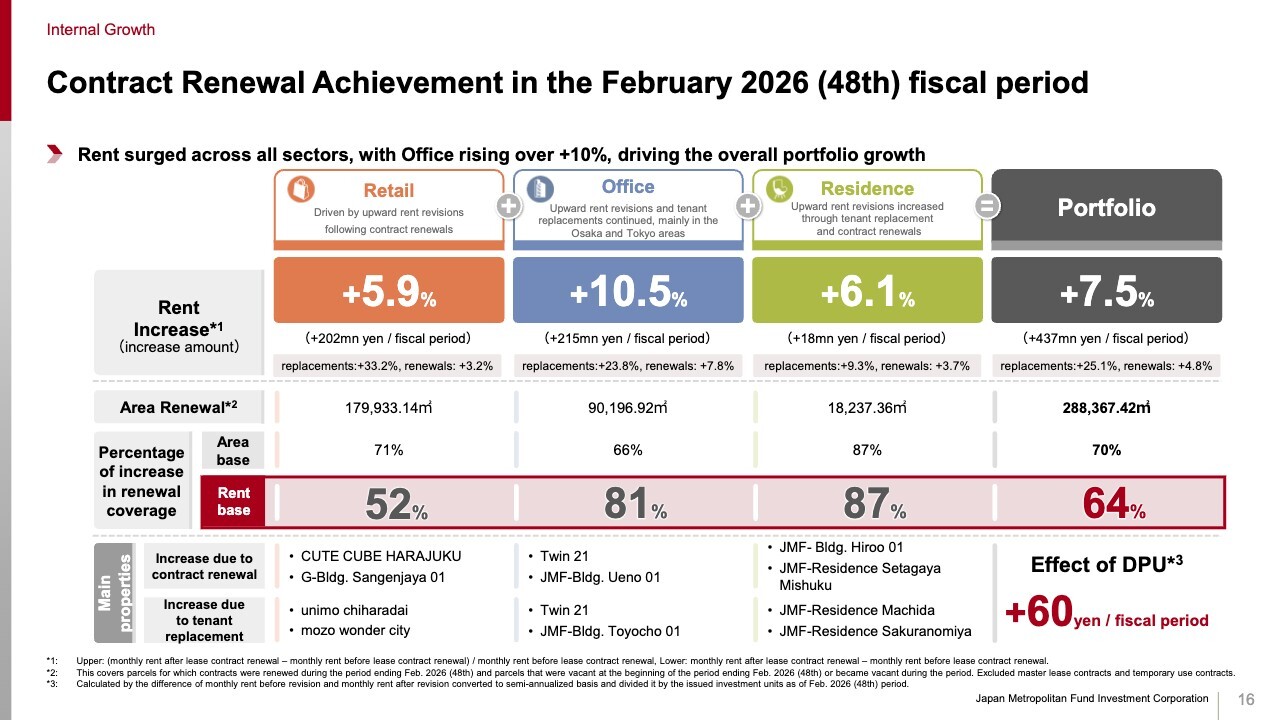
Let me share some concrete examples of our internal growth achievements. In lease renewals this period, we achieved strong rent increases across all sectors. For the portfolio as a whole, the rent change rate was 7.5%, with a DPU impact of 60 yen per period.
In addition to rent increases on high-street retail assets, office properties led by Twin 21 and JMF- Bldg. Ueno 01 made a particularly strong contribution this period. In the retail segment, the proportion of lease renewals involving rent increases was 52%, which is lower than in the other sectors, and roughly 50% were flat renewals.
About half of those flat renewals were specialty-store tenants at mozo Wonder City. While the base rent terms for those tenants remained unchanged, most of them have revenue-based rent structures, so rising sales following the property’s renewal have in effect resulted in revenue growth.
In addition, we have increased ancillary income from those tenants. If these are treated as effective rent increases, we believe that approximately 75% of our retail tenants have accepted higher rents.
Retail rents growing at around 3% CAGR excluding one-off impacts, with widening rental gaps supported by a strong market environment
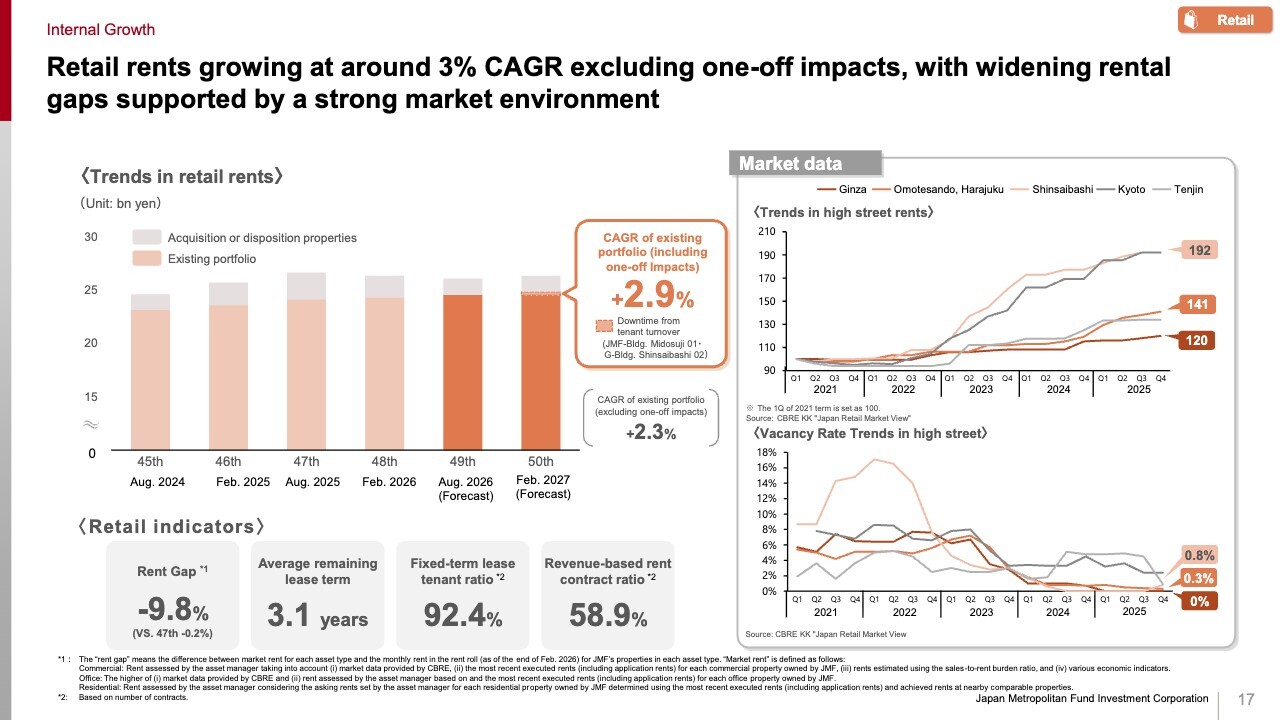
From here, I will walk through recent trends by asset class. Starting with retail, rents in the existing portfolio are growing at an annual pace of 2.9%.
With an approximately 10% rent gap, more than 90% of tenants on fixed-term leases, and around 60% of tenants subject to revenue-based rent arrangements, we see room for both higher fixed rents through lease renewals and additional revenue-based rent from rising tenant sales.
High revenue-based rent structure: “More Sales, More Rents”
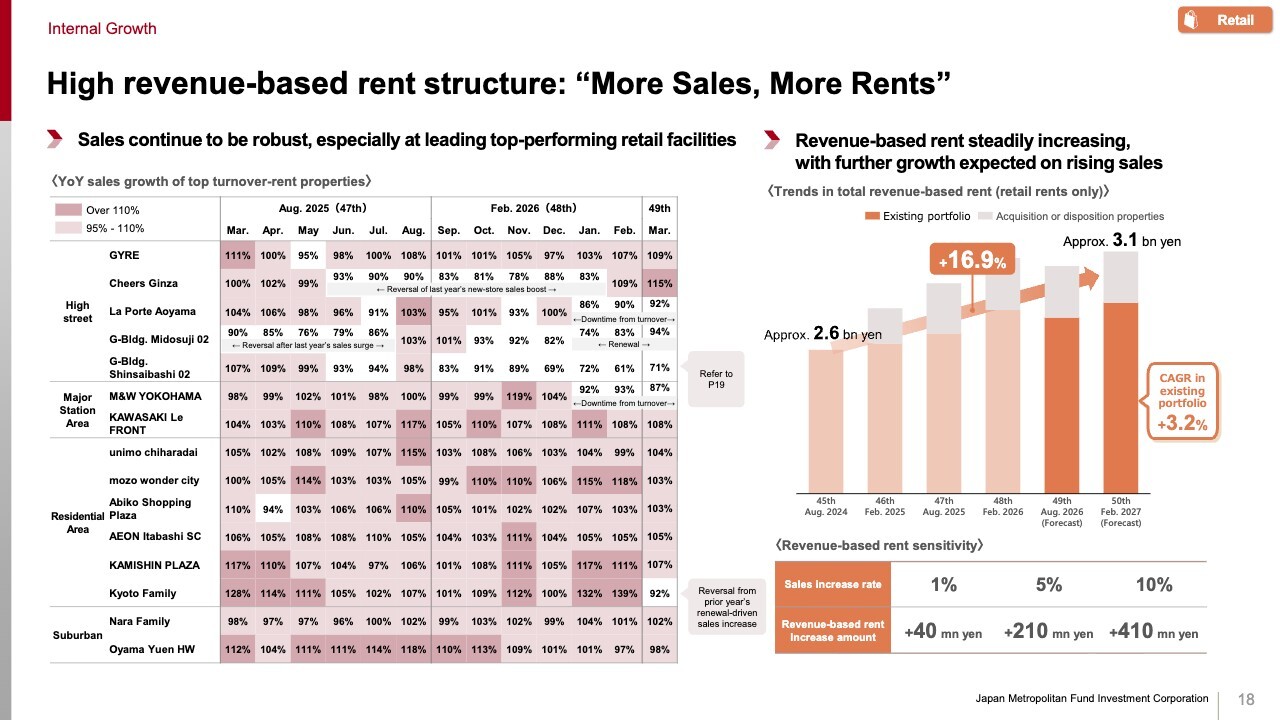
Sales at our retail properties continue to perform well, supported by inflation, wealth effects from a strong equity market, and the weaker yen.
For high-street assets, GYRE, which had no tenant replacement or renovation-related disruptions, remained solid throughout the period. Other properties also performed generally well in months without special factors.
Meanwhile, G-Bldg. Shinsaibashi 02, which primarily serves Chinese inbound customers, has seen softer sales due to worsening Japan-China relations. However, tenant replacement has already been finalized, and we expect a substantial increase in rent.
Properties in front of terminal stations and neighborhood stations also remained stable, with sales exceeding 100% of the prior-year level.
Backed by this sales growth, revenue-based rent is expected to reach approximately 3.1 billion yen in the 50th fiscal period. The existing portfolio is growing at an annual pace of 3.2%, and further sales growth should provide additional upside going forward.
Significant rent uplift through direct leasing, with built-in drivers future upside
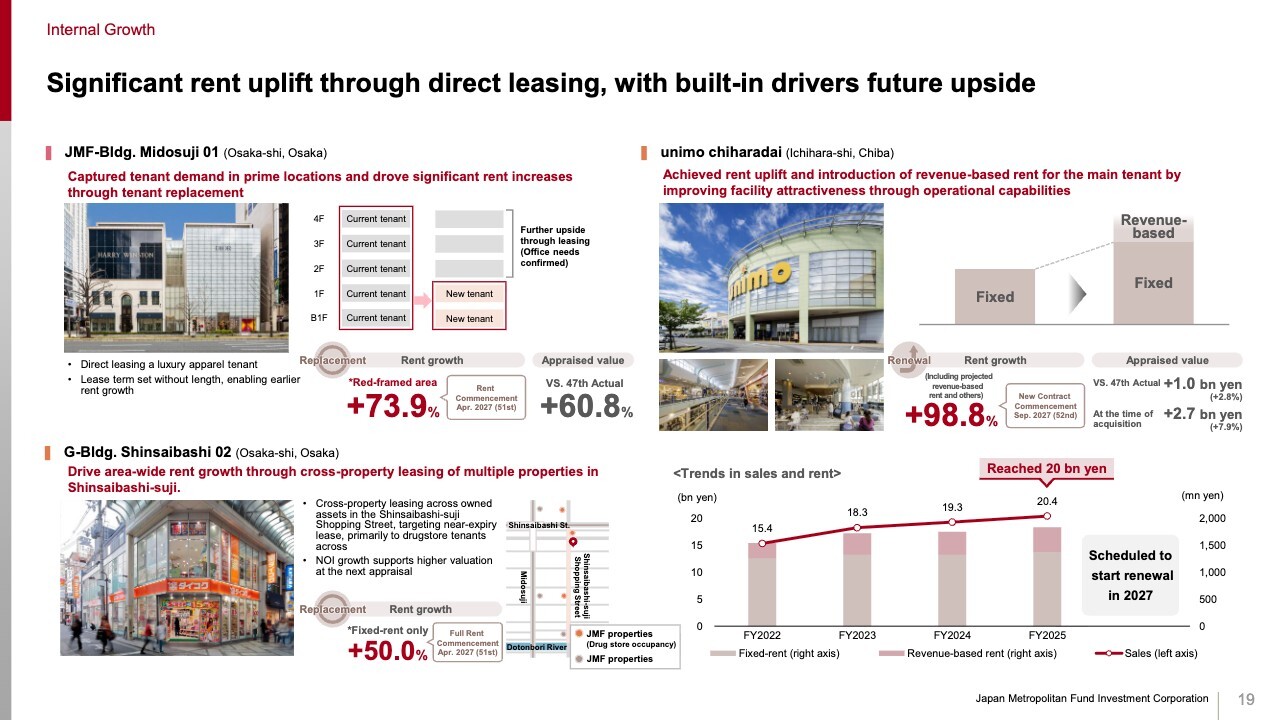
This slide highlights several specific examples.
At JMF-Bldg. Midosuji 01, the current tenant leasing five floors will see its contract expire this August. Through direct leasing, we have already secured the replacement of two of those floors with a luxury apparel brand, delivering a 73.9% rent increase.
We also succeeded in signing a medium-term fixed-term lease, which allows us to capture further upside as market rents continue to rise. As a result, the appraised value increased by 60.8% from the previous period.
For the remaining three floors, leasing has begun for office use, and we intend to continue pursuing upside there as well.
Meanwhile, at G-Bldg. Shinsaibashi 02, we carried out coordinated leasing across multiple assets we hold along the Shinsaibashi-suji shopping street, focusing on assets approaching lease expiry and primarily targeting drugstore tenants. As a result, we were able to increase fixed rent by 50%.
At unimo chiharadai, sales exceeded 20.0 billion yen for the first time in fiscal 2025, one year after acquisition, and rents have continued to trend upward. Against that backdrop, through lease renewal with the main tenant, we achieved both a higher fixed rent and the introduction of revenue-based rent, effectively doubling rent.
The appraised value also increased by 1.0 billion yen from the previous period and by 2.7 billion yen from the acquisition date, demonstrating JMF’s ability to capture upside through active asset management.
All of these contributions will materialize after the forecast periods we have announced this time, which means they should make a meaningful contribution to future underlying EPU and DPU growth.
NOI growth driven by rent uplift and cost reduction, within 1.5 years of acquisition
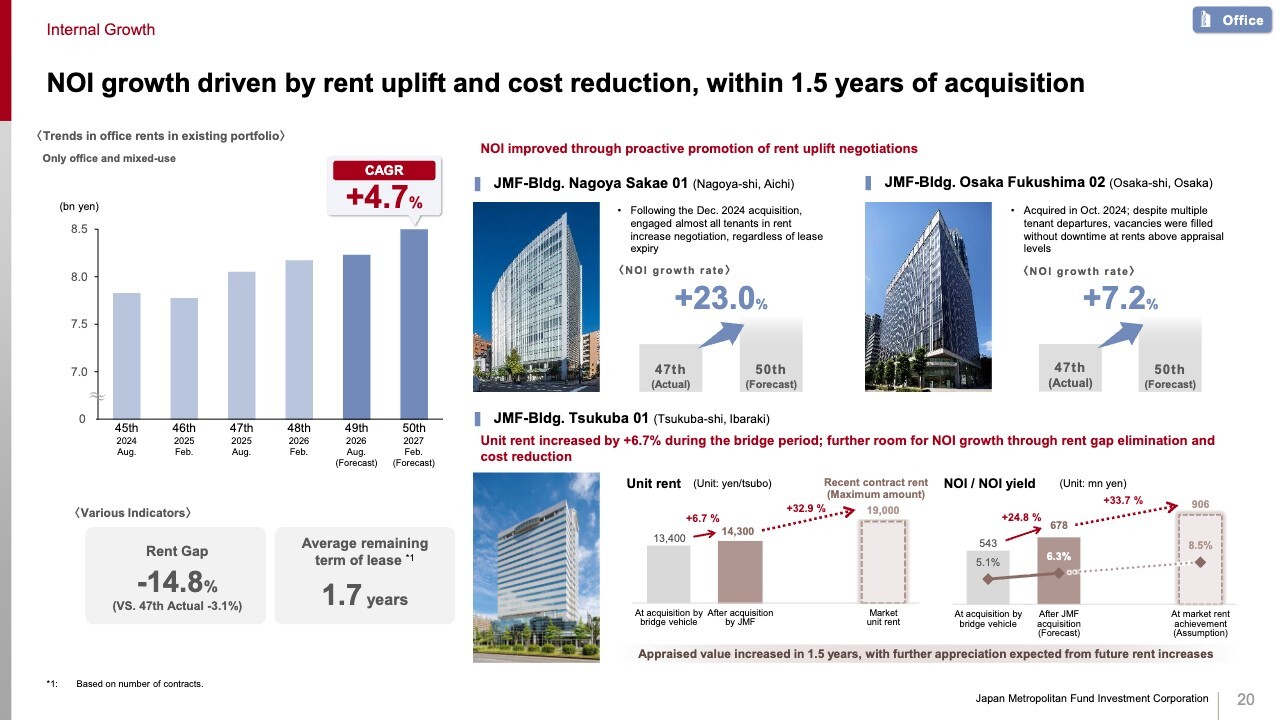
Next, let me discuss office. Rents in the existing office portfolio are increasing at an average annual rate of 4.7%, and the rent gap widened by a further 3.1 percentage points from the previous period to 14.8%.
JMF also proactively pursues rent increases even shortly after acquisition. At JMF-Bldg. Nagoya Sakae 01 and JMF-Bldg. Osaka Fukushima 02, both acquired in the second half of 2024, NOI has improved significantly.
At JMF-Bldg. Tsukuba 01, which we acquired recently, we increased average contracted rent per tsubo by 6.7% during the bridge period, resulting in a 24.8% increase in NOI. Recent new leases have been signed at rents more than 30% above the average contracted rent level, and through further rent increases and cost reductions, we expect additional NOI growth.
Residential rent uplift on tenant replacement approaching +10%, with expanding rent gap and future upside potential expected
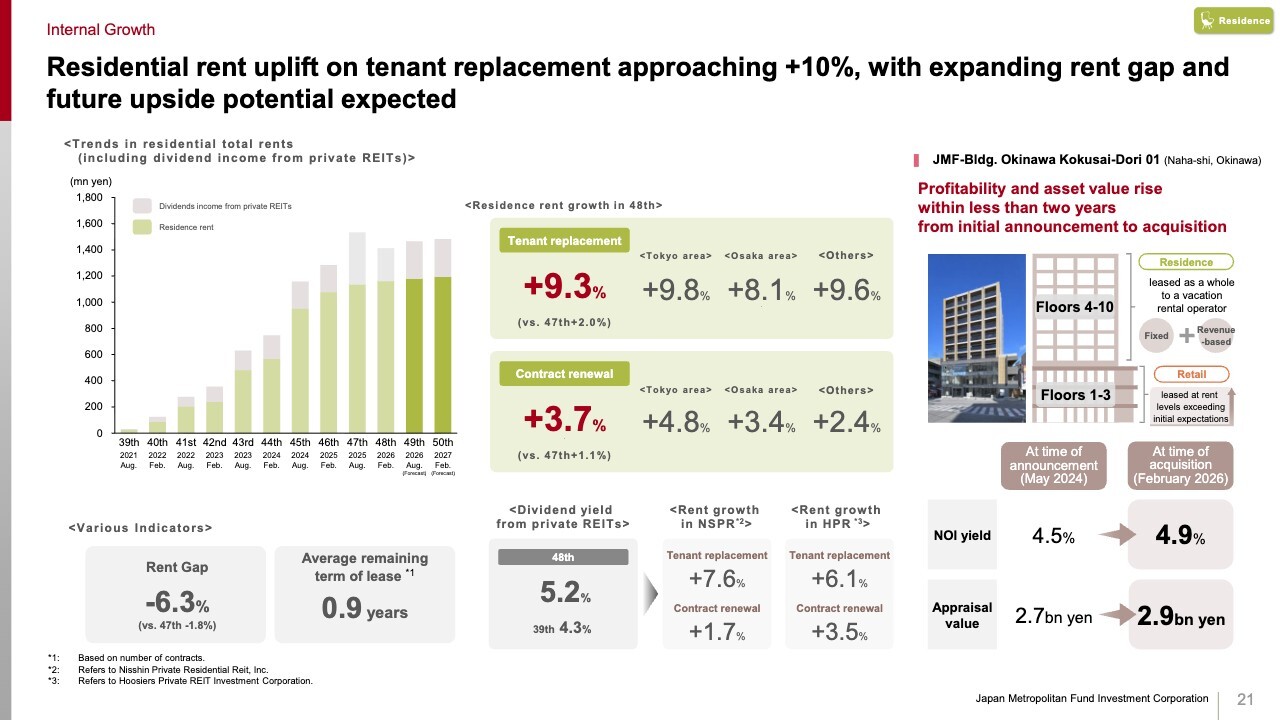
For residential, rent increases continued this period, with rents rising 9.3% on tenant replacement and 3.7% on renewals, both higher than in the previous period. The rent gap has also widened further, and conditions remain favorable for continued rent increases.
In addition, JMF-Bldg. Okinawa Kokusai Dori 01, which we announced in 2024, has now completed development and was acquired this February. The property had initially been planned as a mixed-use asset with retail on the lower floors and residential units above. However, before acquisition, we reassessed the tenant mix and rent levels.
We leased the lower floors to retail tenants at rents above our initial assumptions, and converted the upper floors from residential use to a master lease with a vacation-rental operator. As a result, NOI yield improved by 0.4 percentage points versus the original underwriting at acquisition, and the appraised value increased by 0.2 billion yen.
Beyond rent: Diversified strategies driving NOI growth
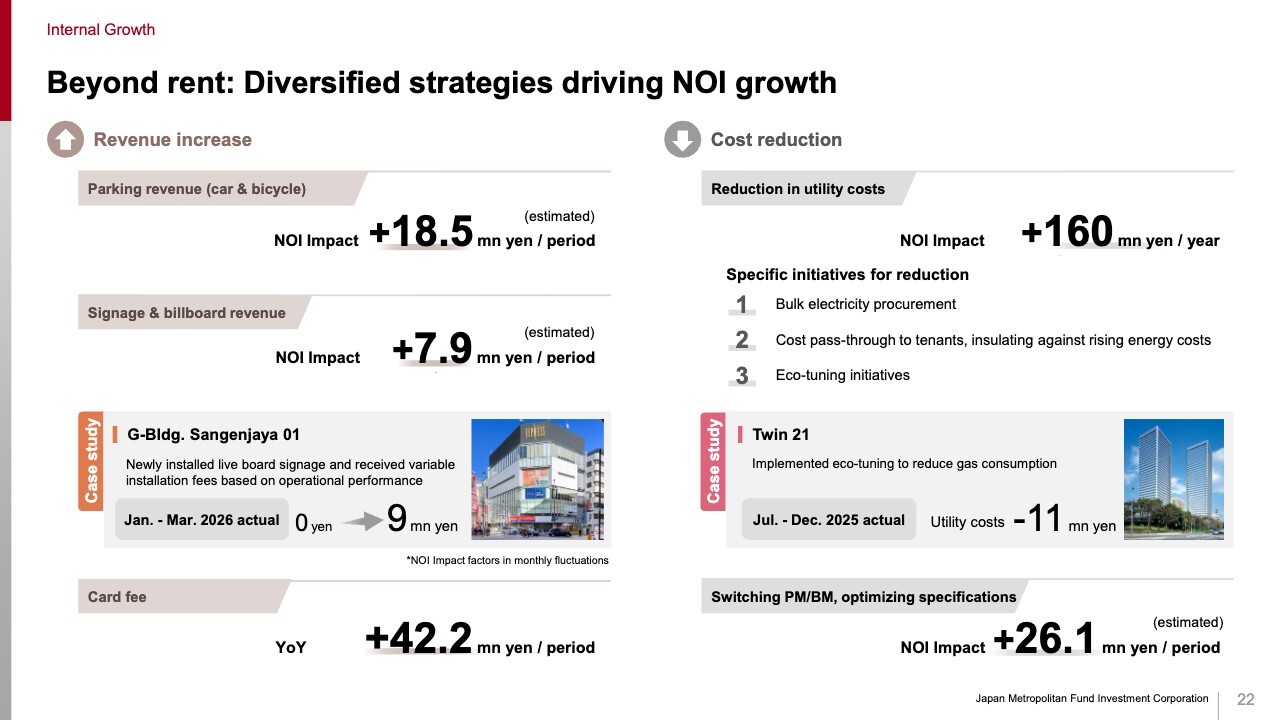
In addition to rent increases, we continue to implement a wide range of initiatives to improve NOI each period. In terms of revenue growth, we continue to build up NOI steadily at each property through measures such as parking and bicycle parking income, signage and billboard income, and card fee income. As a result, we expect a positive NOI impact of approximately 70 million yen per period.
One example is G-Bldg. Sangenjaya 01, where we installed Live Board digital signage and launched a new initiative to collect variable placement fees linked to operating performance. In just three months, this generated 9 million yen in variable placement fees.
In terms of cost reduction, especially for utilities, we continue efforts such as bulk procurement and eco-tuning to lower electricity unit prices and reduce consumption. We have also established mechanisms to pass through higher energy costs to tenants, so we do not expect recent increases in crude oil prices to have a material impact.
Acquisition and Disposition properties (announced after the previous financial results)
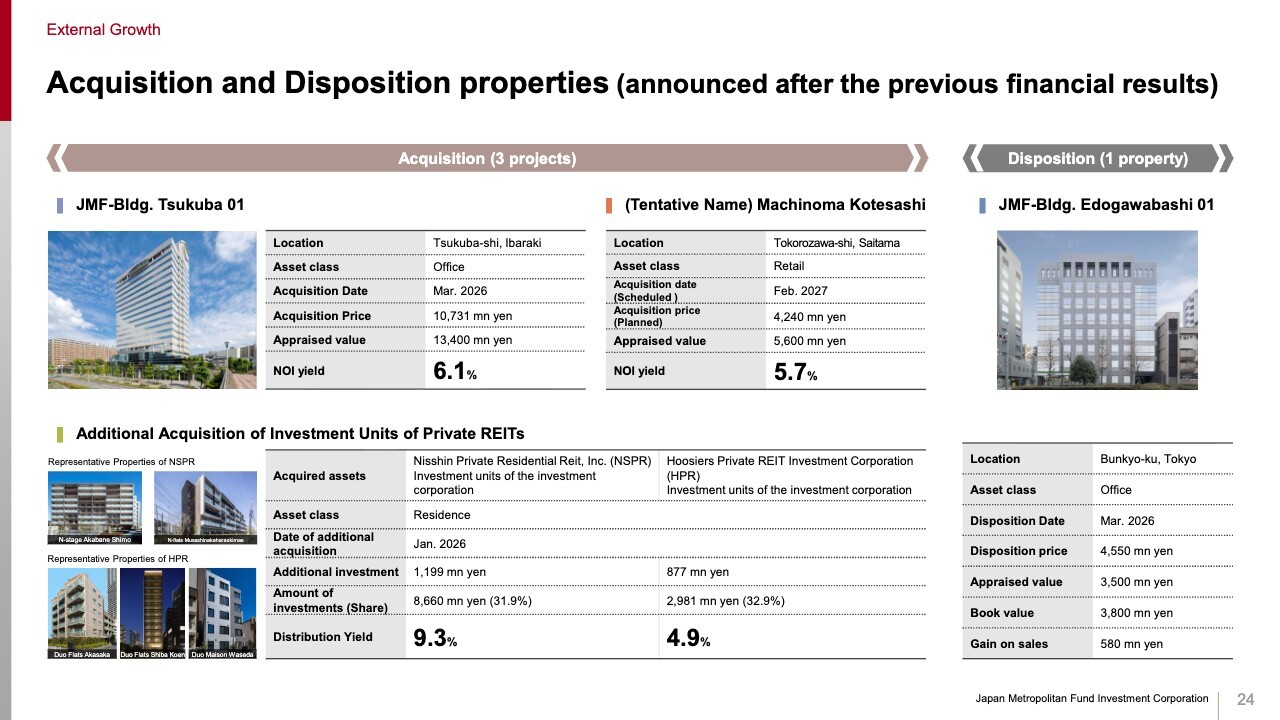
This slide shows the list of acquisitions and disposals announced since the previous earnings release: one office acquisition, one retail acquisition, the acquisition of private REIT investment units, and the disposal of one office property.
Flexible financing to address rising interest rates while limiting financing cost volatility
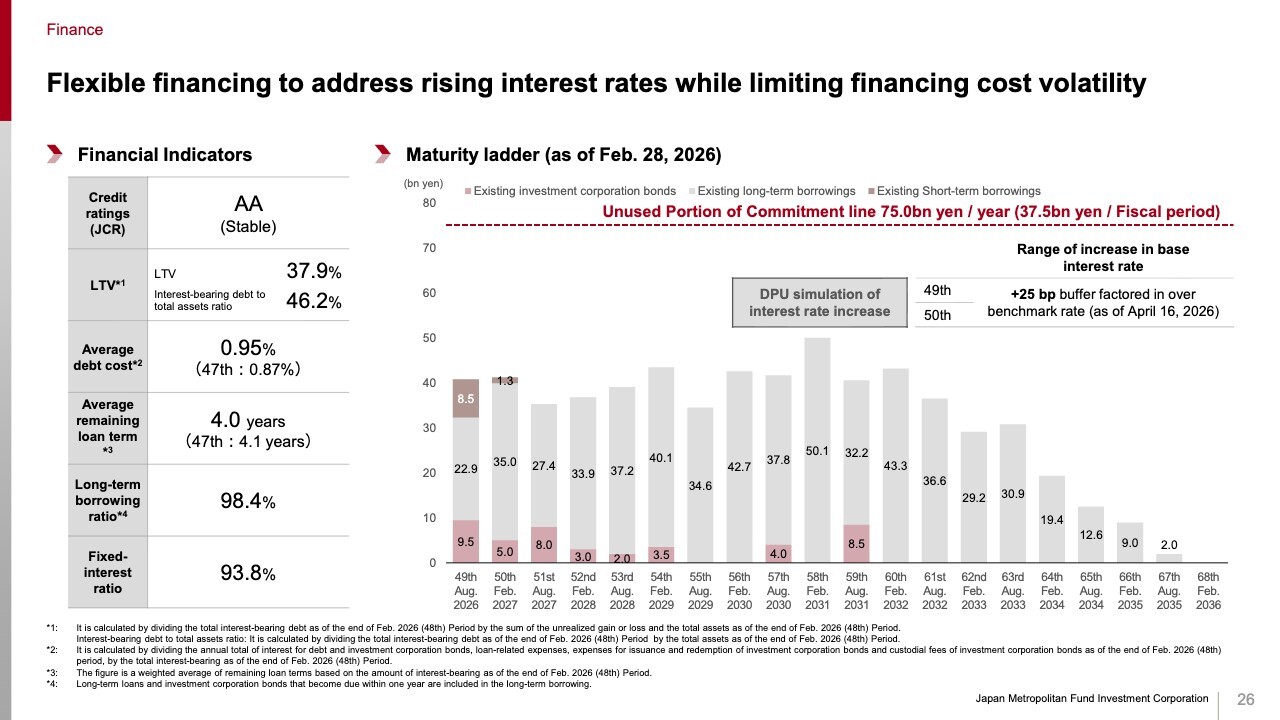
Let me now discuss finance and sustainability. On finance, based on the current financing environment, we raised funds mainly through medium-term fixed-rate borrowings. As a result, as of the end of the 48th fiscal period, the fixed-interest ratio was 93.8%, and the long-term borrowing ratio was 98.4%.
For the 49th and 50th fiscal period forecasts, we assume refinancing using a combination of fixed-rate and floating-rate borrowings in order to manage the impact of a rapid rise in debt costs. We also include a 25 basis point buffer over current benchmark rates to reflect the possibility of further rate hikes.
Sustainability Initiatives
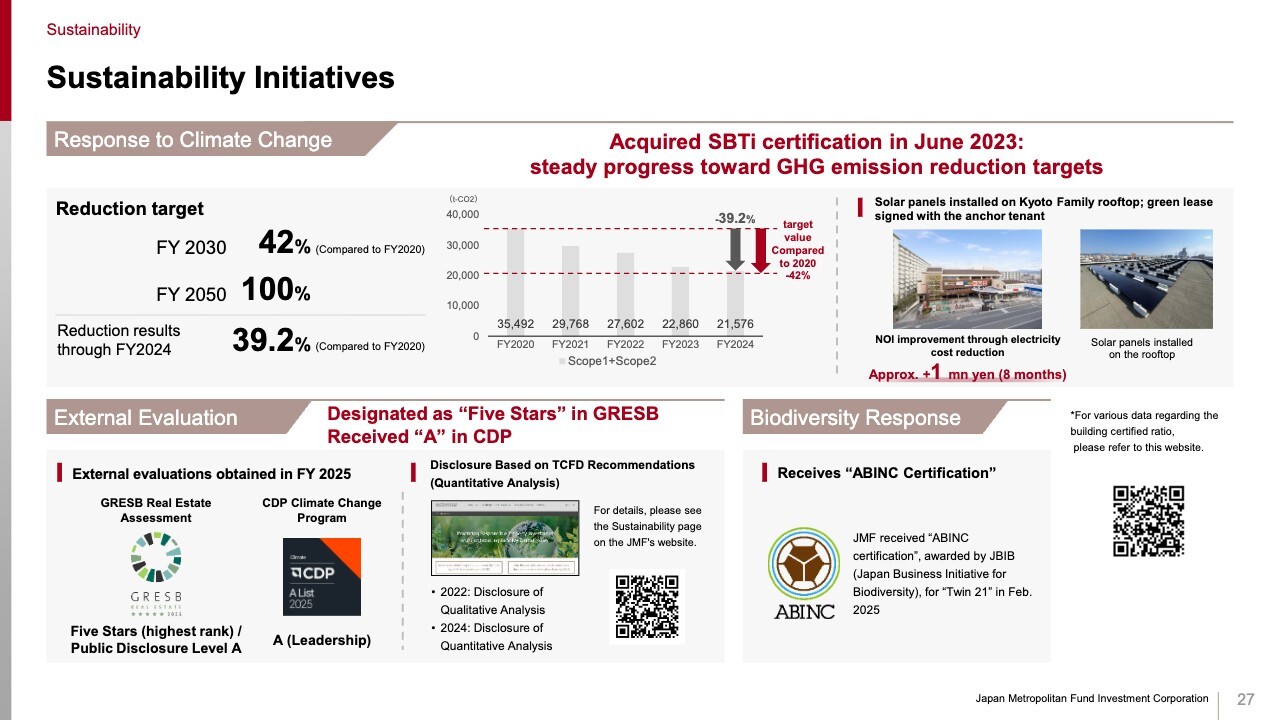
On sustainability, at Kyoto Family we installed solar panels on the rooftop and entered into a green lease agreement with the main tenant, which has delivered both lower electricity costs and improved NOI. We will continue promoting sustainability initiatives that also contribute to NOI growth.
Growth cycle driven by “Internal Growth” & “Return of Gain on Sales”
Finally, let me return to JMF’s growth strategy.
In internal growth, in addition to what I have already discussed, we are actively advancing negotiations on multiple upside opportunities in retail properties, including rent increases at large ordinary master-lease properties, early leasing offers at nearly double previous rent levels for spaces whose fixed-term leases expire in a few years, and rent uplift through tenant replacement at multi-tenant retail properties.
For office assets as well, higher market rents are becoming increasingly accepted by tenants. For example, at an office property in Minato Ward where market rent was around 30,000 yen per tsubo just a few years ago, we have now received an application at 40,000 yen, above the current market level. There is ample medium-term growth potential.
As for returning gains on sales, given the strong internal growth potential of our portfolio, we continue to receive acquisition offers at high valuation levels that reflect future upside, allowing us to generate and distribute disposal gains on a stable basis.
We will also continue to generate gains from new investments through value-add strategies. By combining with external growth, we can increase EPU through acquisitions and further build EPU through the internal growth of newly acquired assets, enabling sustainable and strong growth.
To sustain external growth, further improvement in unit price is important. By continuing to deliver strong internal growth and return of gains on sales, we aim to drive the unit price higher, while utilizing bridge structures and related tools to steadily build a pipeline for future acquisitions.
Across internal growth, return of gains on sales, and external growth, we aim to deliver industry-leading growth among J-REITs. By driving sustained improvement in both EPU and DPU, alongside a higher unit price, we will seek to maximize total return for our unitholders.
That concludes my presentation. Thank you very much for your attention.
Q&A: Approach to Rent Increases
Questioner: You mentioned that rent uplifts have been achieved across all asset classes. Could you explain your approach?
Specifically, for retail properties, are these increases driven more by JMF’s proprietary know-how rather than market conditions, or are market factors also contributing to a meaningful extent?
For office and residential properties, is it fair to say that market factors play a larger role? I would appreciate it if you could break down the key drivers of rent increases by asset type in a bit more detail.
Machida: For retail properties, we believe both know-how and market conditions are important. As you’d expect, no matter how strong the know-how is, it is difficult to raise rents when the market is weak. On the other hand, when the market is favorable, our know-how becomes particularly effective, making significant rent increases possible.
So, in retail, strong rent growth has been achieved through the combination of both our know-how and supportive market conditions.
For office and residential properties, the know-how element is somewhat less pronounced than in retail. However, as I mentioned in the presentation, we have introduced our own proprietary provisions into contract terms, along with other tactical measures. For example, before sounding out existing tenants, we may lease smaller spaces externally at very high rents, and then use those benchmarks when approaching existing tenants in order to negotiate higher rents. So, I would say tactical execution also plays a very significant role in these asset classes.
Q&A: Market Environment for Urban Retail Properties
Questioner: Looking at market data, vacancy rates remain very low and rents continue to rise. However, considering factors such as the current inbound tourism situation and geopolitical issues in the Middle East, do you see any signs that the market may be approaching a ceiling or becoming more uncertain?
If not, what do you believe is driving the market and offsetting those concerns?
Machida: In conclusion, we do not see any particular uncertainty at this point. In the past, rent increases were partly driven by luxury brands. Recently, however, we have seen a growing number of non-luxury operators opening stores in areas such as Omotesando and Ginza while paying high rents.
With vacancy already extremely limited and a certain level of store-opening demand from luxury brands still remaining, this has been compounded by very strong demand from other operators. As a result, the market continues to resemble a game of musical chairs, and we understand that rents remain on an upward trend.
Q&A: Acquisition Strategy
Questioner: On Slide 9, you refer to the pipeline, including carve-out opportunities sourced through KJRM’s proprietary network and carve-out deals conducted jointly with sponsors. In terms of these carve-out opportunities, what types of properties is JMF most likely to acquire?
For industrial funds, one can broadly imagine the likely asset types, but in JMF’s case, would these opportunities be mainly office properties, or could they also include urban retail properties and so on? I would appreciate any color you can provide within the scope of what you are able to disclose.
Machida: When it comes to carve-out opportunities for external growth, Industrial & Infrastructure Fund may naturally be the easier reference point. That said, the carve-out opportunities currently being considered by JMF include office and retail properties.
The retail properties include not only urban retail assets, but also retail facilities in residential neighborhoods and around train stations.
Operating companies hold a wide range of assets. While CRE carve-outs may often be associated with sale-and-leaseback structures, there are also other forms of CRE carve-outs. We are currently evaluating opportunities that cover a variety of asset types.
Q&A: Outlook for the Transaction Market
Questioner: How does KJRM view the current market environment and the outlook going forward?
Of course, part of that may be attributable to improved earnings through rent increases, but in JMF’s case, my impression is that there have also been many instances where properties were sold at prices significantly above appraised value. Is that mainly due to market factors, or are there proprietary initiatives or strategies behind it?
Machida: First, in terms of the outlook for the transaction market, from an optimistic standpoint, we would welcome a situation where cap rates rise and acquisitions become easier. However, that is not really what we are seeing today.
It is a little difficult to phrase, but while individual funds may have raised their cap rate assumptions somewhat, rents and NOI have been rising even faster than that adjustment. As a result, property prices continue to increase, offsetting any upward movement in cap rates.
As long as this rent growth continues, we believe the transaction market is likely to remain resilient and continue to perform steadily. We see this trend across all asset types.
Even in the current market, whether it is office, residential, or logistics, which we also cover within our group, prices are still rising across the board, and market participants generally remain quite bullish on the outlook.
As for why JMF has been able to sell assets at prices above appraised value, a key factor is our approach to the sales process. If you simply announce that an asset is for sale, you can end up at a disadvantage in negotiations. Instead, we typically communicate to the market that we may consider selling if we receive a sufficiently strong price.
As a result, we often see inbound interest from buyers willing to propose very attractive pricing, thinking that at those levels they may have a chance to acquire the asset.
We then focus on such interested parties and run a more selected bidding process among a narrowed group of buyers. In the current market, we believe this is a very effective way to maximize pricing, and that is why we continue to follow this approach.
This has enabled us to continue achieving sales at levels meaningfully above appraised value. The transactions I mentioned earlier that are already under consideration are also being pursued in essentially the same way.
Q&A: Challenges in Introducing Fixed-Term Leases and Automatic Rent Escalation Clauses
Questioner: Earlier, you mentioned the introduction of fixed-term lease structures and automatic rent revision clauses for office and residential properties. Could you elaborate on how you view the hurdles to implementing these measures?
Machida: Starting with residential, we are generally not pursuing a shift to fixed-term leases. Instead, our main focus is on introducing automatic rent revision clauses.
The biggest hurdle is not so much with the end tenant, but rather with explaining the concept to the PM companies and local brokerage firms that actually handle leasing on the ground. Once we get past that point, implementation tends to proceed relatively smoothly.
For office properties, it is fairly straightforward in the sense that, when we present rent levels under both fixed-term leases and ordinary leases, some tenants will choose the fixed-term option depending on their preferences.
As for automatic rent revision clauses, much depends on each tenant’s own market view. That said, a common request is to include a cap.
However, if the cap is set at, say, 5%, then in some cases it may be more advantageous for us to keep an ordinary lease and revise rents every two years instead. So, we negotiate these clauses while carefully considering the cap level and expected market movements in the absence of a cap.
Q&A: Potential and Profitability of Conversion Assets
Questioner: On Slide 10, you walked through examples of conversions, such as from retail to office and from office to retail. I happened to visit La Porte Aoyama when the building was first completed, so it was somewhat nostalgic to see it mentioned.
Do you believe there is still significant room for these types of conversions? For example, in the case of La Porte Aoyama, part of the less user-friendly retail space was converted into fitted office space, and the rent uplift appears to have been quite substantial.
It made me wonder whether there may still be considerable upside from similar initiatives, for example on upper floors in prime luxury retail areas. I would appreciate any comments you may have on that potential.
Machida: We do believe there is still substantial potential. A very easy-to-understand example would be upper-floor space in the Omotesando area.
In those locations, service-oriented tenants—beauty salons being the most typical example—often occupy the upper floors. For this type of tenant, there is generally a ceiling of around 30,000 yen per tsubo in terms of rent. If those spaces are converted into fitted offices, the current market level is roughly 40,000 yen to 50,000 yen per tsubo.
As you may notice just by walking around the area, we own a number of properties in Omotesando with tenants such as beauty salons. For those assets, wherever conversion to fitted office use is feasible, we would like to proceed with such conversions and capture meaningful rent upside.
Q&A: Likelihood of Property Sales
Questioner: Regarding property sales, you mentioned that some transactions are currently under negotiation. Could you comment on the likelihood of executing the 6–7 billion yen in gains on sales? Given your track record of continuous asset sales, and considering that there may also be a fair amount of inbound interest or requests from counterparties, I do have a certain level of comfort in your ability to asset replacement. Still, I would appreciate any update you can share regarding the current status of negotiations.
Machida: The 6.0 to 7.0 billion yen in gains on sales would correspond to roughly two or three properties. As I mentioned earlier, the LOI/LOA process has already been completed for one of these properties.
For the remaining few properties, we have already received multiple verbal offers, so if we were simply to proceed at those price levels, execution would be achievable. However, rather than settling too quickly, we would like to continue pursuing further upside. This figure is meant to give a sense of the level we believe we can aim for or potentially exceed.
In addition, this refers only to the level of gains on sales that we are considering realizing over the current two fiscal periods. We have received many other verbal offers as well, so we believe it should be relatively easy to build up this figure.
Q&A: Tenant Opening Coordination
Questioner: You have a variety of retail formats, including urban retail, suburban multi-tenant, and suburban master lease assets.
Depending on the tenant, there may be cases where a tenant prefers an urban retail location, while from your perspective a suburban multi-tenant property might be a better fit. In other words, there may be a mismatch between tenant preferences and your own views. How do you handle that type of coordination?
This may get into the specifics of leasing, but I would appreciate any comments you can share.
Machida: It is not an easy question to answer in general, but there are certainly cases where a tenant may prefer one location while we would ideally like them to lease space at another property.
This happens not only in urban retail but also in suburban multi-tenant assets. For example, we would like a tenant to open at Oyama Yuen Harvest Walk, but they show interest in mozo Wonder City.
In those cases, we may be making an opening at mozo Wonder City conditional on also opening at Oyama Yuen Harvest Walk, or on taking a more challenging unit in an urban asset. So, this kind of cross-property coordination is something we do fairly often.