Highlights Since October 2025
Takuya Yokota (hereinafter, Yokota): My name is Takuya Yokota, General Manager of the Logistics REIT Department at Mitsubishi Jisho Investment Advisors. Thank you very much for joining us today for the financial results briefing for the fiscal period ended February 28, 2026 (the 19th fiscal period) of Mitsubishi Estate Logistics REIT Investment Corporation (MEL). Let me walk you through the financial results presentation materials.
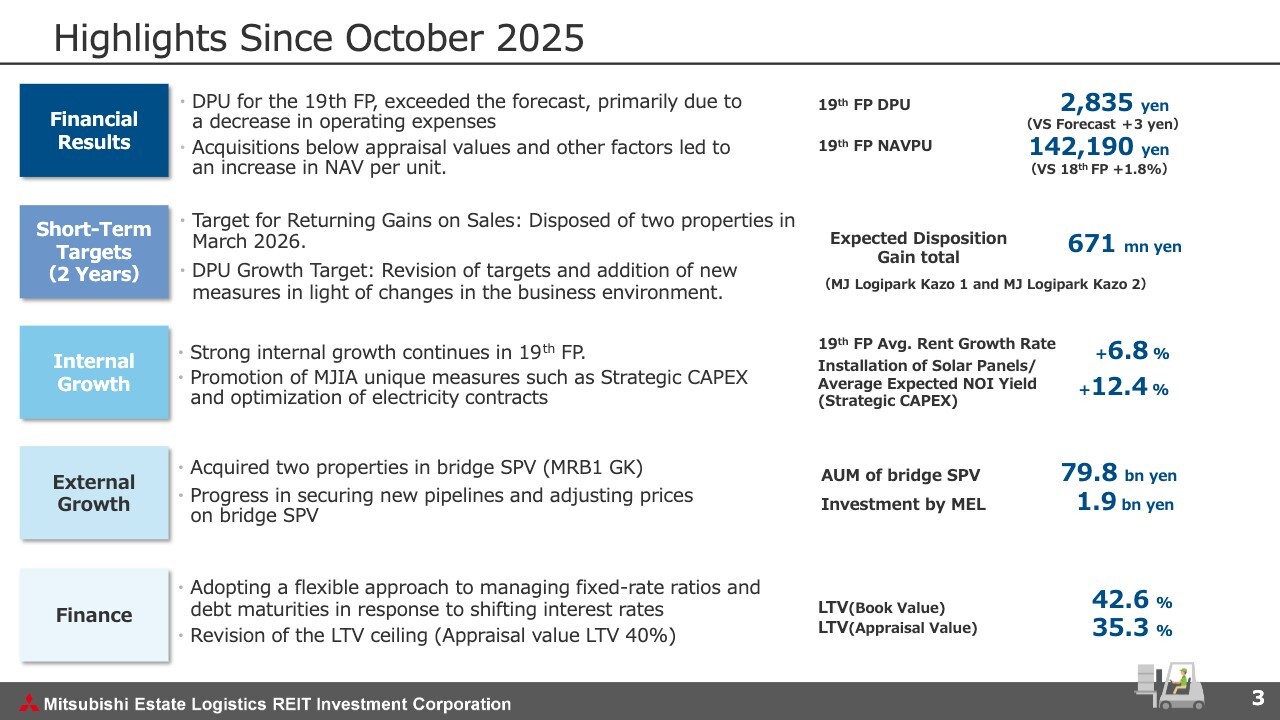
First, I will explain the operational highlights for the fiscal period, starting from the financial results. In the 19th fiscal period, DPU exceeded the initial forecast, primarily due to the deferral of some operating expenses. In addition, increases in appraisal values from reappraisals of the existing portfolio led to an improvement in NAV per unit.
Next is about the short-term targets of “Stabilized DPU Growth and Realization of unrealized gain” which we set in April 2025. We have disposed of two properties—MJ Logipark Kazo 1 and MJ Logipark Kazo 2—in March 2026 and expect to record a disposition gain of approximately 670 million yen in the current 20th fiscal period.
Regarding our DPU growth target, we will review it and implement additional measures in light of changes in the business environment over the past year.
In terms of internal growth, we have achieved rent growth for 16 consecutive fiscal periods through the 19th fiscal period, with rent growth of 6.8% for the period. In addition, as part of our strategic CAPEX, we promote measures to boost revenue besides rent growth, such as installation of solar panels on the roofs of our logistics facilities.
With regard to external growth, we have completed the additional acquisition of Logicross Funabashi and Logicross Nagoya Minato through bridge SPV. The dividends received through our investment in the bridge SPV contribute to our DPU.
In terms of finance, in response to recent changes in the financial environment, we are considering managing fixed-rate ratio of borrowings and the average debt maturity more flexibly. As for LTV, since we intend to focus on the market value of our real estate, we plan to revise primary indicator, shifting from the conventional book value-based approach to appraisal value-based approach.
DPU Transition
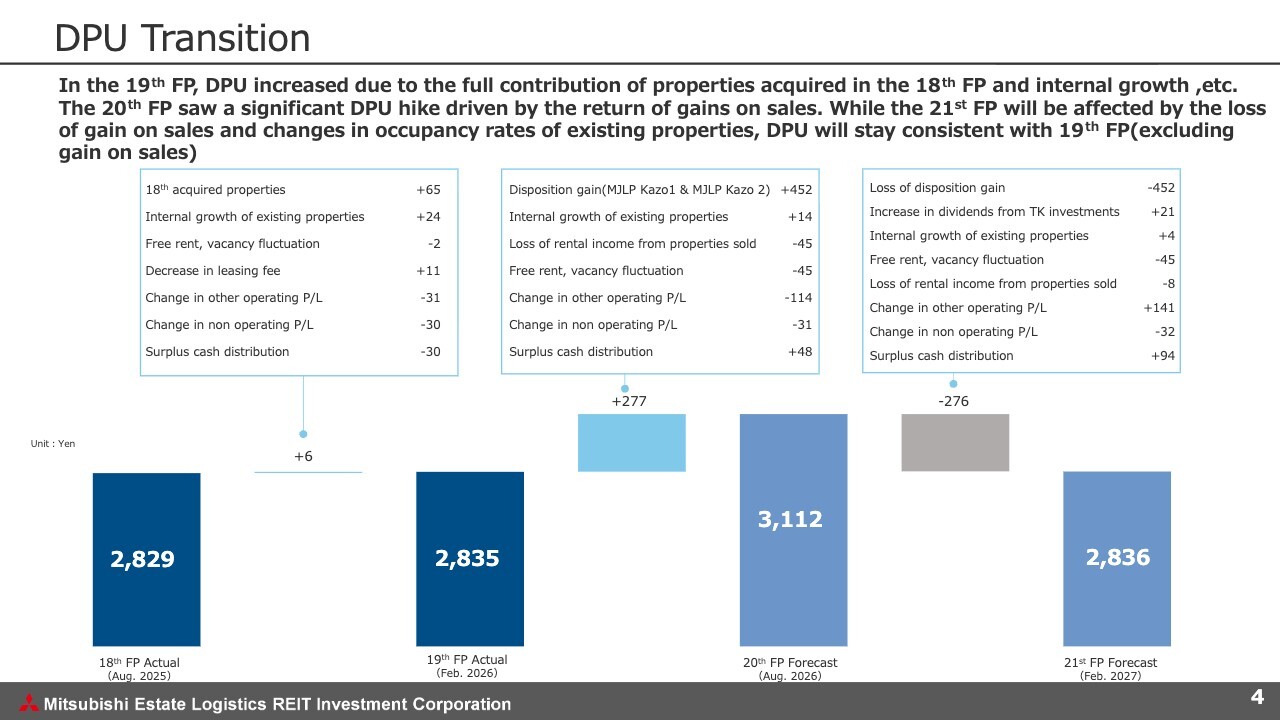
Here is an update on the DPU transition. In the 19th fiscal period, DPU increased by 6 yen compared to the previous period, primarily due to the full-year contribution of assets acquired in the 18th fiscal period, as well as a decrease in operating expenses resulting from the postponement or cancellation of selected repair work and the deferral of leasing fee payments.
Since the deferred expenses are highly likely to be incurred in the future, we have retained the amount equivalent to these costs within MEL by adjusting the surplus cash distribution, with the aim of smoothing out future expenditures.
As mentioned earlier, we expect to recognize disposition gains of MJ Logipark Kazo 1 and MJ Logipark Kazo 2 from the 20th fiscal period. However, our earnings forecasts do not currently factor in external growth resulting from property acquisitions or the return of unrealized gains from property sales; our aim is to achieve further growth.
NOI Transition
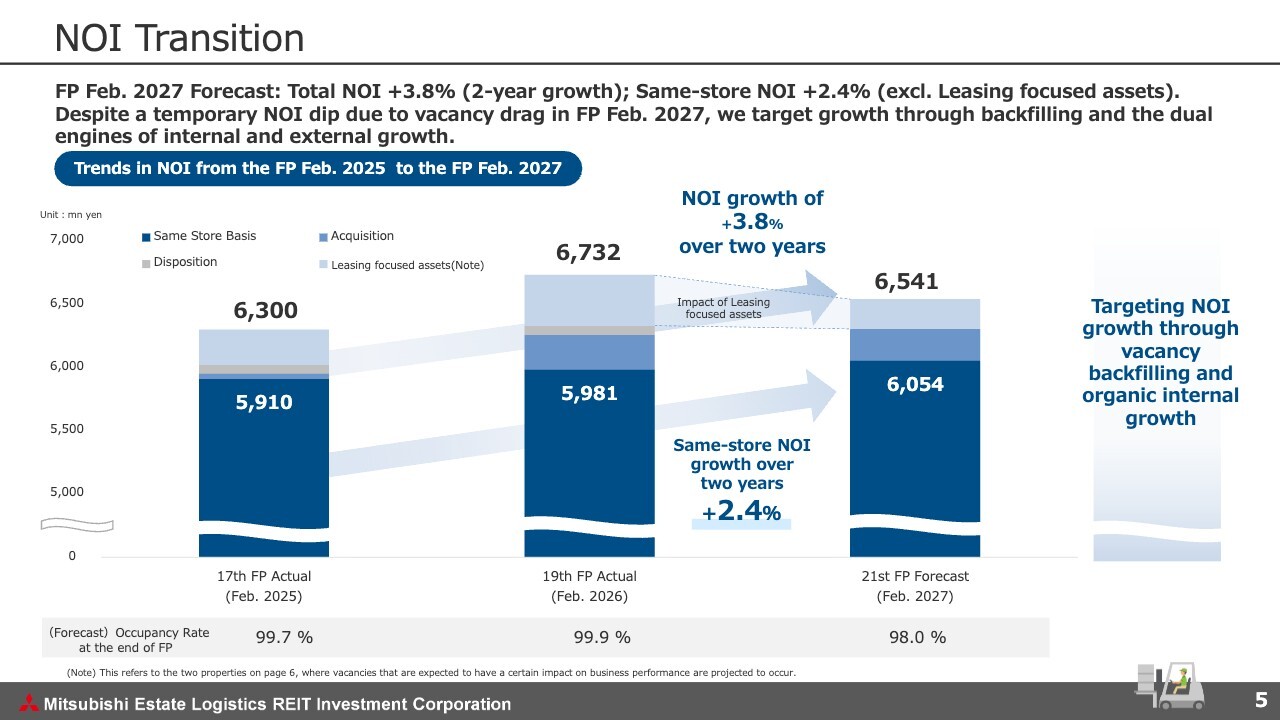
This is the status of the NOI transition at MEL. The graph shows the annual trend in NOI starting from the fiscal period ended February 28, 2025. Same-store NOI, shown in dark blue, is projected to grow by approximately 2.4% over the two-year period through the fiscal period ending February 28, 2027. For the entire portfolio, including external growth from property acquisitions, we anticipate NOI growth of around 3.8%.
Certain properties with vacancies are labeled as “leasing focused assets” in the graph. While a temporary dip in NOI is expected for the fiscal period ending February 28, 2027 due to downtime at these properties, we aim to achieve early lease and further NOI growth.
Impact of Tenant Departures
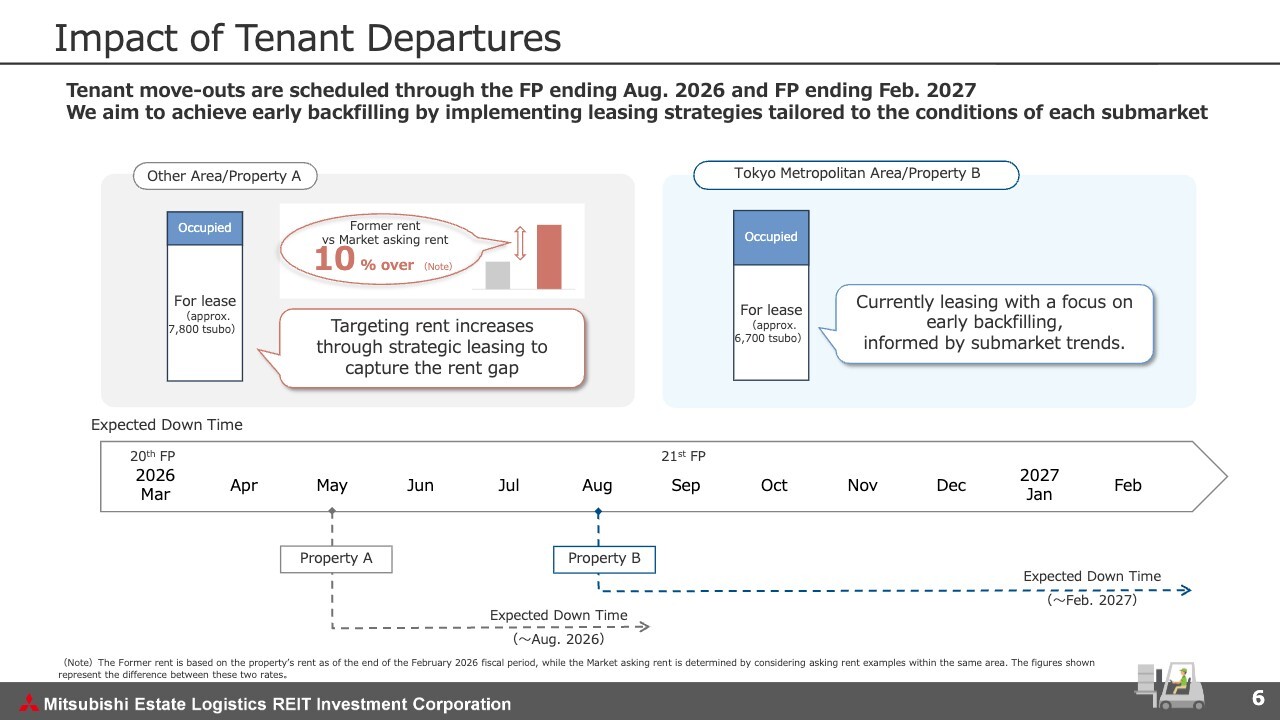
As shown on the previous slide, where we highlighted “leasing focused assets,” we currently anticipate vacancies mainly in two properties.
For the property on the left side of the slide, we believe that there is a rent gap of approximately 10% between the rent we receive from existing tenants and the market rent in the neighborhood. While we regret the tenant departures, we also view this as an opportunity to accelerate internal growth. We will therefore pursue an aggressive and proactive leasing strategy aimed at filling vacancies and driving internal growth.
On the other hand, for the property on the right side of the slide, while the supply-and-demand conditions in the surrounding market are showing signs of improvement, we currently assess the balance as being somewhat loose. We will analyze market conditions and tenant needs, and leverage the Mitsubishi Estate Group’s leasing capabilities to work toward early backfilling.
Growth Targets Published in April 2025
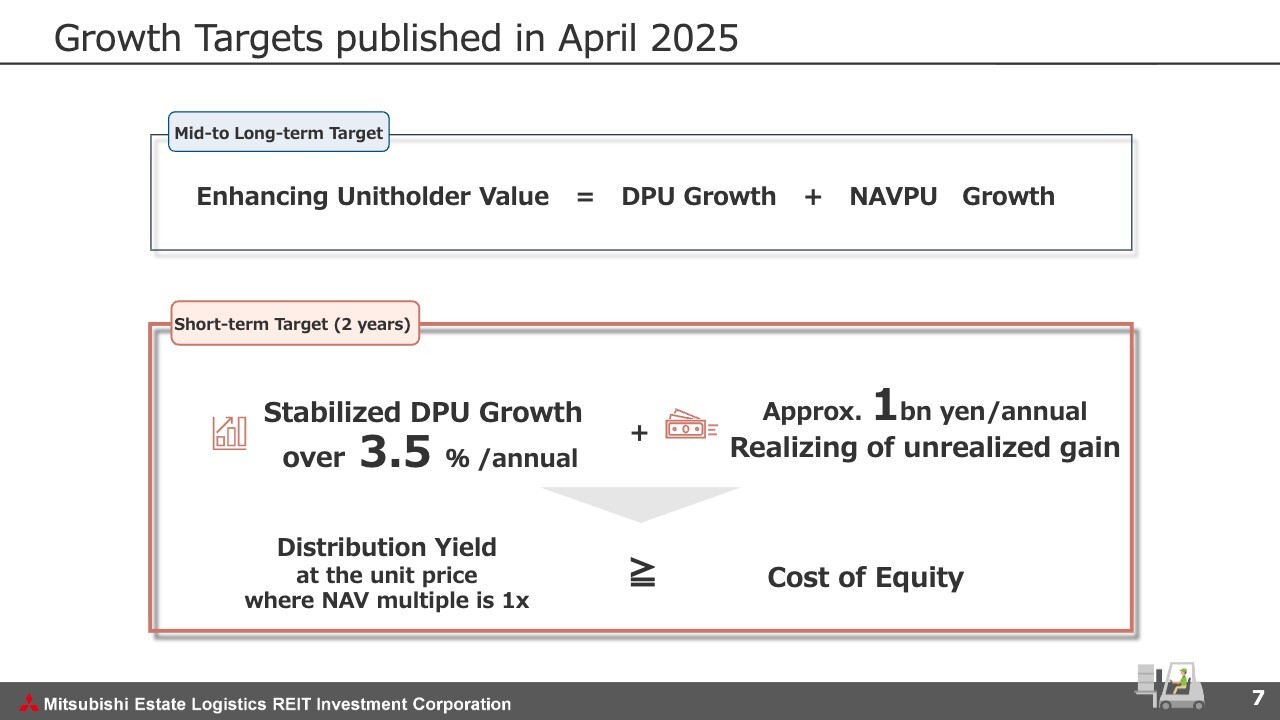
Let me now discuss our growth strategy. This slide outlines the short-term targets (for about two years) that we set in April 2025: “Stabilized DPU Growth of over 3.5% per annum” and “Realizing an unrealized gain of approximately 1 billion yen per annum”. I will elaborate on these from the next slide.
Revision of DPU Growth Targets
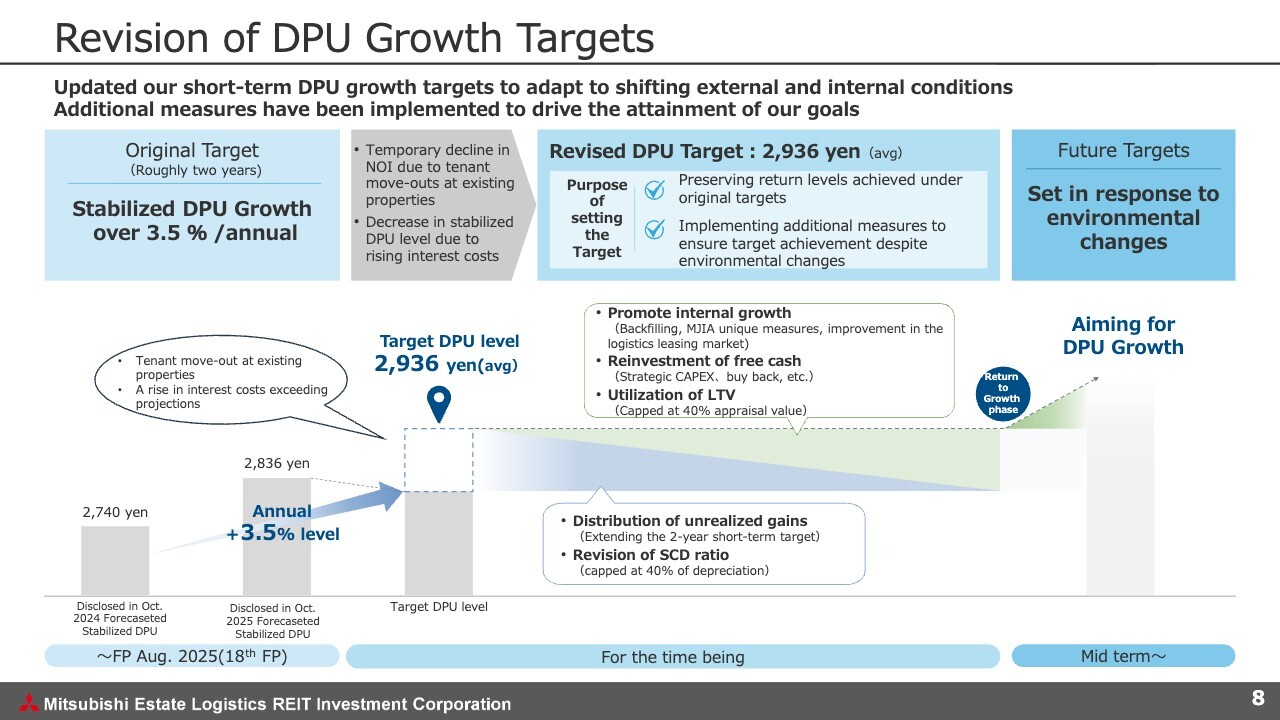
This slide describes our DPU growth targets. MEL has set a target of achieving a stabilized DPU growth rate of 3.5+% per annum for a two-year period. We achieved this target in the first year and are now entering the second year.
As I mentioned earlier, considering temporary vacancies in our portfolio, the larger-than-expected rise in interest rates over the past year and the changes in the financing environment, business environment has become more volatile than we had originally anticipated. Accordingly, we decided to review our targets to better reflect the current environment.
We will maintain the revised DPU target at a level in line with the current stabilized DPU target of 2,936 yen, which we presented in our most recent earnings briefing.
Previously, we identified internal growth driven by rent increases, strategic CAPEX, and external growth leveraging LTV as the drivers of DPU growth. In addition to these factors, we will continue to return unrealized gains for the time being to help offset temporary declines in DPU. We will also review other factors such as the ratio of regular surplus cash distributions.
Going forward, until vacancies are filled, cost increases are stabilized, and the market shifts into an upward trend, we aim to achieve an annual average DPU of 2,936 yen.
Returning Capital Gains to Unitholders
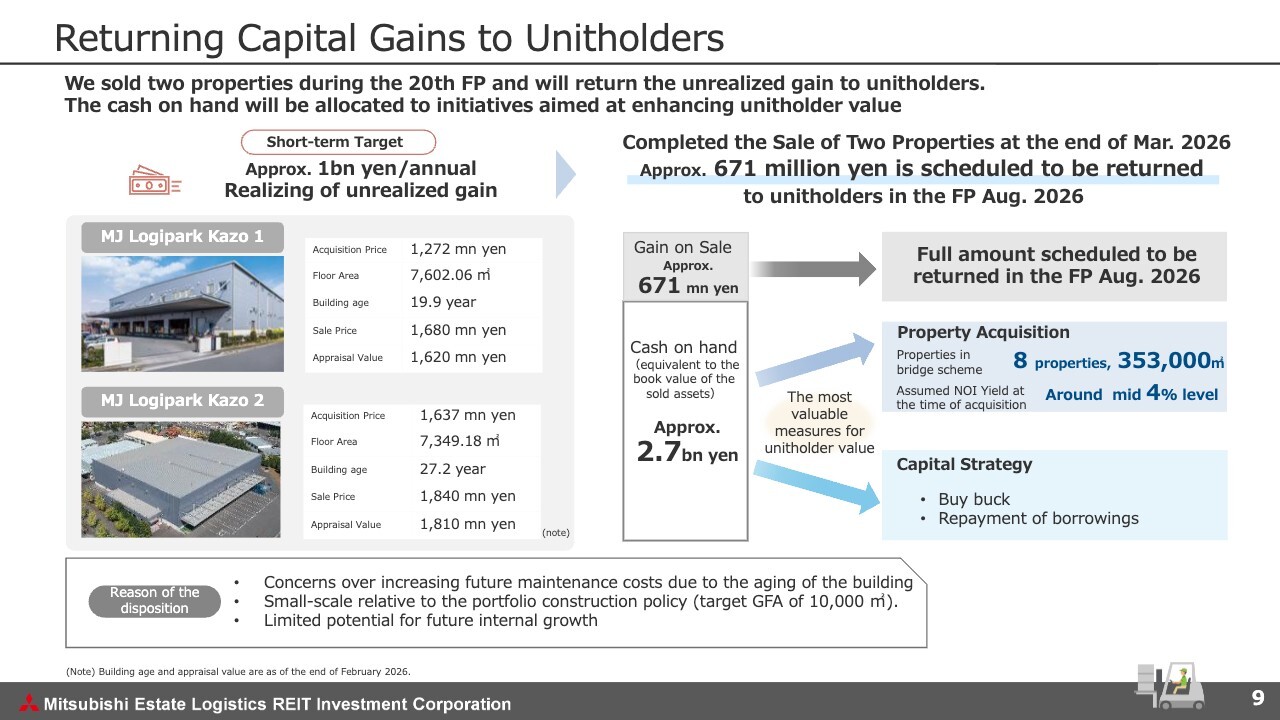
This slide describes the distribution of capital gains. We sold two properties—MJ Logipark Kazo 1 and MJ Logipark Kazo 2—at the end of March 2026. The selection of these properties was based on factors such as their size, age, and the extent to which they could contribute to MEL’s operations going forward.
We had initially been working to complete the sale by the end of the 19th fiscal period, but due to circumstances on the buyer’s side, this did not happen until the end of March. We estimate that the gain on sale will be approximately 670 million yen, which we plan to return to unitholders during the current 20th fiscal period.
The actual disposition process resulted in a smaller gain than our short-term target of approximately 1 billion yen per year, which I mentioned earlier. However, given that they were acquired for around 2.9 billion yen in total, we consider the realization of approximately 670 million yen to be a generally favorable transaction.
MEL currently retains approximately 2.7 billion yen in cash, equivalent to the book value of the two properties sold. We plan to use these funds to the initiatives that will most enhance unitholder value, selecting from options, such as property acquisitions, unit buybacks, repayment of borrowings.
That concludes our report on the financial results and MEL’s growth targets.
Internal Growth Strategy
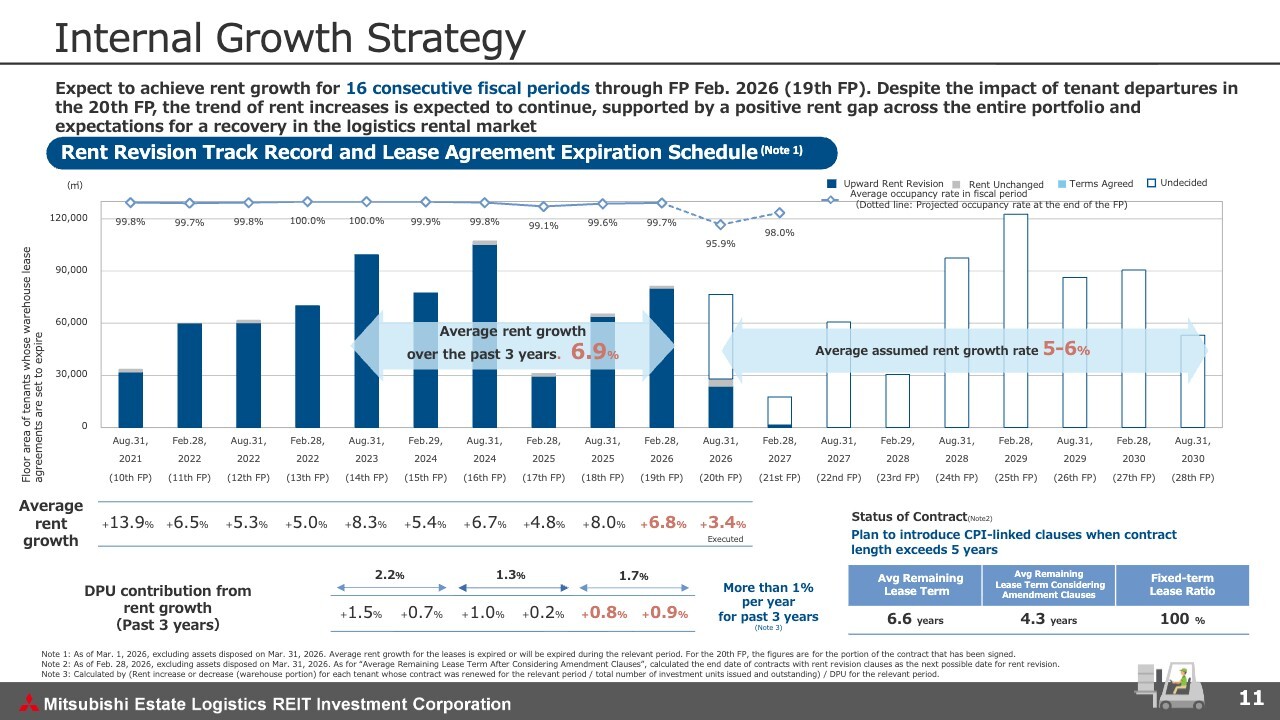
Next, I will discuss our initiatives to enhance the unit price of MEL.
In terms of internal growth, in the 19th fiscal period, we achieved a 6.8% rent increase for the portions whose lease agreements that came up for renewal, marking the 16th consecutive period of upward rent revisions. In the 20th fiscal period, several properties are expected to see tenant move-outs, and a relatively large portion of contracts remains unrenewed at this point. On the other hand, for portions where contracts have already been executed, the upward rent trend continues.
Internal Growth by MJIA’s Unique Initiatives and Strategic CAPEX
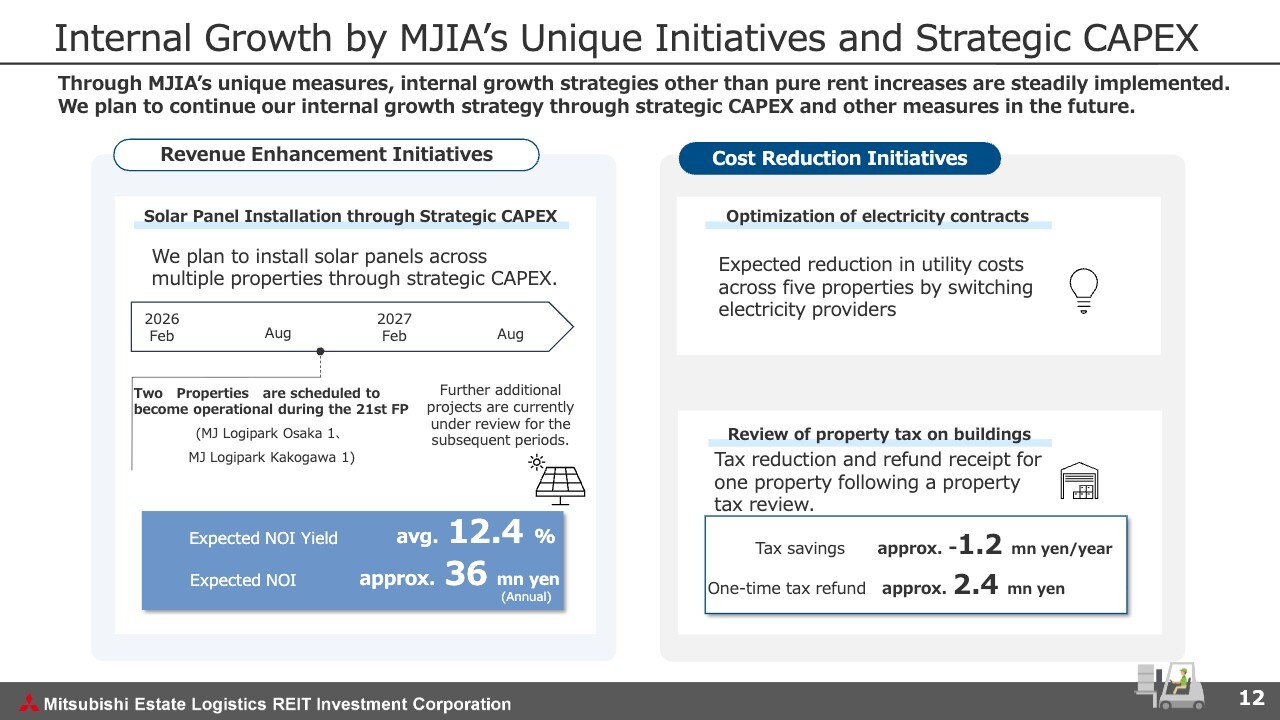
Let me share with you some of MJIA’s unique initiatives for driving internal growth, which are not purely based on rent increases. The left side of the slide covers the strategic CAPEX initiatives aimed at increasing revenue, which we presented in the previous period. MEL plans to invest in and install solar panels on the rooftops of its logistics facilities and lease them to power generation operators.
The expected NOI yield from this initiative is 12.4%, which is highly attractive. Currently, this project is underway at two properties, and we are exploring the feasibility of implementing similar initiatives at other properties as well.
In addition, we have achieved certain results by working to contain increases in operating expenses through measures such as optimizing electricity contracts and reviewing property tax assessments.
I will explain our external growth strategy on the following slides.
Pipeline to Realize External Growth Strategy
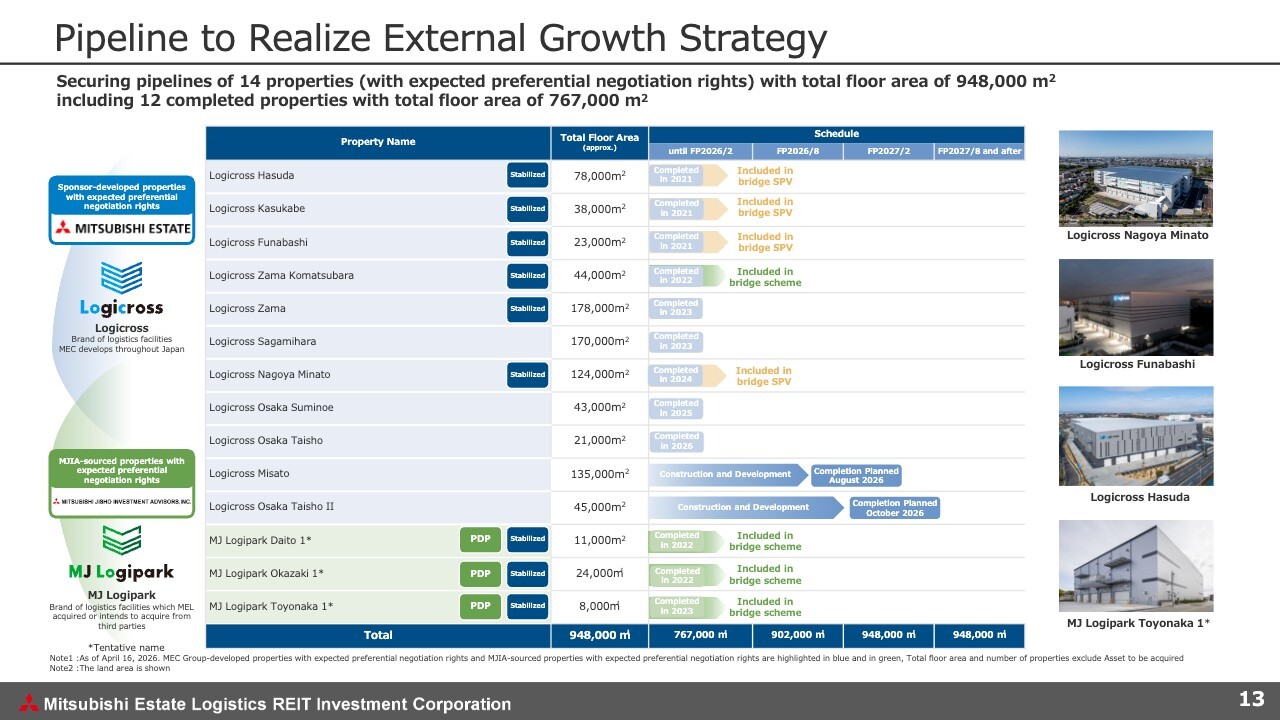
This is our pipeline. As of April 17, 2026, we have secured a pipeline of 14 properties totaling approximately 940,000 m2, consistent with the previous fiscal period. We will leverage these assets to achieve external growth that enhances unitholder value, while taking market conditions into account.
Utilizing Bridge SPV and Progress of Securitization Scheme with LLR
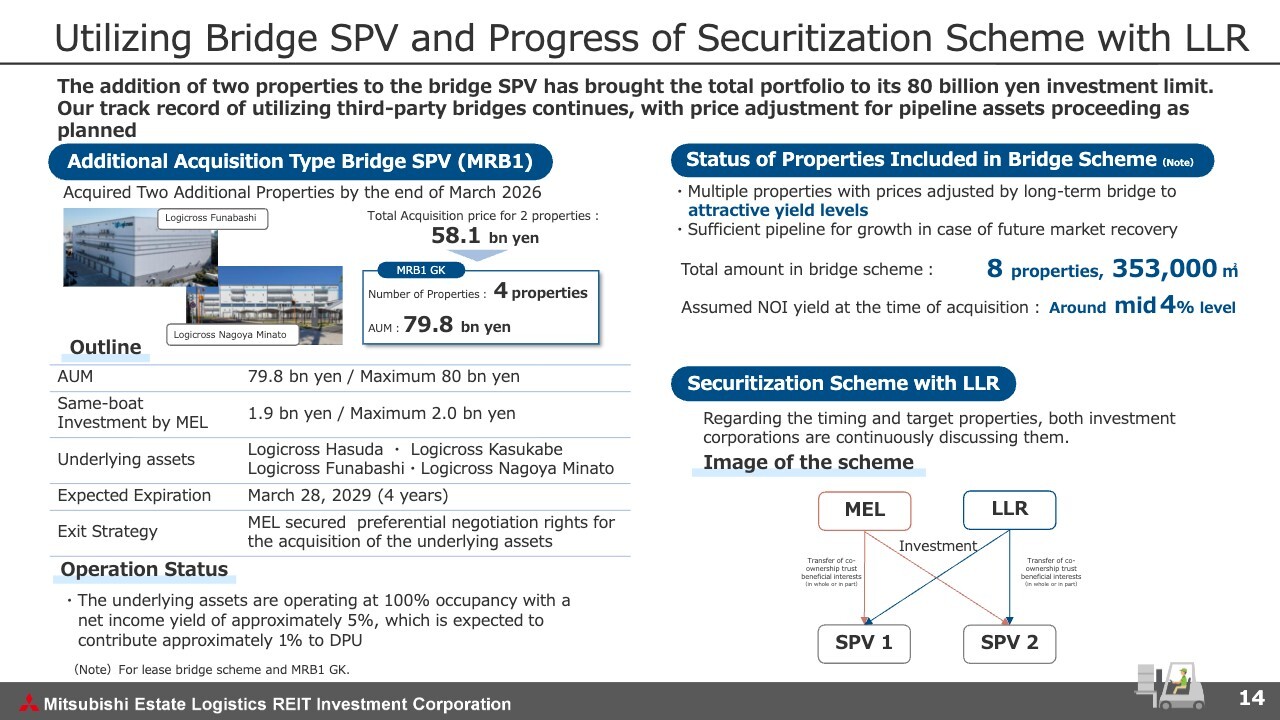
I will now explain the bridge schemes currently utilized by MEL, as well as the schemes involving SPVs that we are considering for the future.
Please take a look at the left side of the slide. As announced in March 2025, we have begun operating a bridge SPV with the aim of diversifying our bridge financing methods. This SPV was structured to expand its portfolio to a maximum of 80 billion yen, with the period up to the end of March 2026 designated as the additional acquisition period. Since the start of operations, it has additionally acquired Logicross Funabashi and Logicross Nagoya Minato, and has completed the acquisition of all four properties—totaling around 79.8 billion yen—by the above deadline.
MEL has also invested approximately 1.9 billion yen in the SPV, and we estimate that the dividend income from this investment will have an impact of approximately 1.0% on our DPU.
In the upper right of the slide, we provide details on the status of properties included in the third-party bridge scheme, in addition to the said SPV.
As of today, there are a total of eight properties included in the bridge scheme, and the assumed NOI yield upon acquisition by MEL is in the mid-4% range, which is an attractive level compared to the current real estate transaction market. We will consider acquisitions while taking into account the future J-REIT market conditions and MEL’s implied cap rate.
We are also engaged in ongoing discussions with LaSalle LOGIPORT REIT (LLR) regarding the joint securitization scheme shown in the lower right of this slide.
Financial Strategy
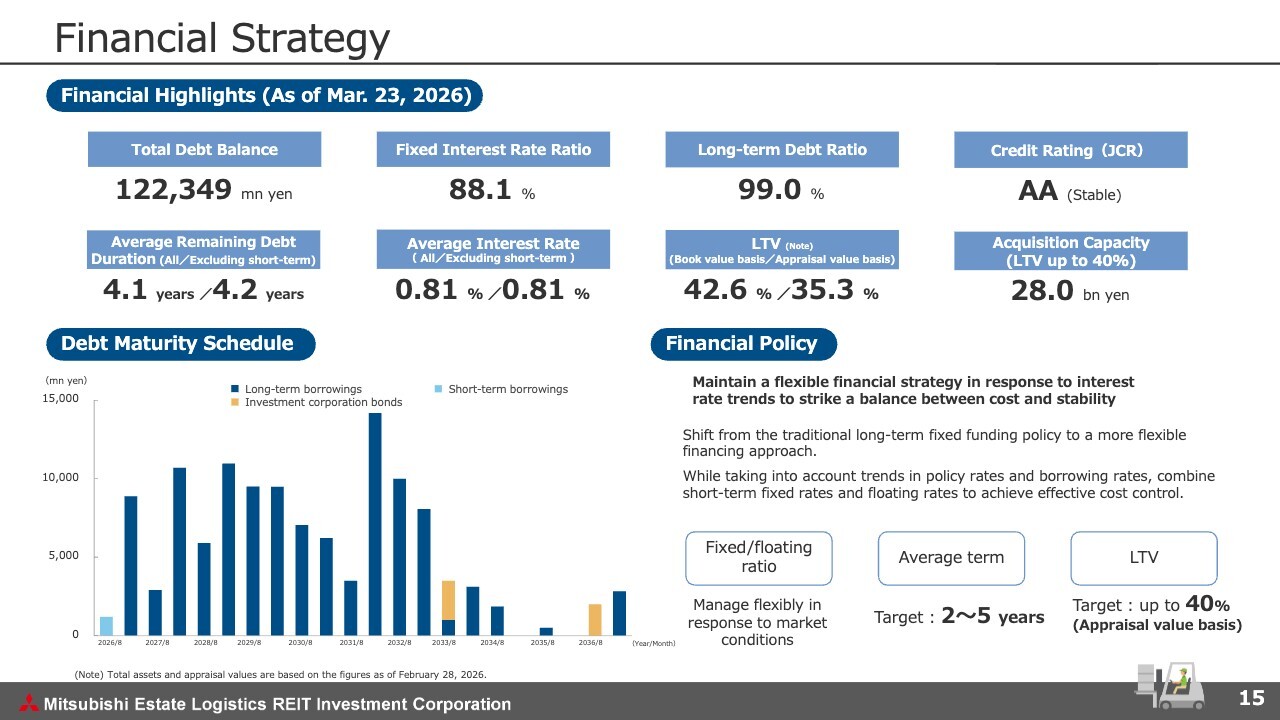
Let me move on to the financial strategy. We continue to maintain stable financial management by leveraging the Mitsubishi Estate Group’s strong creditworthiness.
As shown in the bottom right of the slide, with regard to future financing, in light of the current financial environment, we believe that setting a specific fixed interest rate ratio may not necessarily be optimal for us. Therefore, we plan not to set a specific target ratio of fixed interest rate for the time being. However, we do not anticipate a significant decline from the current ratio.
At the same time, we aim for an average financing term of around 2–5 years, seeking to strike a balance between stability and cost control.
As mentioned at the beginning, for LTV, we plan to use an appraisal value-based approach as our primary indicator, with a book value-based approach as a reference. For the time being, we intend to operate with an LTV of up to 40% based on appraisal value.
Logistics Market (Supply, Stock)
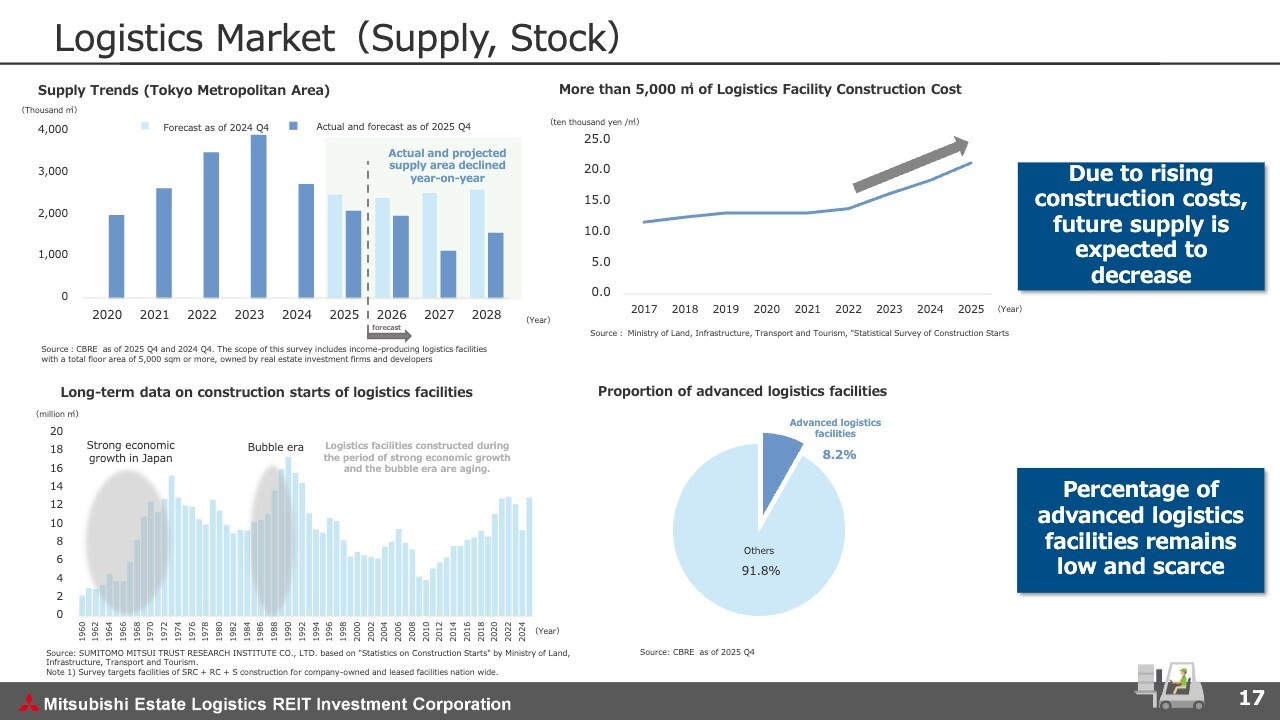
This slide shows the supply trends for logistics facilities. With ongoing increases in labor costs and building material prices, developing logistics facilities is becoming more challenging.
As shown in the graph in the upper left, the projected supply of logistics facilities is decreasing. Compared to forecasts from a year ago, the supply constraint is even more apparent.
On the other hand, as shown at the bottom of this slide, the logistics facility stock continues to age. In addition, although supply has been abundant in recent years, the proportion of advanced logistics facilities remains low at less than 10%. Based on this, we believe that our portfolio has a high degree of scarcity.
Logistics Market (Demand)
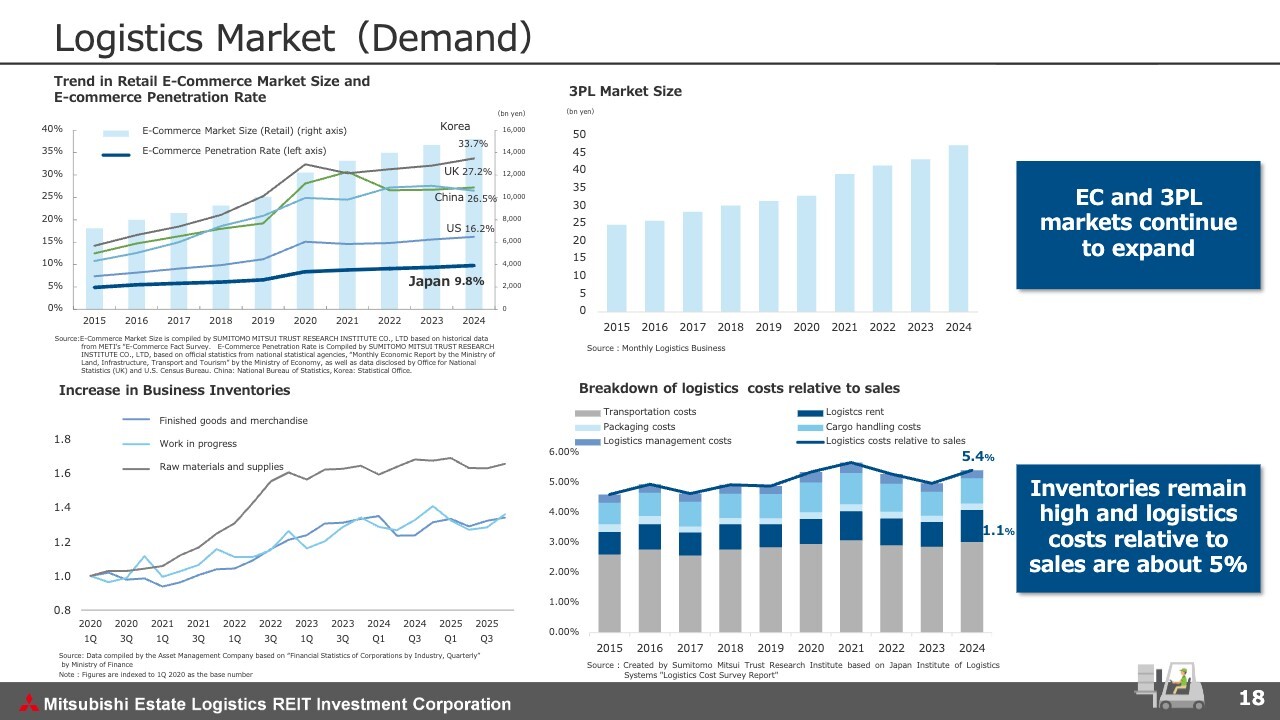
This shows the demand trend for logistics facilities. Supported by the global penetration of e-commerce and the increasing trend among businesses to outsource logistics operations to third parties, we believe that the demand for efficient logistics facilities remains strong.
In addition, corporate inventories remain high due to robust business activities, and logistics costs relative to their sales are contained at around 5%, which indicates that stable demand is expected to continue.
Logistics Market Overview: Supply-Demand Trends by Region
Logistics Market Overview: Supply-Demand Trends by Region
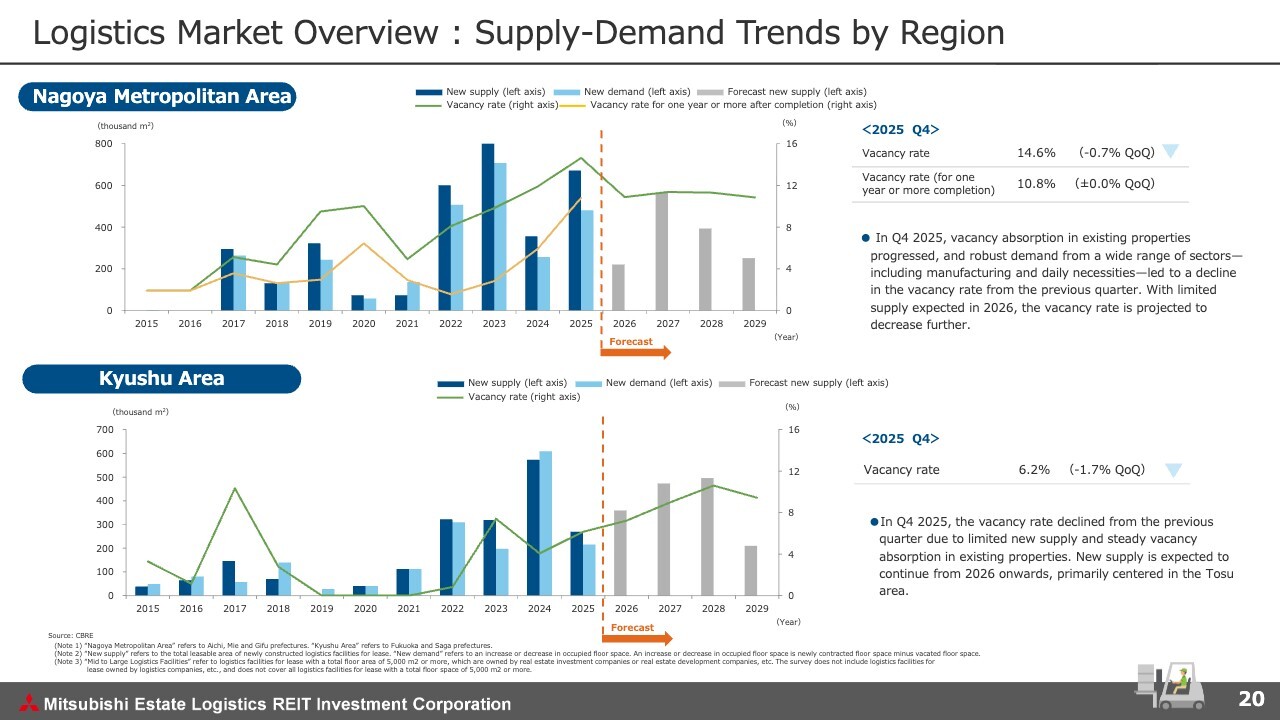
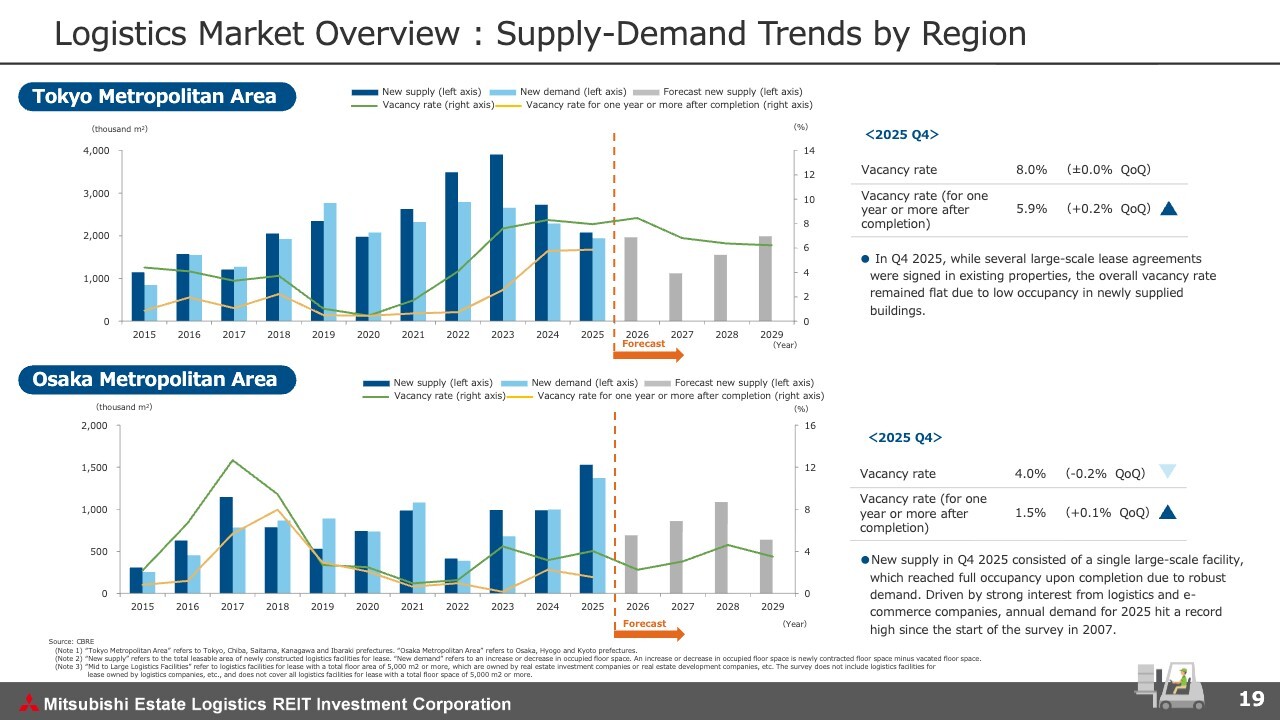
Pages 19 and 20 outline the supply-and-demand trends by region; a common trend across all major metropolitan areas is that future supply is expected to be moderately constrained. Currently, the supply-and-demand balance has eased in some areas due to a large volume of new supply. Nevertheless, as stated on the previous page, we anticipate that, supported by steady demand, the market will shift toward conditions that favor property owners.
This concludes my presentation. Thank you for your attention.
Q&A: Revision of the Growth Targets and Plan for Stabilized DPU
Questioner: I’d like to clarify a few points regarding the “Revision of DPU Growth Targets” on page 8. It states that the revised DPU target is 2,936 yen per year on average. Is it correct to interpret this strictly as an average figure? I would also like to confirm whether the DPU may fluctuate, for the time being, in each fiscal period, and whether my understanding that this target will take effect from the fiscal period ending August 31, 2027 is correct.
Also, I understand that this revision is partly due to tenants moving out of the two properties mentioned earlier. Once leasing is complete and the properties are operating at full capacity, what percentage growth in the stabilized DPU do you anticipate over the next few years?
I suppose that the original growth target of “DPU growth of 3.5% + return of capital gains” was withdrawn for the aforementioned reasons. With that in mind, it would be helpful if you could tell us what level of stabilized DPU you are aiming for, excluding any one-off factors. What are your thoughts?
Yokota: We previously set an annual average of 2,936 yen as a stabilized DPU baseline, excluding gain on sale. However, given the temporary occurrence of vacancies, we have revised this target to include the gain on sale. As there may be fluctuations from period to period, we are presenting this as an average figure.
We plan to apply the new target from the current fiscal period (ending August 31, 2026) onwards, and review our approach. We believe that any temporary vacancies can be filled. At the same time, interest rates are rising at a somewhat rapid pace.
Our immediate priority is to fill vacancies and steadily pursue internal growth. At the same time, we will carefully monitor trends in rising interest rates and develop a new internal growth strategy.
Q&A: Expected Yield Level on Pipeline Assets
Questioner: My questions relate to the pipeline on page 13 and the bridge SPV on page 14.
It says that the assumed yield level for the eight properties in the bridge SPV is in the mid-4% range, partly due to the reduction in book value. Compared to them, what is the expected yield level for the other properties listed on page 13?
Could you also share with us whether the current yield is lower than that of the bridge SPV, or if it varies depending on the property? For example, I believe the bridge SPV consists of four properties totaling 80 billion yen, with leveraged and unleveraged yields of around 5% and 4%, respectively. In this context, how should I interpret the group of properties listed on page 13 and on the left side of page 14?
Yokota: Of the properties listed on page 13, those for which an agreement has been reached and which we are able to include at this time are limited to properties already included in this bridge SPV and those already being financed by third parties or leasing companies. We will discuss and determine the expected yield levels for the remaining properties from now on.
As shown in the slide, we believe that the eight properties already included in bridge scheme can generally be acquired at yields in the mid-4% range. We estimate that, with a mix of properties offering high and low yields, the overall yield level will be in the mid-4% range.
Q&A: Differentiation of Logistics Facilities
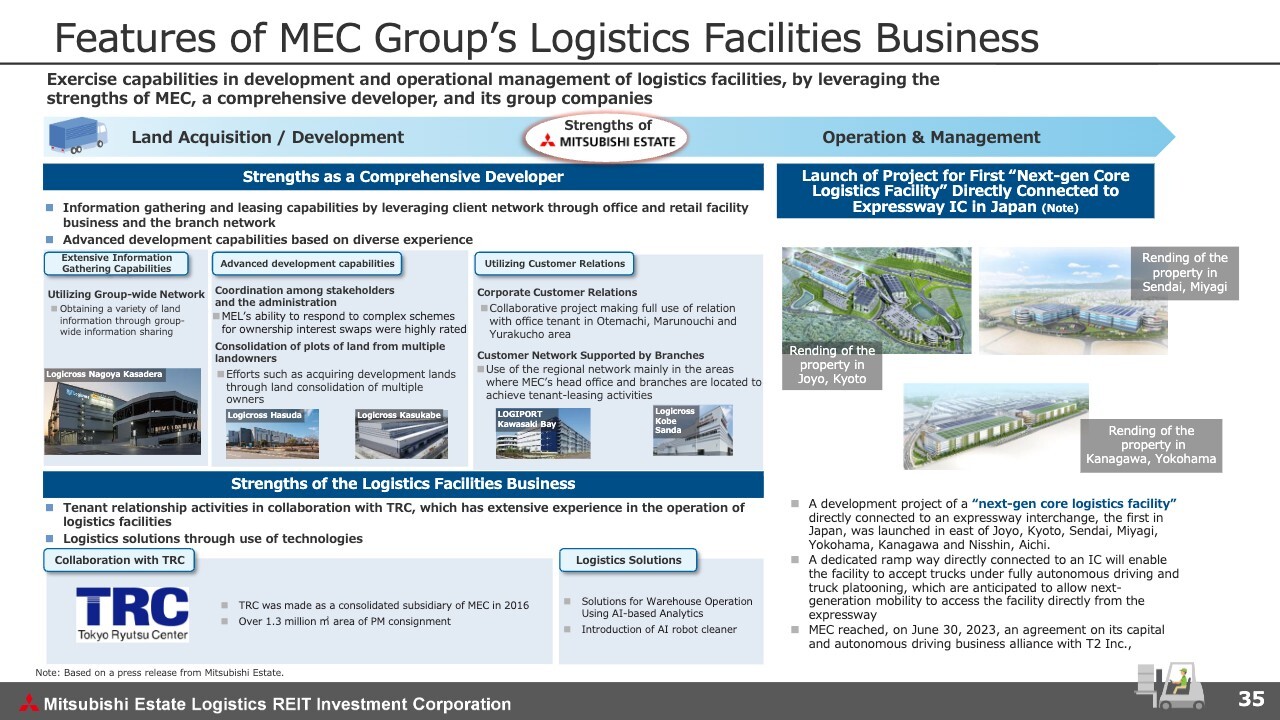
Questioner: Out of curiosity, I have a question regarding the next-generation logistics facility that your sponsor, Mitsubishi Estate, is working on. I’ve seen demonstrations and images of autonomous trucks at logistics seminars and found them quite interesting. I realize this is still some way off, but if the opportunity arises, would you be interested in adding such facilities to your portfolio?
Such properties can easily be distinguished from many other logistics facilities, generating strong demand. Could they therefore become highly attractive even if the yield is somewhat lower? Please share your thoughts on your intentions for acquiring these assets, and how you intend to differentiate your properties. Please feel free to share your personal view.
Yokota: While logistics facilities designed for autonomous truck operations are still in the discussion phase and represent a future prospect, I believe that automation is a very important topic, and that such facilities would be attractive assets. We are definitely interested in moving forward with such initiatives.
Q&A: Revision of DPU Growth Targets
Questioner: I have a follow-up question regarding the revision of the DPU growth target, a topic that was covered in previous conversations. On page 8, it states “Return to Growth phase,” but it also mentions “For the time being.” Can I take this to mean until tenants are secured and revenue begins to flow?
It also states that the distribution of unrealized gains will continue for the time being. Could you please explain how long this transitional phase is expected to last and whether it might end relatively soon?
Yokota: As you pointed out, for our near-term DPU setting, how quickly we can fill vacancies will be a key factor. At the same time, since DPU levels are also affected by factors such as interest rate hikes by the Bank of Japan, we currently expect to enter a steady phase within one to two years.
Q&A: Rent Growth in the Current Fiscal Period and Confidence Level
Questioner: Regarding rent increases, you achieved consistently high growth rates of 8% and 6.8% up until the previous fiscal period, but as of now, increase rate for the period ending August 31, 2026 is 3.4%. Is there a possibility that this figure will rise further? Or do you think it will stabilize at around 5% to 6%? I would be grateful to hear your thoughts on this. Although you plan to continue raising rents going forward, I believe you can expect even higher rates in prime logistics locations. How do you assess the feasibility of this plan and the progress you have made so far? Also, could you share your impressions of the rent growth trend for the current fiscal period?
Yokota: We have set the average assumed rent growth rate at 5-6%. However, overall market conditions remain favorable, with no significant changes.
The rent gap is the difference between the agreed rent and the market rent. Depending on market rent dynamics, some fluctuation is unavoidable. Based on our market rent projections, we adopt a relatively conservative approach to the rent gap for upcoming renewals in the near-term fiscal periods.
Conversely, looking ahead to the latter phase of the chart showing a steep increase, we estimate the rent gap to be at the higher end of the scale and set it at a moderate level of 5% to 6%.
This forecast does not factor in any potential gains resulting from improvements in the supply-demand balance. However, we believe that we can fully expect such an upside as we move towards the latter half of the projection period.
In other words, many contracts are close to renewal in the first half of the projection period, as a result, we are taking a relatively conservative view on the rent gap at this stage.
Q&A: Securitization Scheme with LaSalle LOGIPORT REIT
Questioner: I have a question about the securitization scheme with LaSalle LOGIPORT REIT. You mentioned that MEL is engaged in ongoing discussions, but I recall hearing similar remarks six months ago. Could you please share what progress has been made over the past six months, to the extent possible?
Yokota: The two parties already jointly own several properties and maintain ongoing communication, including throughout the operational phase. While discussions are still ongoing, we will make a separate announcement if any plans materialize.
Remarks from Mr. Yokota
Once again, thank you for taking the time out of your busy schedules to attend the financial results briefing for the fiscal period ended February 28, 2026 (19th period) of Mitsubishi Estate Logistics REIT Investment Corporation today. We will continue our efforts to meet the expectations of our investors, and we sincerely appreciate your continued support.