INDEX
Satoshi Konno (hereinafter “Konno”): I am Satoshi Konno, Executive Vice President of Finance & Director, RACCOON HOLDINGS, Inc. Thank you very much for joining us today.
Here is today’s agenda. First, I will explain the financial results of the third quarter of the fiscal year ending April 2026 (FY4/2026 Q3). Following that, I will touch upon the progress and future priority measures in the business we are advancing in partnership with Advantage Partners since last November. Next, I will explain our desired future state for 2031, outlining what we aim to achieve five years from now. Finally, I would like to briefly mention the change in our dividend policy as well.
Points of FY4/2026 Q3 Financial Results
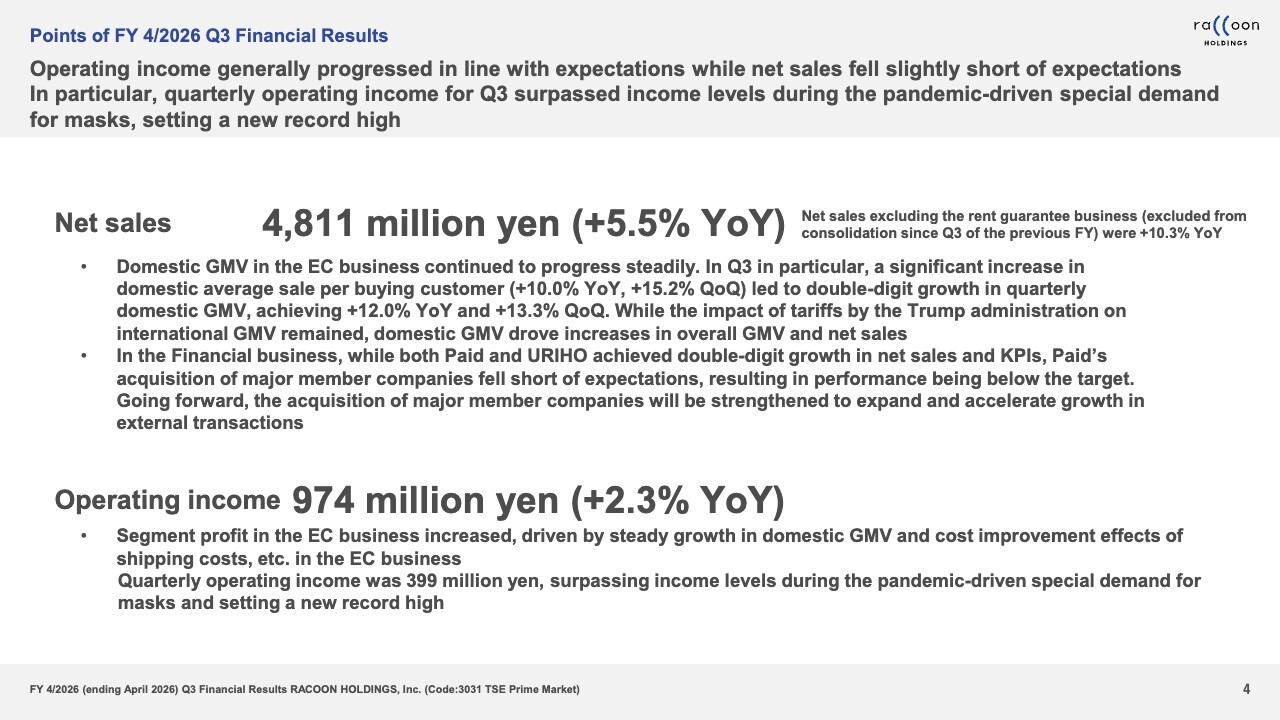
I will now explain the results for the first nine months of FY4/2026. Net sales were ¥4,811 million, up 5.5% YoY. Operating income was ¥974 million, up 2.3% YoY.
One point to note regarding the net sales is that they increased 5.5% YoY. However, please note that the YoY growth rate appears slightly lower due to the impact of the sale of the rent guarantee business previous operated by the Company, which was excluded from consolidation on November 1, the beginning of Q3 of the previous fiscal year.
Excluding this impact, the underlying YoY growth rate of net sales was an increase of 10.3%, as indicated in the smaller text on the slide, meaning that net sales actually achieved double-digit growth.
Our company operates in two segments: the EC business and the Financial business. While I will elaborate on the details later, the most significant changes in this quarter occurred within the domestic operations of our EC business.
Gross Merchandise Volume (GMV) in our domestic EC business is calculated by multiplying the average sale per buying customer and the number of buying customers. We have been working hard to improve the average sale per buying customer, and this quarter it improved significantly, increasing 10% YoY and 15.2% QoQ.
As a result, domestic GMV achieved double-digit growth, rising 12% YoY and 13.3% QoQ. This growth represents the most significant contributor to the net sales in this quarter’s financial results.
On the other hand, the impact of tariffs imposed by the Trump administration continues to affect the international EC business. In the Financial business, both Paid and URIHO recorded relatively steady double-digit growth.
However, contrary to projections, Paid’s acquisition of major member companies fell slightly short of expectations. We consider this point a challenge for the future.
Operating income was ¥974 million, setting a new record high for a quarter. We have previously experienced a pandemic-driven special demand for masks, temporarily boosting income for the period significantly. Now, we have finally surpassed that level, and we view this extremely positive news for us.
Consolidated Results|Summary
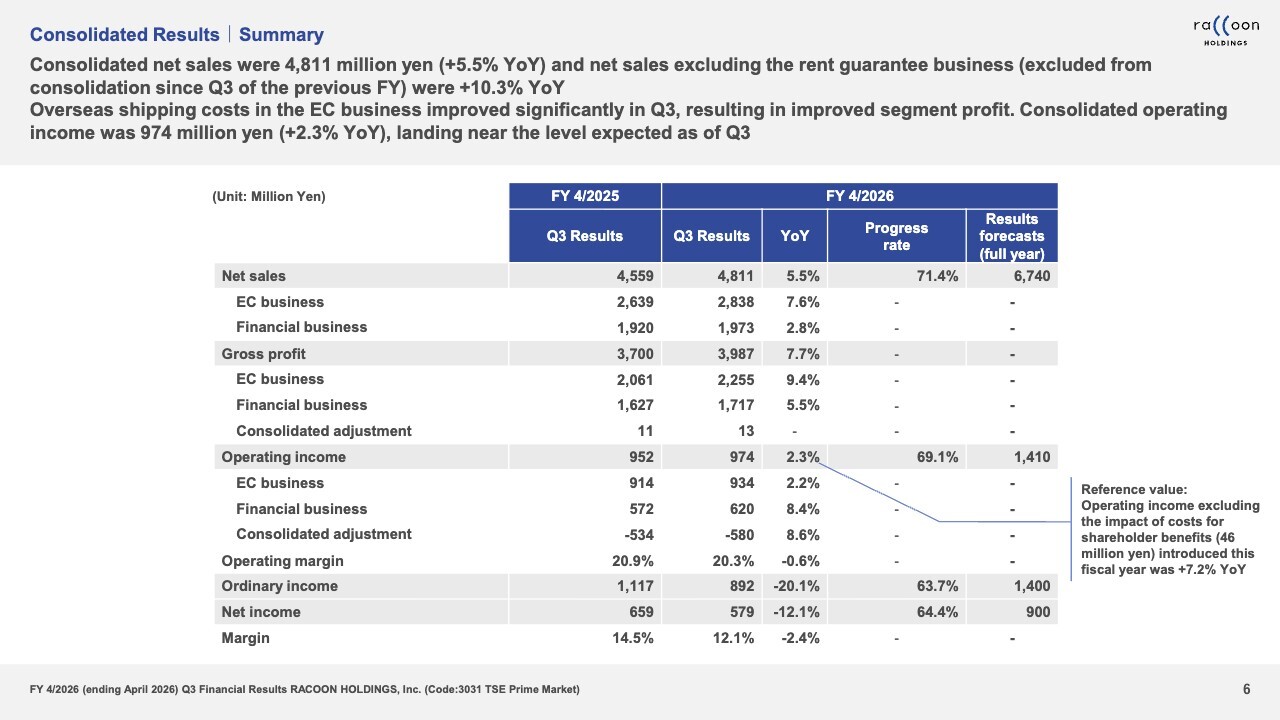
Now, let me provide a little more details. Consolidated net sales for the first nine months of FY4/2026 were ¥4,811 million. Gross profit was ¥3,987 million, up 7.7% YoY, and operating income was ¥974 million, up 2.3% YoY.
There are two points to note for this fiscal year. First, we have introduced a shareholder benefit program starting this period. As a result, we recorded an additional cost of ¥46 million in Q2. This was not present last year and had an impact on operating income.
Second, as communicated in our previous financial results briefing, we incurred significant losses from the overseas shipping costs for the EC business in Q1 and Q2.
A ¥30 million loss in Q1 and a ¥20 million loss in Q2 directly impacted operating income negatively. While these losses were recorded as a negative figure in operating income, the shipping cost issue has been completely resolved in Q3. I will explain the details later.
Q3 reversed the trend, achieving a ¥4 million profit, effectively eliminating the negative impact from Q1 and Q2. However, on a cumulative basis, the combined ¥50 million loss in Q1 and Q2 continues to weigh on operating income.
Consolidated Results|Summary (Excluding Advertising and Sales Promotion Expenses)
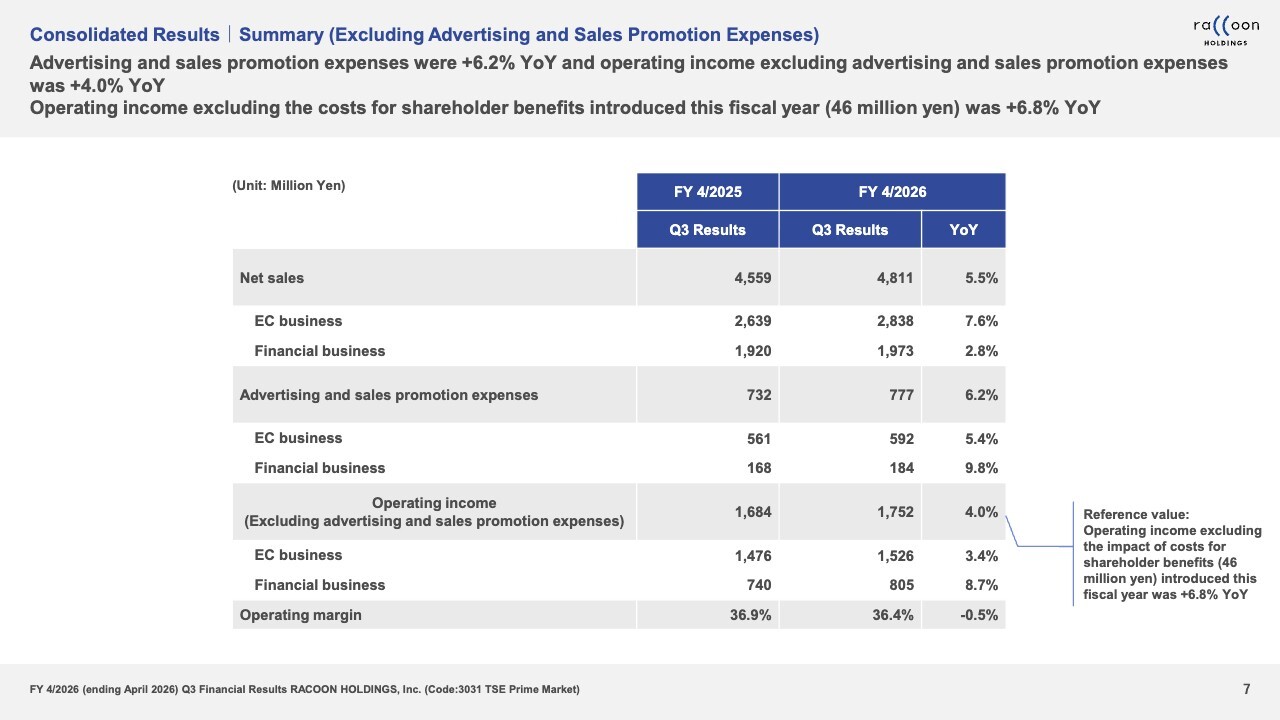
The slide shows the statements of income (P/L) excluding advertising and sales promotion expenses. Since the content is largely the same as the previous slide, please review it later for your further reference.
Consolidated Results|Trends in the Group GMV and URIHO Guarantee Balance
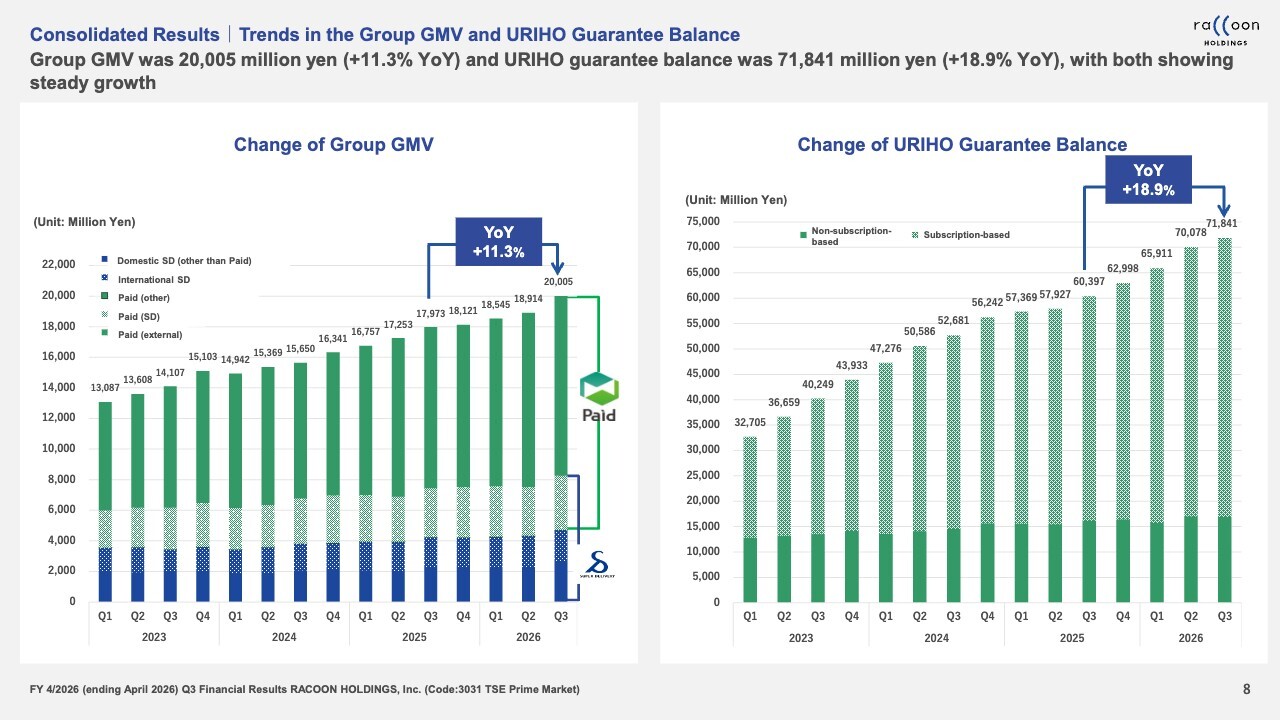
Let me explain Group GMV and the URIHO guarantee balance. Group GMV represents the scale of transactions handled through our services with the small and medium-sized enterprises (SMEs). Our primary customer base are SMEs, and this figure reflects the overall volume of transactions we handle.
For the combined value of SUPER DELIVERY and Paid, the portion of SUPER DELIVERY where Paid is used for settlement has been adjusted to eliminate double counting. We can see from the chart that this transaction value exceeded approximately ¥20.0 billion for Q3.
The URIHO guarantee balance represents the portion of SME receivables for which we assume credit risk. In other words, it reflects the amount of transactions where we provide credit guarantees and take on the associated risk. As of the end of Q3, the balance stood at approximately ¥71.0 billion.
Currently, we have been promoting the Raccoon BtoB Network as our medium-to-long-term vision. This aims to expand Group GMV, that is, the number of SMEs we reach.
If progressed steadily, the Raccoon BtoB Network is expected to drive significant growth, particularly in group GMV. We view this as a highly important metric going forward.
Consolidated Results|Trends in Consolidated Net Sales (Cumulative)
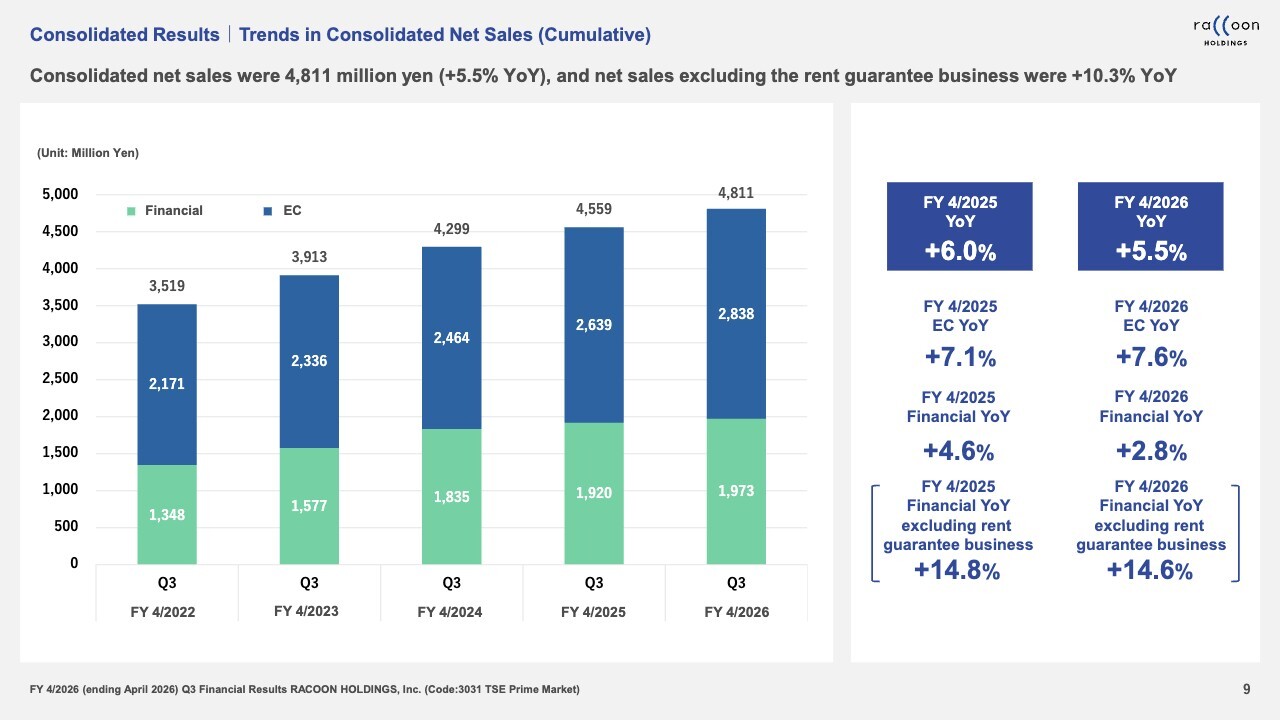
The slide shows YoY changes of cumulative net sales side by side. Excluding the rent guarantee business, this represents a YoY growth of 10.3%. Breaking it down into the EC business and the Financial business, the EC business achieved a YoY growth rate of 7.6% for the first nine months of FY4/2026.
The Financial business achieved double-digit growth, with a YoY increase of 14.6% excluding the rent guarantee business.
Consolidated Results|Trends in Net Sales (by Quarter)
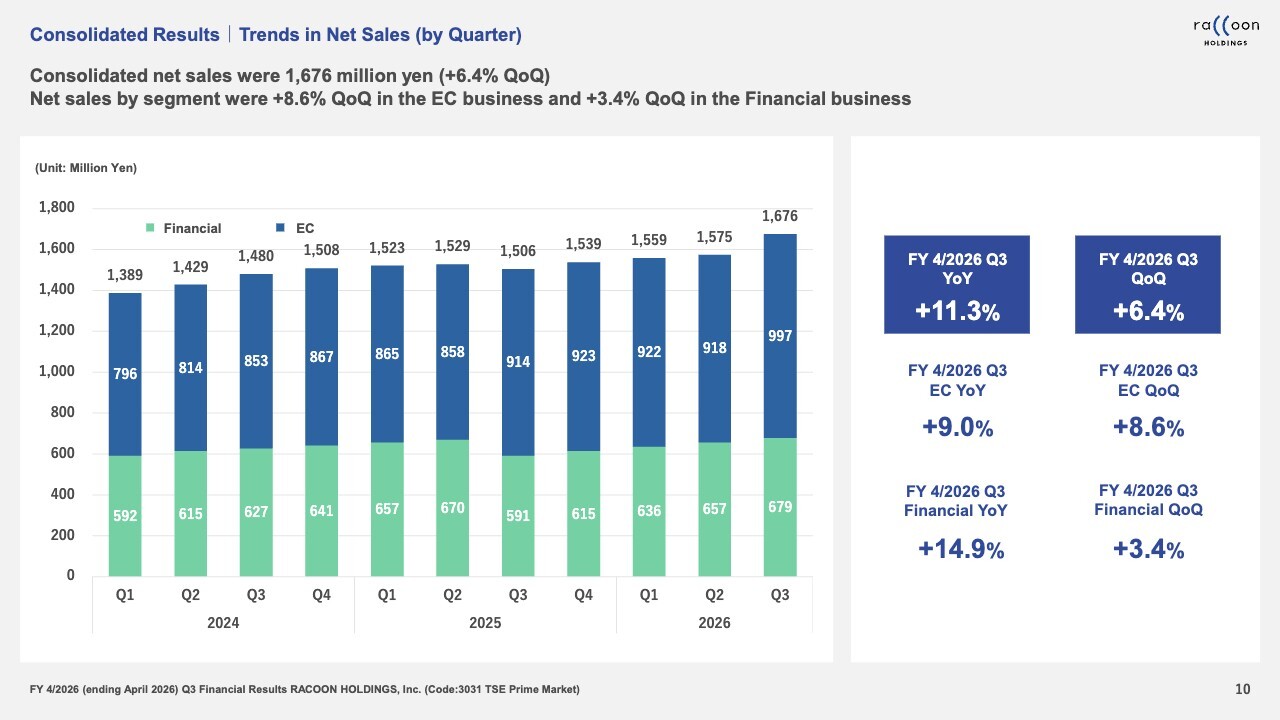
Here are the quarterly trends in net sales. Q3 saw very strong performance, and as you can see from the graph on the slide, our EC business has been growing steadily. At ¥997 million for the quarter, it has grown to a level nearly reaching ¥1.0 billion.
Consolidated Results|Trends in Gross Profit (by Quarter)
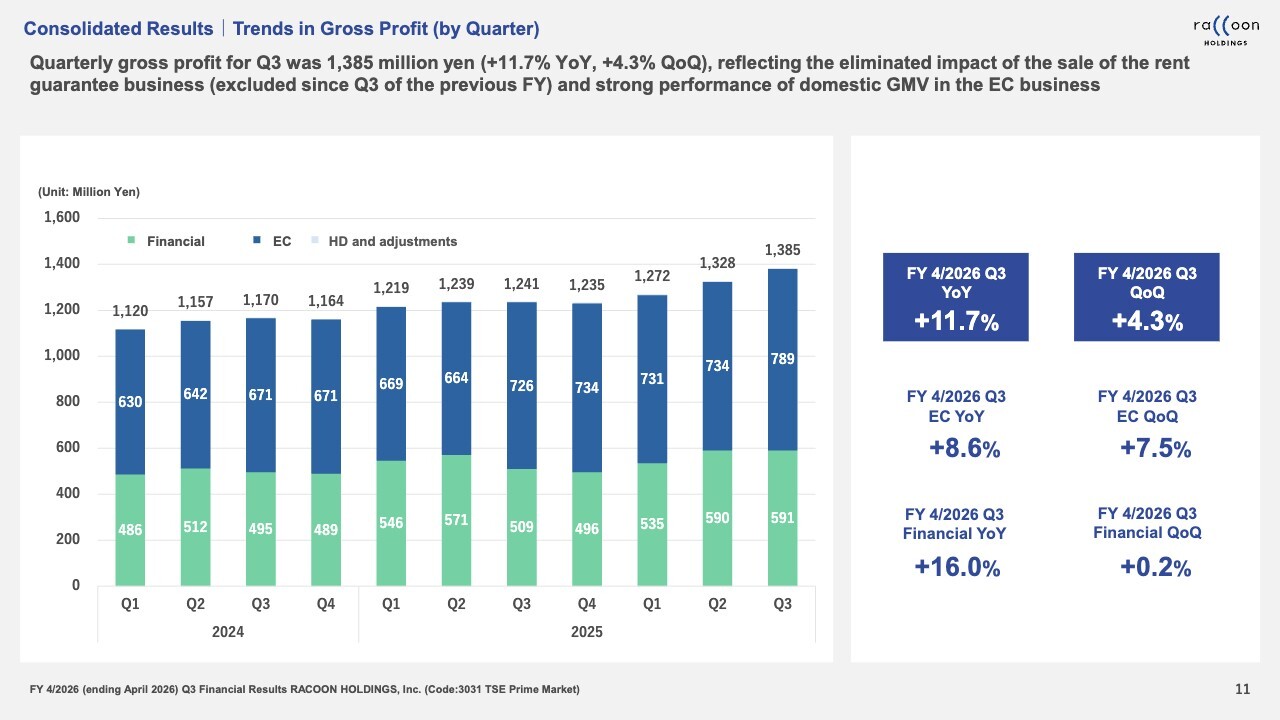
Let me discuss gross profit. Gross profit has increased significantly due to the growth in sales from the EC business. For the Financial business, it has remained largely flat.
This is because, although gross profit would normally increase in line with the 14% growth in net sales, the cost of sales in the Financial business can fluctuate significantly.
Turning to cost of sales, credit costs declined sharply in Q2, which led to a significant increase in profit. However, in Q3, credit costs returned to a normal level, and as a result gross profit remained largely flat. I will explain this further using another graph later.
Consolidated Results|Trends in Expense Composition (Selling, General and Administrative Expenses) (Cumulative)
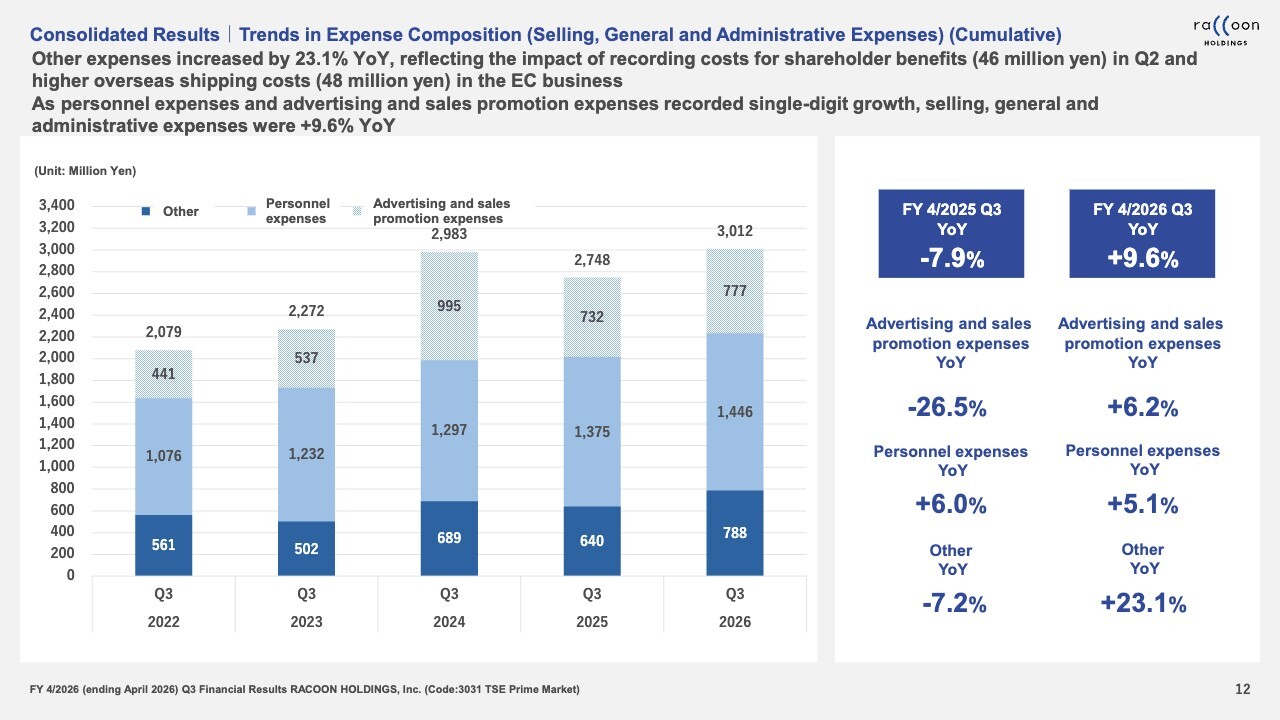
Regarding selling, general, and administrative (SG&A) expenses, the most significant item is “Other,” accounting for ¥788 million in Q3. This includes approximately ¥46 million in costs for shareholder benefits and about ¥50 million in increased overseas shipping costs for the EC business. Going forward, costs for shareholder benefits are expected to be recorded in Q2 and Q4.
Overseas shipping costs remain somewhat volatile. However, the large losses recorded in Q1 and Q2 are considered relatively irregular. As they were partly caused by recurring factors such as the impact of tariffs imposed by the Trump administration, we believe it is reasonable to view them in that context.
Consolidated Results|Trends in Operating Income (Cumulative)
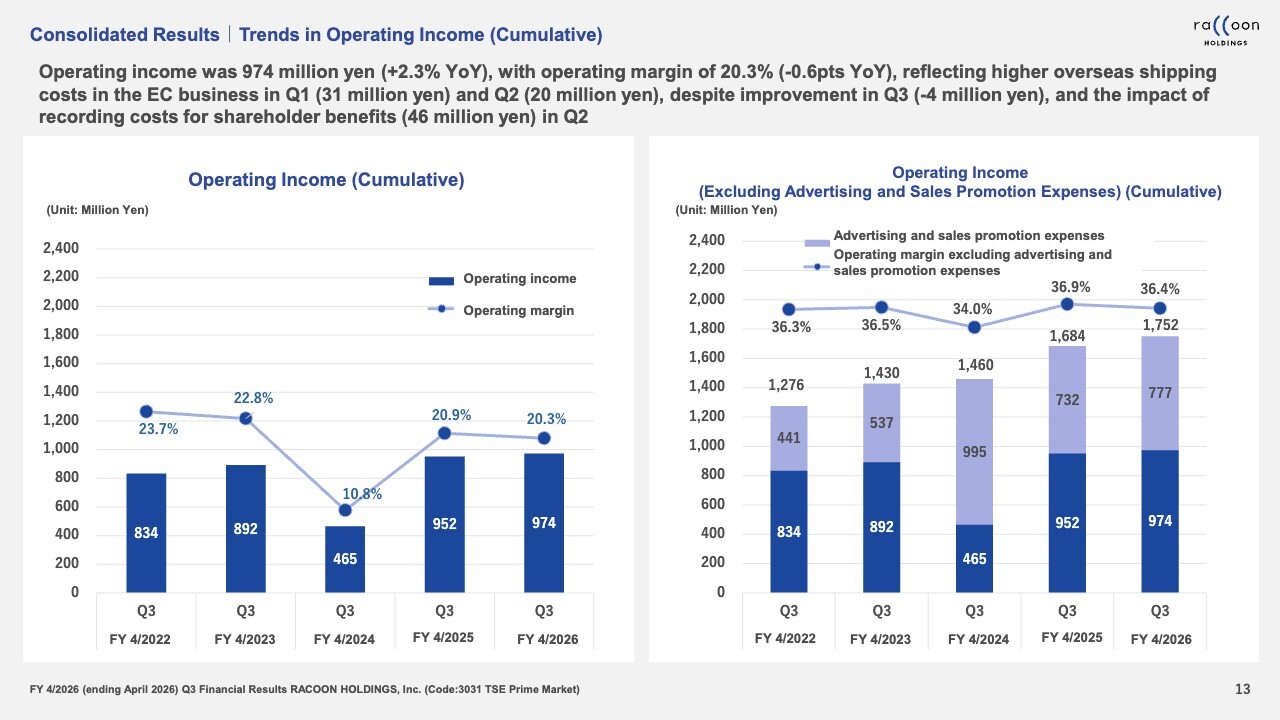
Here are the trends in operating income. Operating income for the first nine months of FY4/2026 was 974 million yen, reflecting the impact of international shipping costs and shareholder-related factors.
Consolidated Results|Trends in Operating Income (by Quarter)
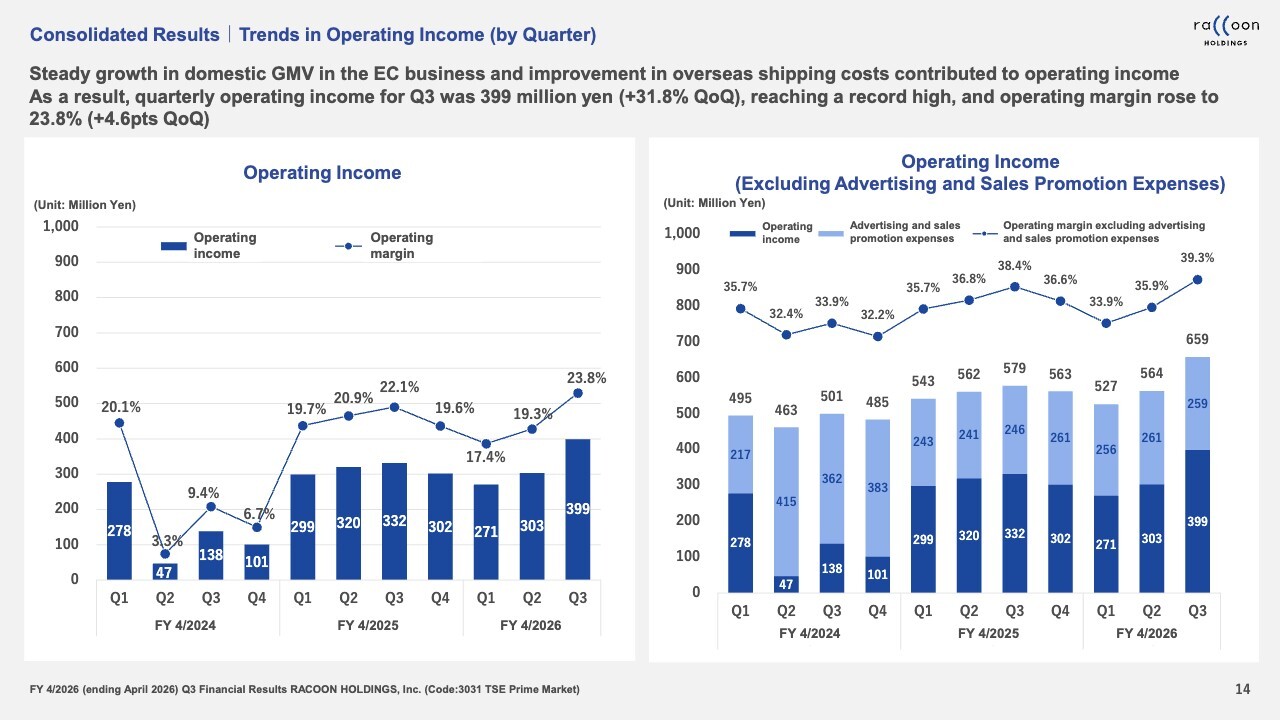
Here is a quarterly comparison of operating income. As indicated on the slide, Q3 saw significant profit growth QoQ.
Q3 operating income was ¥399 million, growing 31.8% QoQ, and reached a record high on a quarterly basis. Although we had hoped to reach 400 million yen, it came in slightly below that level at ¥399 million.
Factors driving this significant increase from Q2 include strong overall sales, particularly in the EC business, as well as the complete elimination of the negative impact from shipping costs. These developments were very favorable and we believe they were key drivers of the profit growth. We are proud of these results.
EC Business|FY4/2026 Q3 Conclusion
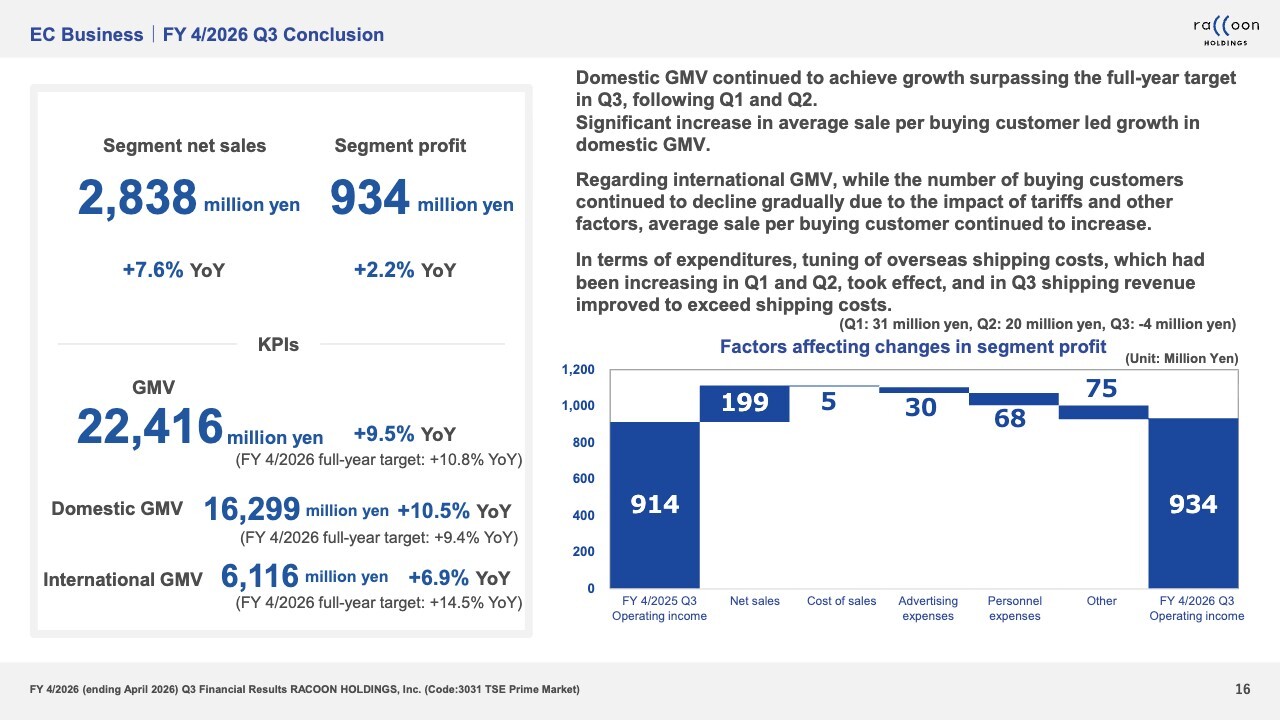
From here, I will provide an overview by segment. First, let me explain the EC business. Net sales for the EC business were ¥2,838 million, with segment profit standing at ¥934 million.
Our KPIs are as shown at the bottom of the slide: GMV reached ¥22,416 million, up 9.5% YoY. However, this result fell slightly short of our full-year target. Breaking it down by region, domestic GMV slightly exceeded the full-year target, while international GMV fell short of the target.
As I briefly mentioned at the beginning, the relatively strong performance in Japan is primarily due to a 10% increase in the average sale per buying customer, which represents a very significant factor.
The number of buying customers was somewhat sluggish in Q3, but we anticipate improvement going forward and will provide more details on this later.
Regarding international GMV, the impact of tariffs has been substantial, leading to a gradual decline in the number of buying customers. However, this decline is not universal and is limited to certain countries. Specifically, while the number of buying customers has decreased in the US, the average sale per buying customer is growing at a rate exceeding that of the domestic customers. As a result, GMV in the US has shown growth of a little under 7%.
Shipping costs are as explained earlier.
EC Business|Domestic EC
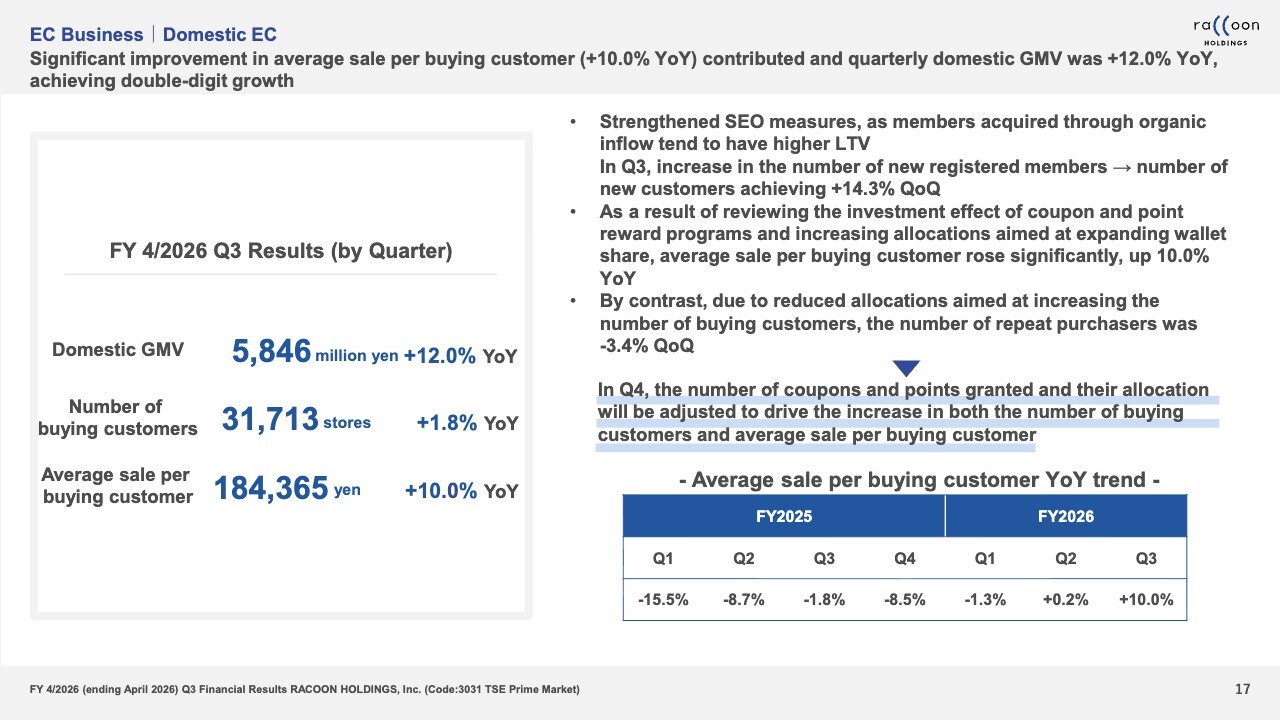
I will now elaborate on the domestic EC business. For the domestic operations, please see the left-hand box on the slide. At the KPI level, the number of buying customers increased 1.8% YoY, while the average sale per buying customer grew 10% YoY.
For the average sale per buying customer, please see the simplified table on the bottom right. This has been a particularly challenging area for us.
Last fiscal year saw negative figures of -15.5%, -8.7%, -1.8%, and -8.5%. Q1 of this fiscal year also showed slight negative growth. It finally stabilized in Q2, turning slightly positive, and then in Q3, the figure surged significantly with a 10% YoY increase.
I will discuss more details because I expect many of you have questions about this, such as “Will this trend continue?” and “Why did this increase happen?” In fact, there is a clear reason for this, and I believe the growth will continue going forward.
Although there are several reasons, one major factor stems from an initiative we implemented. In our EC business operations, point rewards and coupons serve as one of our key competitive advantages.
Previously, we primarily used point rewards and coupons to increase customer numbers, reactivate dormant members, and ensure consistent engagement from new sign-ups. However, in Q3, we made major changes to how we use them, partially as an experiment.
Specifically, we temporarily reduced the coupons previously distributed to increase customer numbers. Considering budget constraints, we shifted their use toward increasing the average sale per buying customer. In other words, we distributed coupons aimed at raising the average sale per buying customer.
This approach proved highly successful, clearly reflected in the average sale per buying customer in the quarter under review. Since this strategy of distributing coupons to boost the average sale per buying customer succeeded, we will continue this strategy going forward.
On the other hand, the number of buying customers increased only very modestly due to the reduction in initiatives aimed at increasing customer numbers. Going forward, we intend to strike a good balance, aiming to achieve both an increase in the average sale per buying customer and an increase in the number of buying customers.
By doing so, we believe future GMV growth can be achieved through the combination of an increase in the number of buying customers and an increase in the average sale per buying customer.
EC Business|International EC
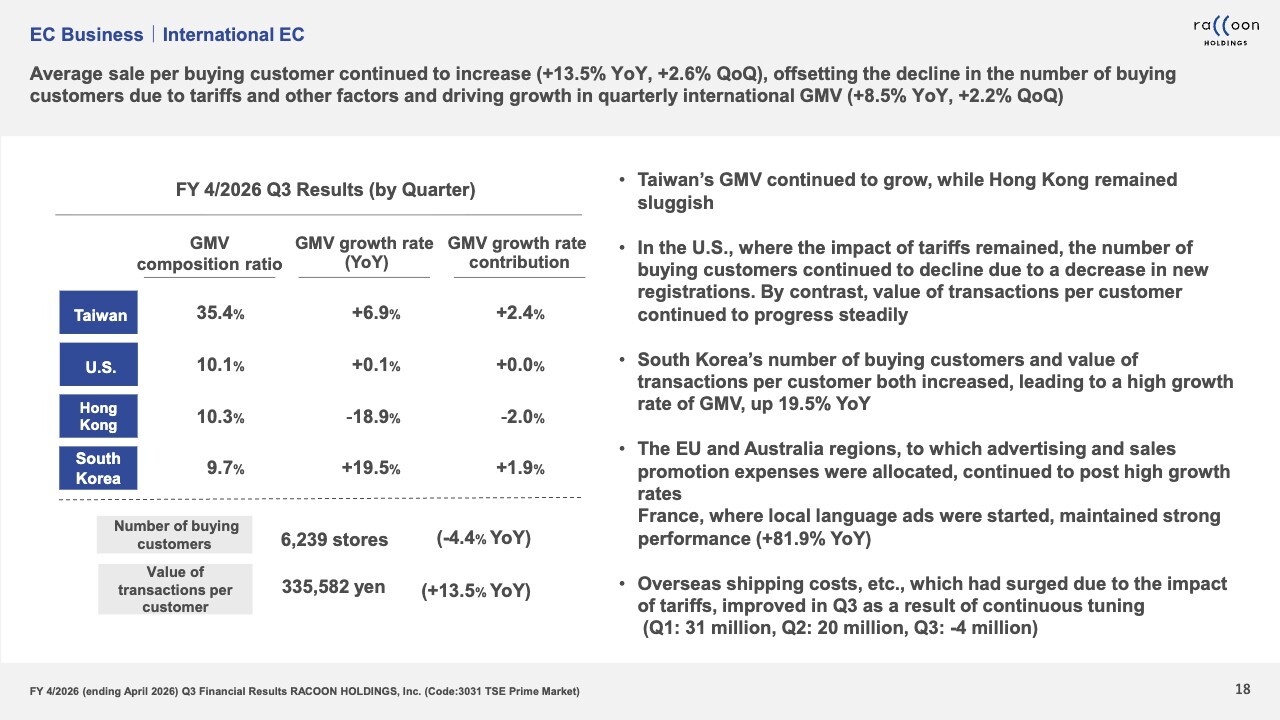
I will explain our international EC business.
As I mentioned at the beginning, the number of buying customers overseas has decreased, which has been offset by an increase in the average sale per buying customer. As shown in the bottom left of the slide, the number of buying customers decreased 4.4% YoY. This is the result of a gradual decline in customer numbers, primarily in the US.
The average sale per buying customer increased 13.5% YoY, achieving substantial growth.
By country or region, Taiwan showed a YoY growth of 6.9%. While Taiwan’s growth rate is highly volatile, it consistently maintains positive growth. Growth rates can range from low levels of 1% to 2%, to around 10%. For this quarter, it achieved relatively strong growth of 6.9%.
In the United States, due to the decline in customer numbers, partly influenced by tariffs, the result remained largely flat.
As previously discussed, we have more or less given up on Hong Kong. With no major initiatives implemented, Hong Kong has continued to show negative growth, recording a YoY decline of 18.9%.
South Korea demonstrated very robust growth, achieving a YoY increase of 19.5%.
While we do not disclose detailed information by country, we are currently focusing our efforts on the European region. One example in Europe is France. We launched French-language advertising campaigns and introduced YouTube in France. This has resulted in significant growth, with an increase of 81.9% YoY.
Europe as a whole now accounts for nearly 10% of total international GMV. In terms of growth potential, Europe as a whole has recorded a YoY growth of over 50%. It has grown to a level roughly comparable to the scale of markets like the US, Hong Kong, and South Korea.
EC Business|Trends in SUPER DELIVERY Gross Merchandise Value (GMV) (by Quarter)
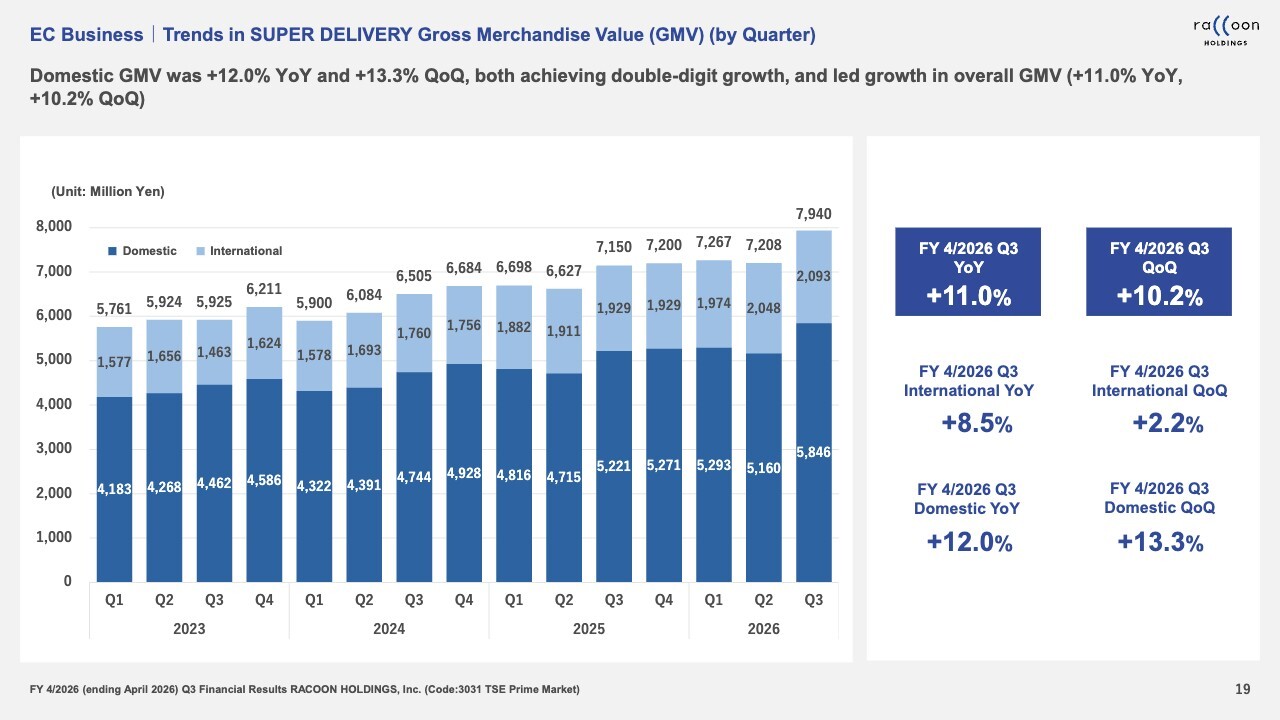
This shows the trends in SUPER DELIVERY GMV. As you can see on the slide, domestic GMV has grown significantly.
EC Business|No. of Buying Customers and Value of Transactions per Customer (by Quarter)
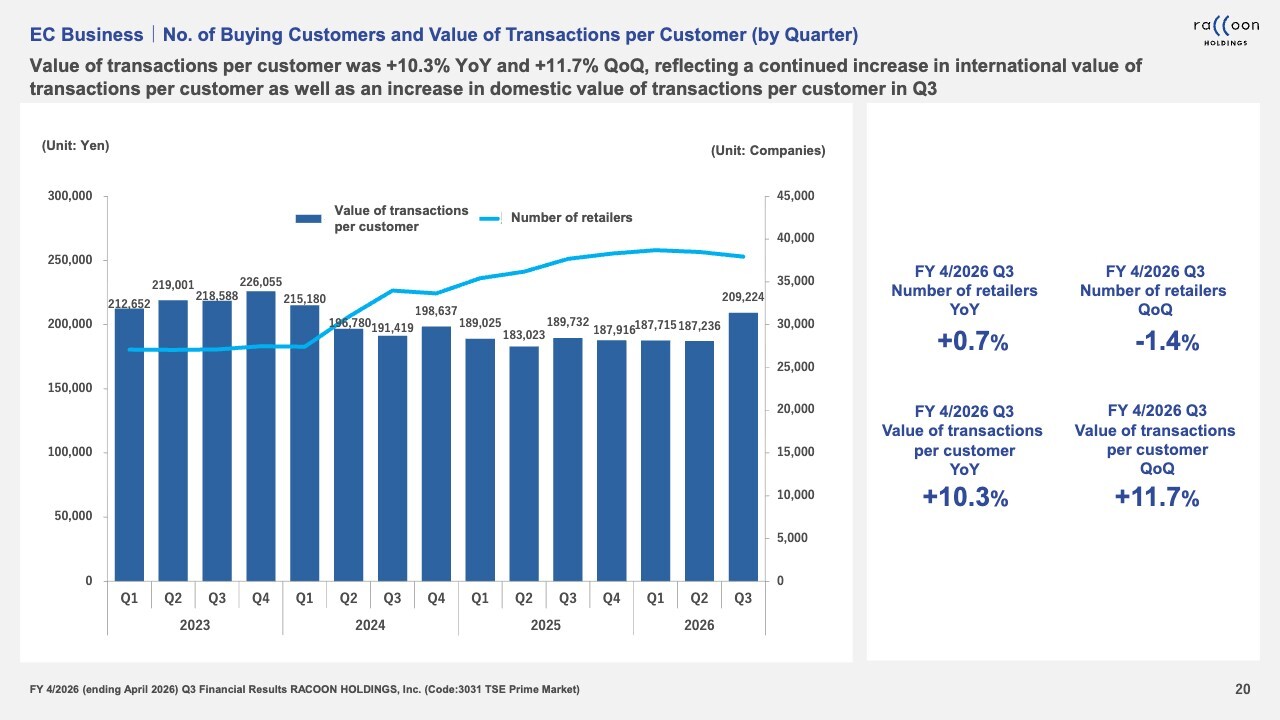
This slide and the next one are very important. The bar graph shows the value of transactions per buying customer, and you can see significant growth in Q3. The line graph shows the number of buying customers. The next slide provides a more detailed breakdown.
EC Business|Trend in No. of Buying Customers (Repeat Purchasers/First-time Purchasers) (by Quarter)
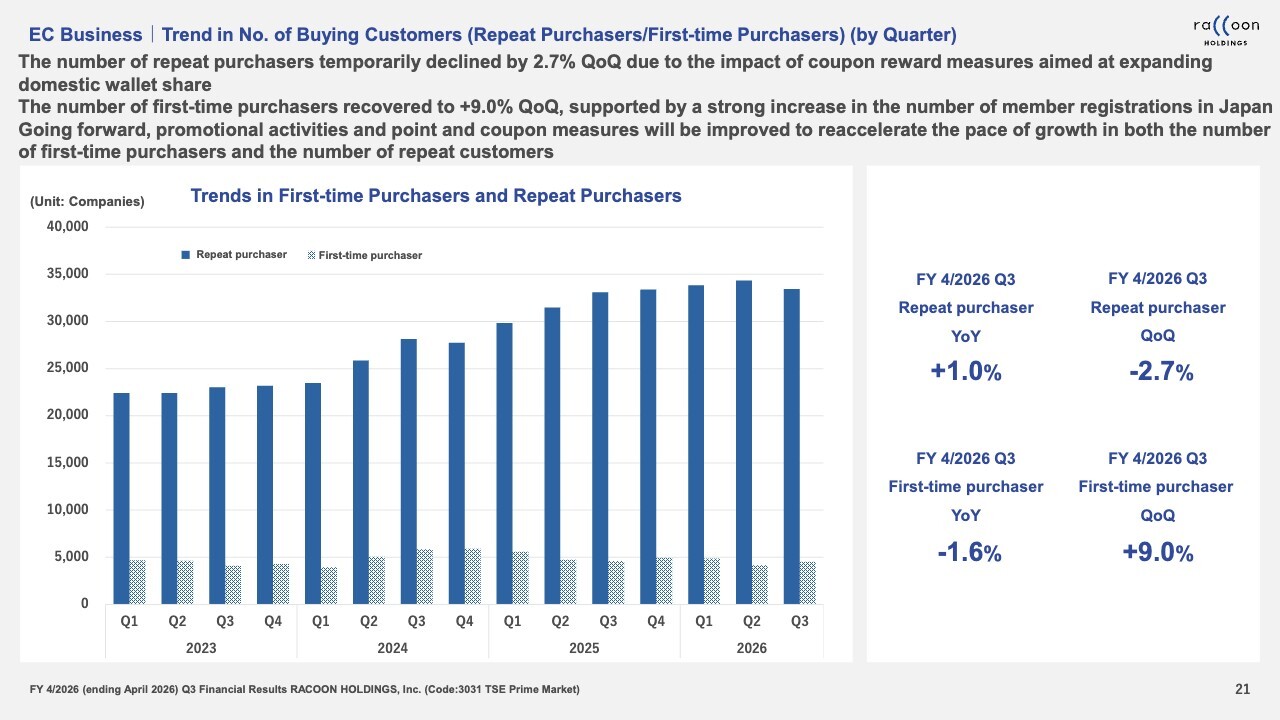
Regarding the number of buying customers, first-time purchasers have increased from Q2, as promotions worked relatively well. Although slightly down from Q1 to Q2, we can confirm the number has now recovered solidly to the Q1 level. The number of repeat purchasers has decreased slightly.
As we prioritized using points to increase the average sale per buying customer, we substantially allocated points in Q3, partly for experimental purposes. Consequently, the provision of coupons and points was limited, leading to this slight decrease in repeat customers.
We plan to strike a balance in this area going forward. Therefore, we anticipate repeat purchasers will start increasing again from Q4 onward.
EC Business|Trend in Value of Transactions per Customer (by Quarter)
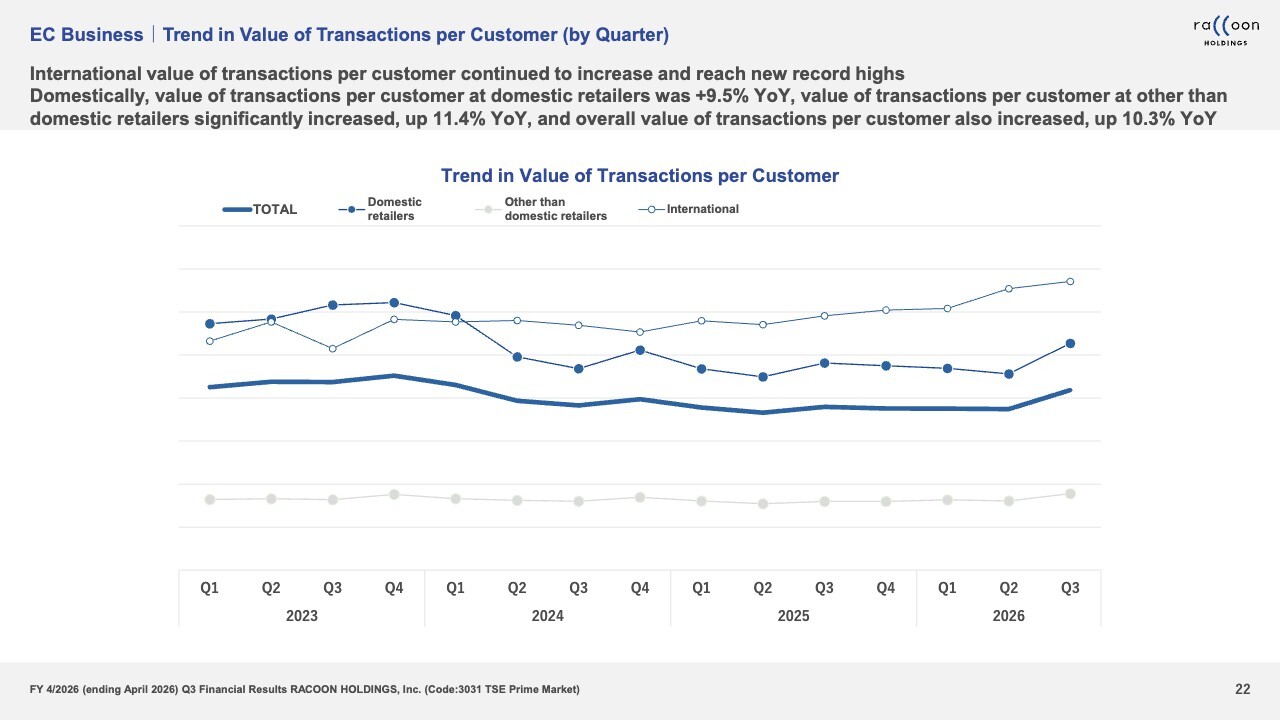
Let me discuss the value of transaction per customer. In this quarter, the value of transaction per customer increased significantly. Viewed by customer segment, the line at the top represents international customers, which also grew. Domestic retailers showed particularly strong growth, demonstrating a sharp increase.
Segments other than domestic retailers, which typically remain flat, also increases in this quarter. We can say that value of transactions per customer trended steadily across all segments.
EC Business|Trends in Sales (by Quarter)
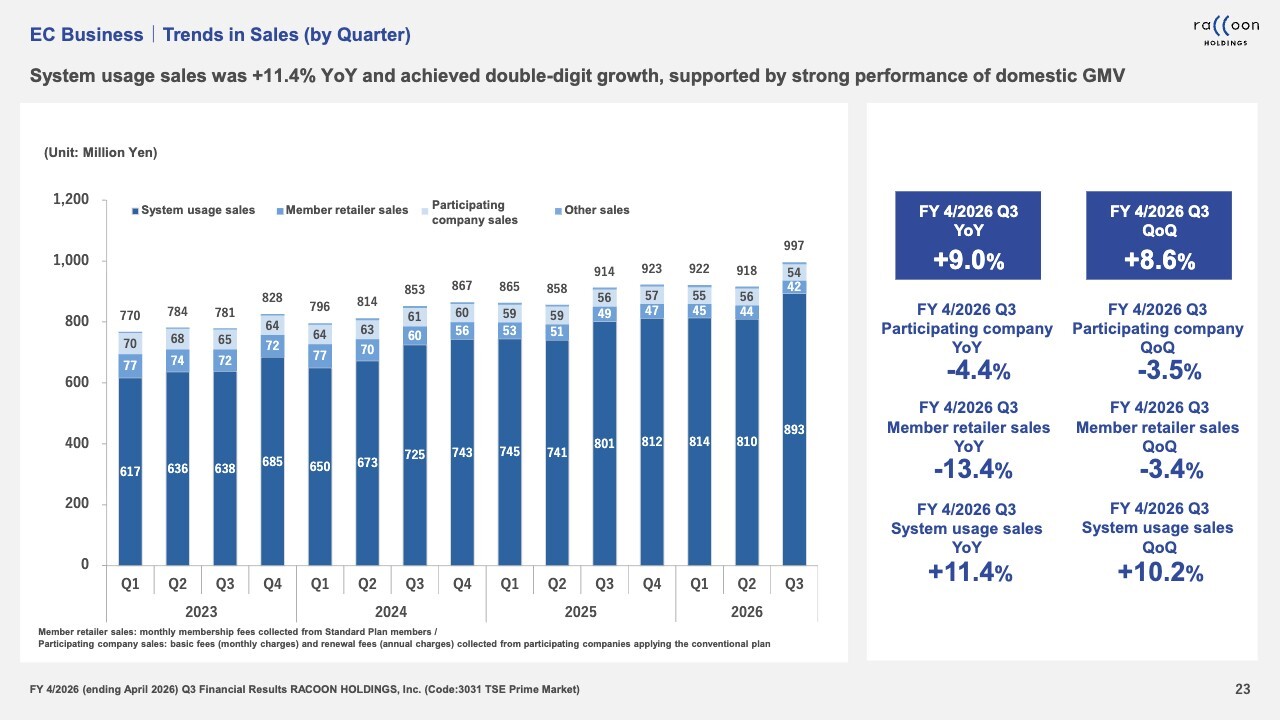
The slide shows a graph of sales, which is nearly identical to the trends of GMV.
EC Business|Trends in Segment Profit (by Quarter)
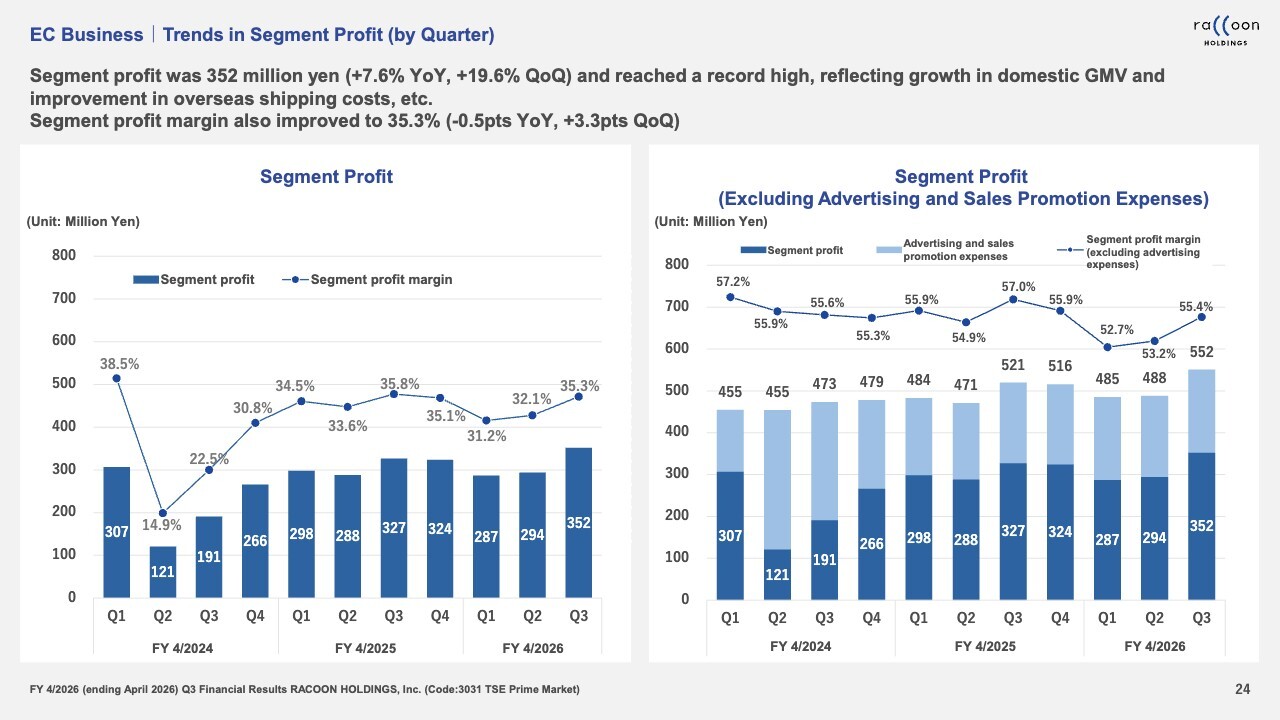
I will now explain segment profit. The graph on the left side of the slide clearly shows that Q3 recorded the highest-ever quarterly profit. Growth in domestic GMV and cost improvements in overseas shipping costs contributed to this profit.
This concludes the details regarding the EC business.
Financial Business|FY4/2026 Q3 Conclusion
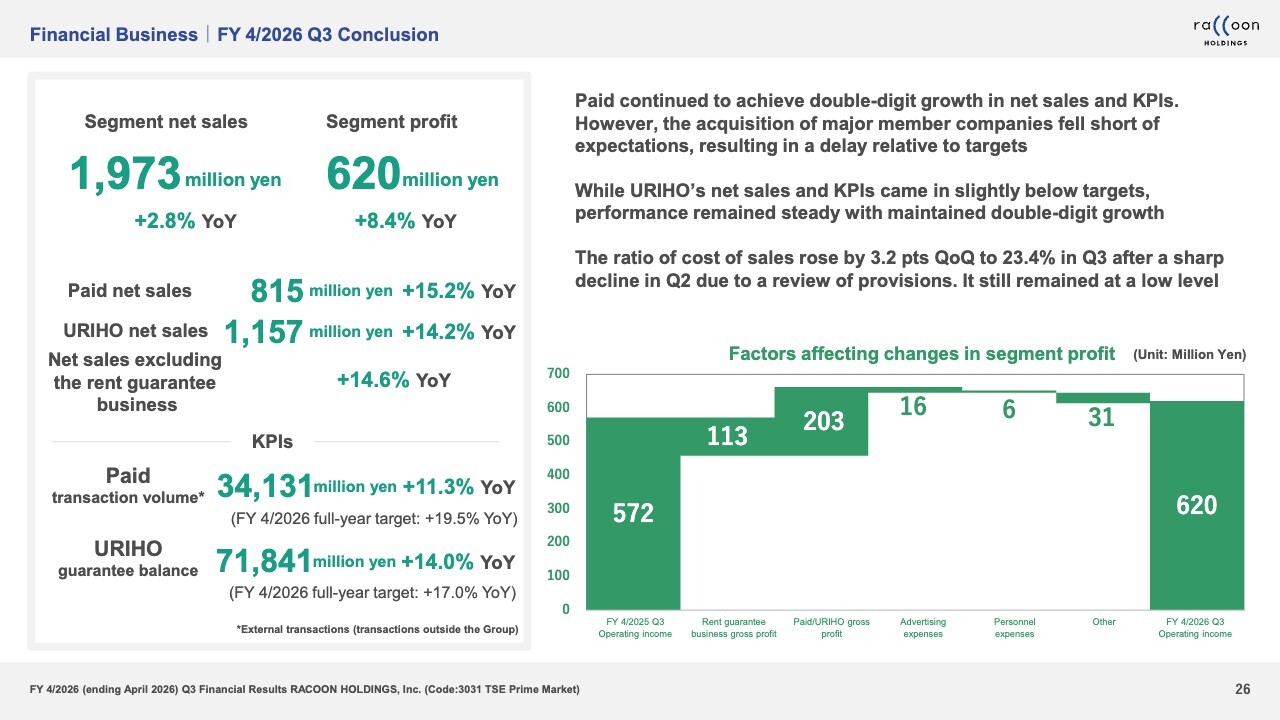
I will now explain our Financial business. The segment net sales for the Financial business were ¥1,973 million, with segment profit of ¥620 million.
In segment net sales, Paid grew 15.2% YoY, and URIHO grew 14.2% YoY. Excluding the impact of the rent guarantee business, the YoY growth rate for these two services combined was 14.6%, achieving double-digit growth.
In terms of KPIs, Paid grew 11.3% YoY and URIHO grew 14% YoY. Regrettably, this fell short of our target, but we consider it achieved a relatively favorable growth.
Financial Business|Trends in “Paid” Transaction Value (by Quarter)
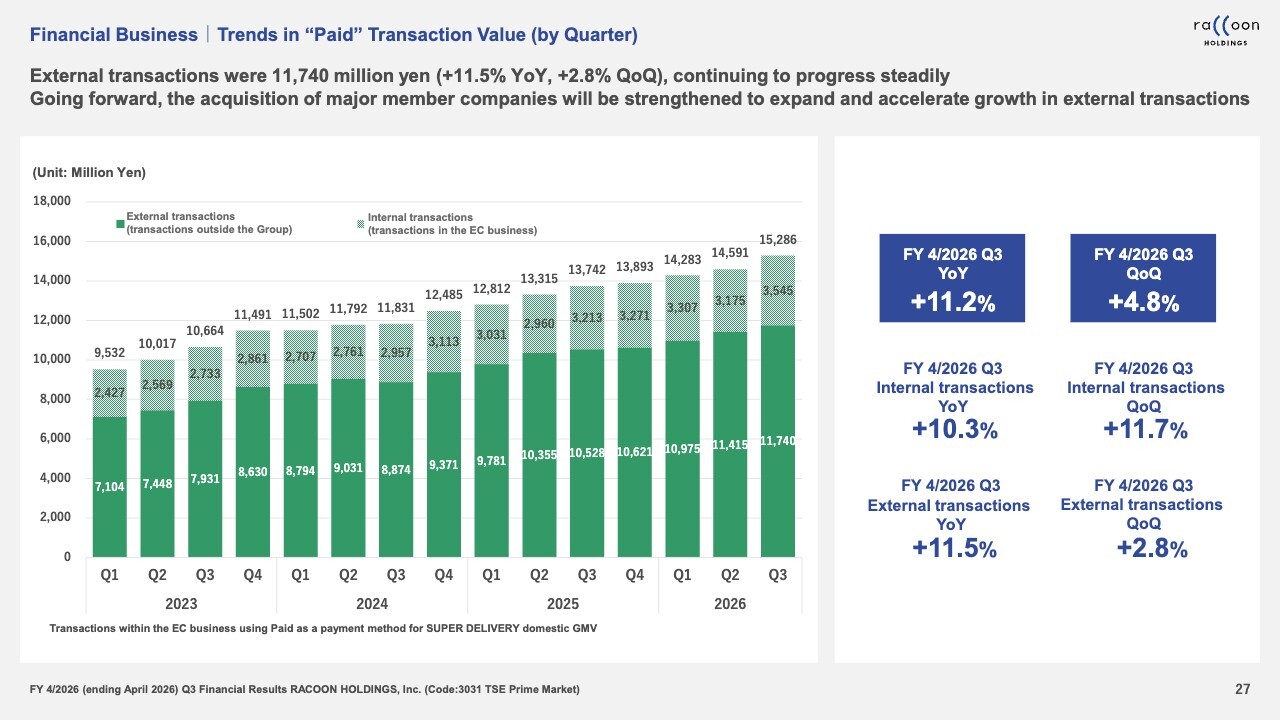
As shown in the slide, the transaction value for Paid has achieved double-digit growth relatively smoothly and continues to expand. However, we believe the acquisition of large-scale customers has been somewhat insufficient. We plan to focus our efforts on this area going forward.
Financial Business|URIHO: Guarantee Balance (by Quarter)
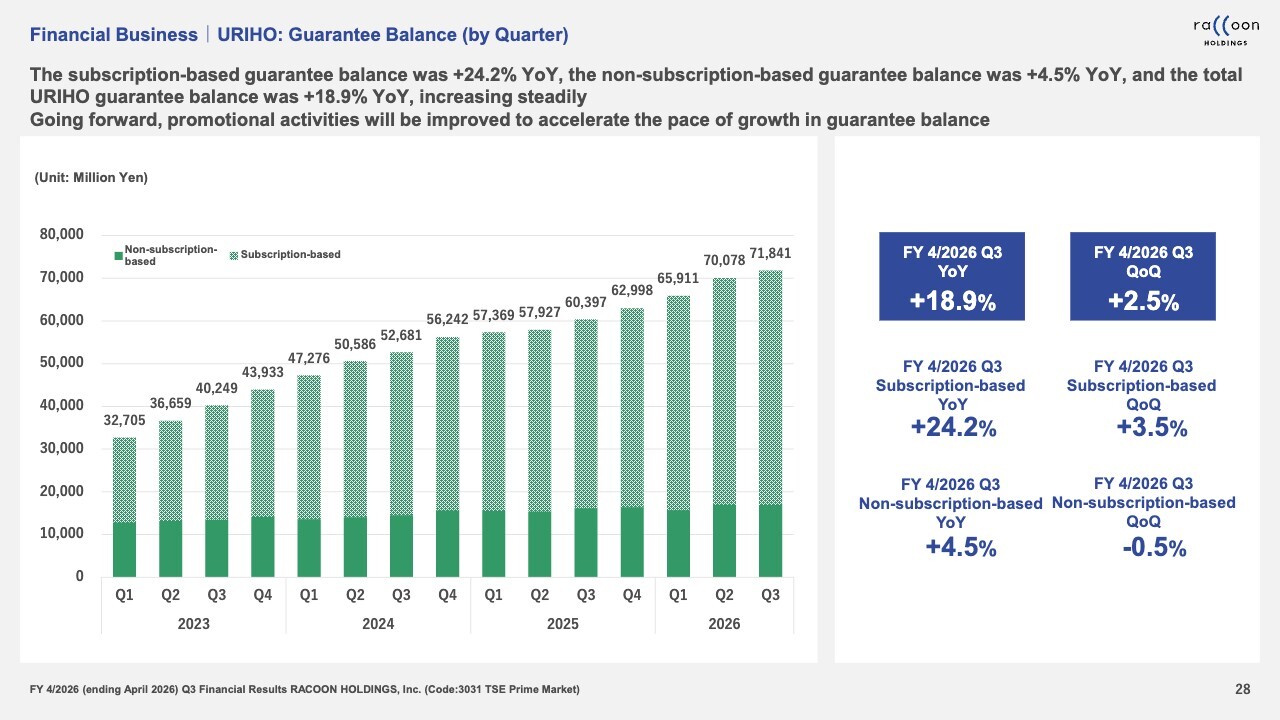
Here’s the guaranteed balance for URIHO. This has also seen significant growth, with the total URIHO guarantee balance growing 18.9% YoY. The subscription-based sector grew 24.2% YoY, while the non-subscription-based sector grew 4.5% YoY.
In particular, the Company basically prioritizes growth in the subscription-based sector. Therefore, we achieved our targets relatively steadily, even though the growth rate was slightly below expectations.
Financial Business|Trends in Sales (by Quarter)
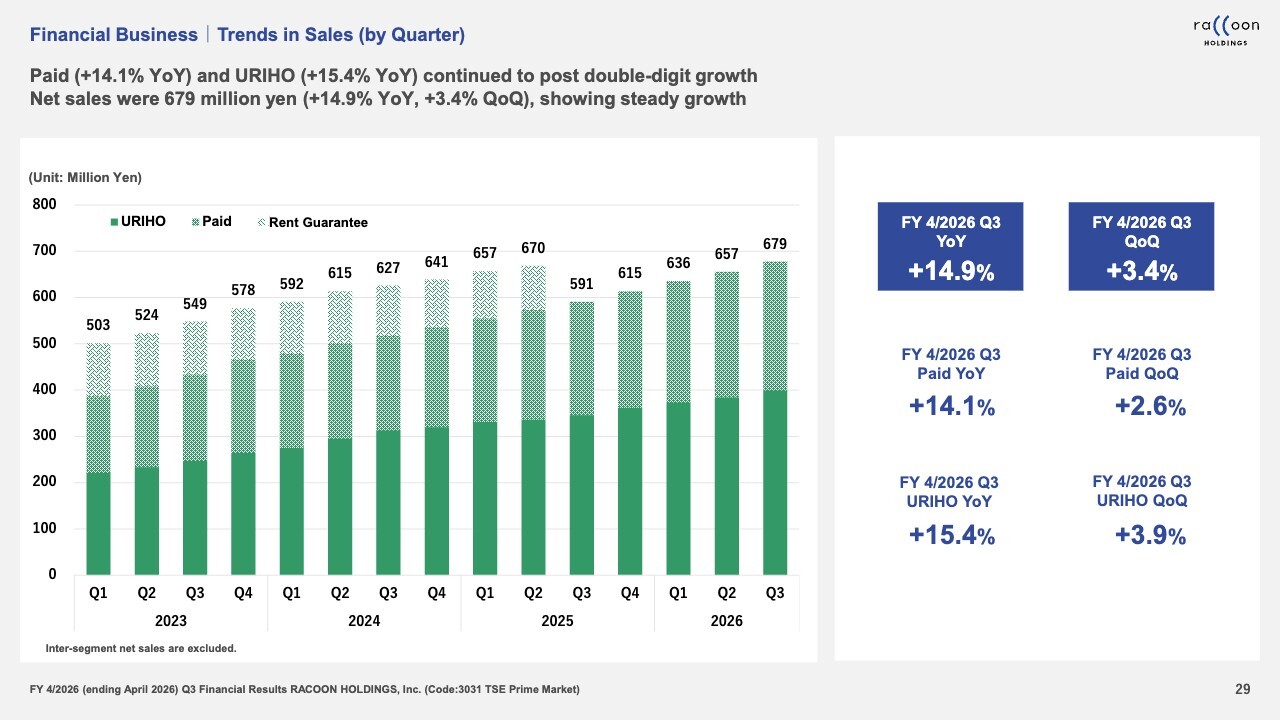
Our quarterly net sales are as shown on the slide. The light-colored sections at the top of the bar represent the sales from the rent guarantee business. Since we divested the rent guarantee business in Q3 of last fiscal year, it took until this quarter to finally surpass the net sales achieved during the period when that business was part of our operations.
Financial Business|Trends in the Rate of Cost of Sales (by Quarter)
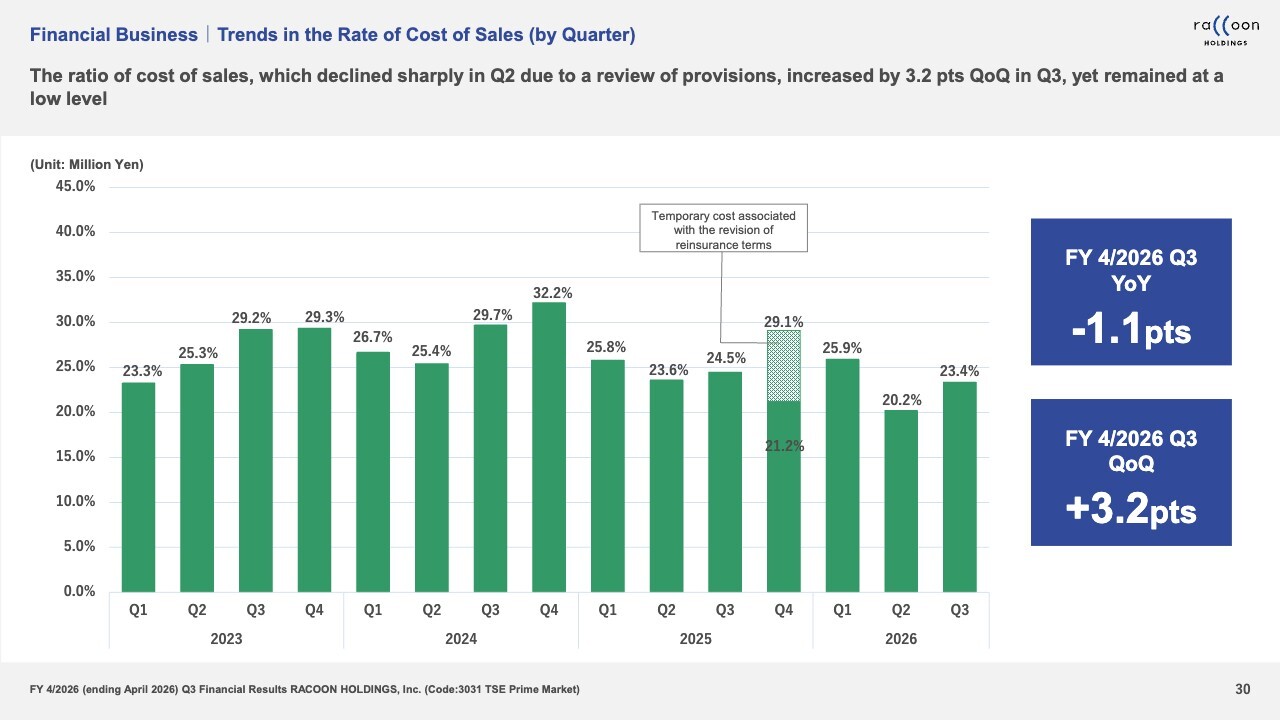
Let me discuss cost of sales. This corresponds to the portion related to defaults. Earlier, I explained that our cost of sales for the Financial business remains largely unchanged despite double-digit revenue growth. We can see the reason for this here.
The slide shows the trend in the rate of cost of sales, which reflects the movement of defaults. The rate returned to a normal level from an extremely low level in Q2, due to very few defaults and a review of provisions. Consequently, profit growth was somewhat suppressed on a QoQ basis.
The cost of sales ratio of 23.4% is relatively low compared to historical trends. From this perspective, profitability and profit margin have actually improved from previous levels. We view this stability as an indication that our screening process is being controlled relatively effectively.
Financial Business|Trends in Segment Profit (by Quarter)
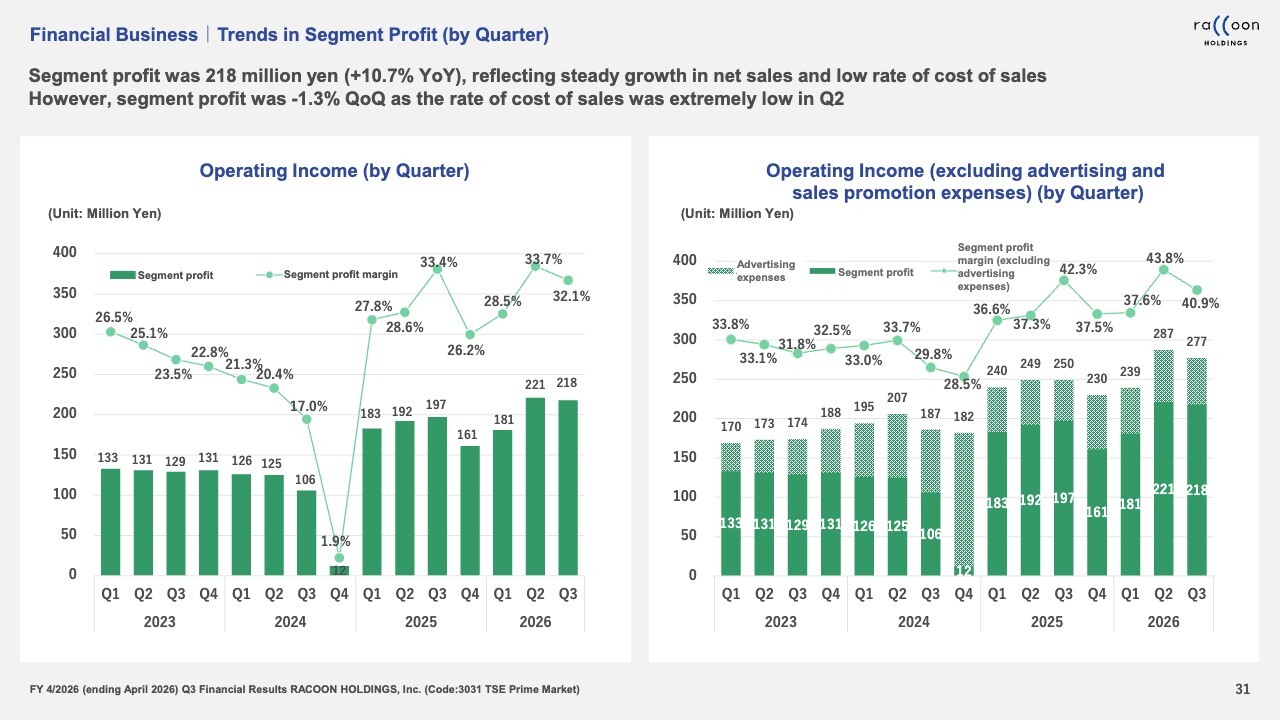
The slide shows segment profit for the Financial business. With cost of sales remaining flat, operating income has also trended almost flat. It has decreased slightly, but we can say it has been hovering at almost the same level. However, it’s worth noting that profit levels have risen to a higher stage compared to past levels, including the Q2 and Q3.
The Financial business operates on a model in which revenue is steadily accumulated. Through appropriate promotions and sales activities, we encourage customers to increase their usage, thereby building revenue over time. As long as defaults remain under control, this structure allows profits to accumulate relatively steadily.
This concludes my explanation of the financial results. Thank you.
Purpose of Business Alliance (Review)
I will explain our initiatives with Advantage Partners, Inc., an alliance we began last November. With support from Advantage Partners, we aim to vigorously grow our business. Let me explain the details of this alliance again.
I will also discuss progress to date and future priority measures. This is the first time we are sharing the progress update and priority measures.
First, let me explain the purpose of this business alliance once again. The purpose is very clear: to realize our medium-to-long-term vision, the Raccoon BtoB Network.
This vision includes further growing our two existing businesses: SUPER DELIVERY service and the Financial business. We have formed this alliance with Advantage Partners to receive the funding and management support necessary to realize this vision.
Direction Envisioned for Raccoon BtoB Network (Review)
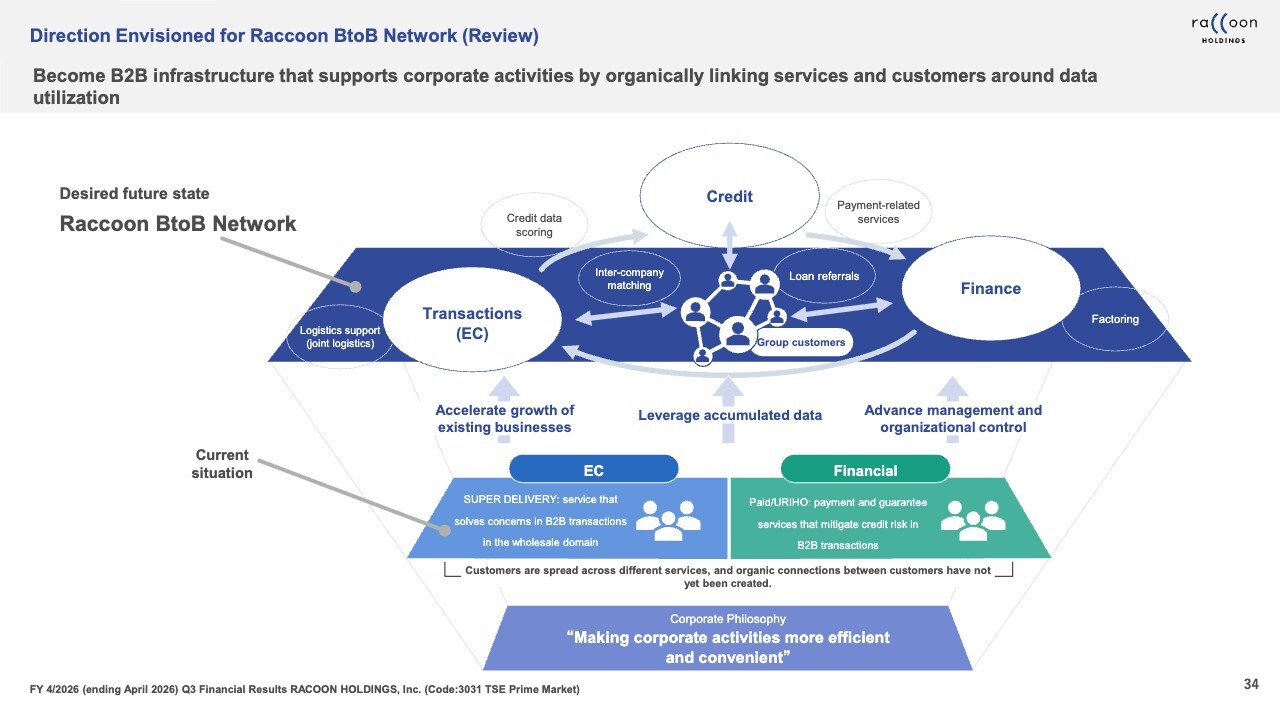
Let me explain once again what we aim to achieve with the Raccoon BtoB Network. Currently, we operate three existing businesses: the e-commerce service SUPER DELIVERY, and Paid and URIHO services under the Financial business.
The common objective across these three businesses is to make the operational environment more efficient for small and mid-sized business operators and SMEs located throughout Japan.
SMEs often face various challenges, such as insufficient manpower or limited expertise in IT and finance, though their situations vary widely. We leverage our resources to help them streamline their operations.
In other words, through our services, we provide an environment enabling SMEs and business operators to conduct their activities more efficiently.
The Raccoon BtoB Network is based on the belief that there are still many services we should provide for small and medium-sized business operators. Through our services, we aim to address the numerous challenges these businesses face.
As we build this network and expand our services, we also explore opportunities for M&A, minority investments, and forming alliances. In this way, we intend to broaden our service lineup for SMEs and also drive cross-selling.
At present, we have over 500,000 customer accounts. Our strategy is to further increase this account base through M&A and minority investments. Cross-selling across these channels will enable us to significantly expand our group GMV.
Future Priority Measures in Business Alliance with Advantage Partners
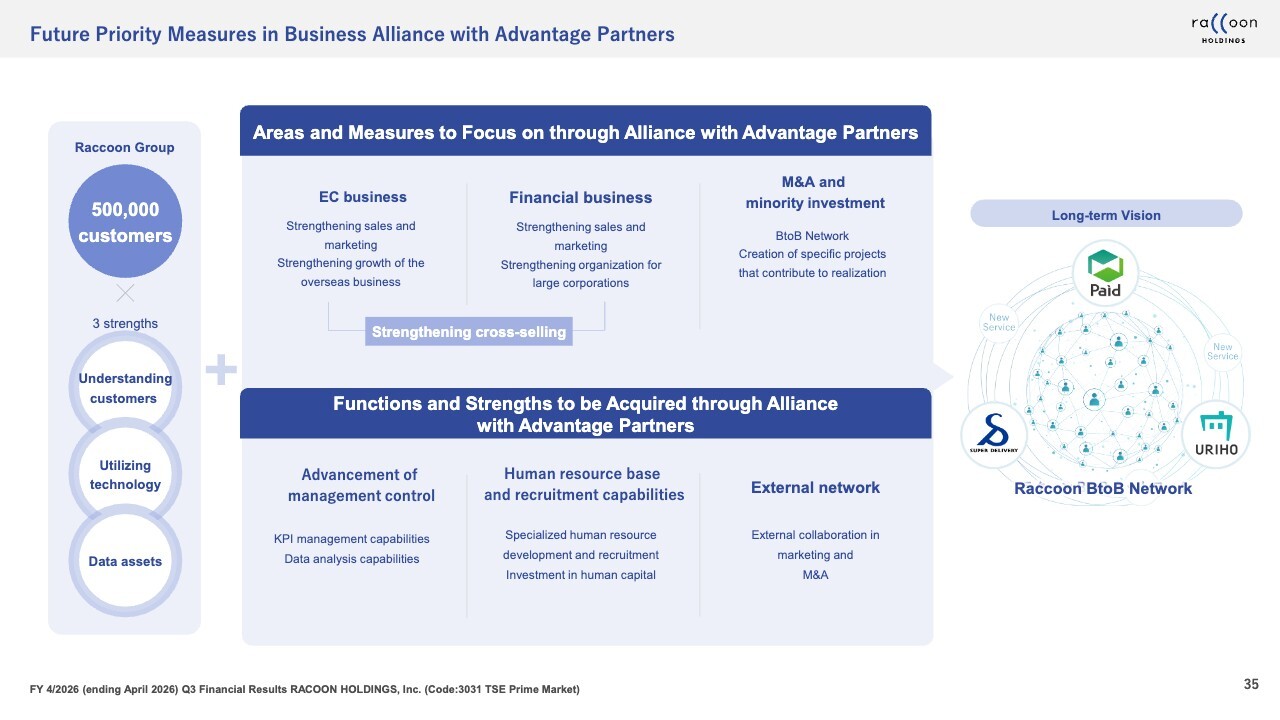
We are advancing several initiatives with Advantage Partners. First, we aim to expand the growth potential of our existing businesses. In the EC business, we are exploring multiple initiatives and conducting tests to strengthen sales and marketing and drive growth of the overseas business.
In the Financial business, we will strengthen sales and marketing while also enhancing our sales structure for large corporations. As I mentioned earlier regarding Paid, progress with large corporations has not met expectations. By reinforcing this area, we will drive meaningful cross-selling opportunities.
On a separate front, we will pursue M&A and minority investments in partnership with Advantage Partners. Looking further ahead, our long-term vision centers on the Raccoon BtoB Network.
Since forming the business alliance with Advantage Partners last November, I have worked closely with them for the past three months. To share my honest impressions from that time, I strongly feel they are truly professional.
While we had some capabilities in data analytics and KPI management, including related systems and know-how, they were not at the same level. Advantage Partners brings far deeper expertise and more advanced systems than we do. We are currently in the process of adopting these capabilities and integrating them into our management processes.
For these reasons, we believe the business alliance with Advantage Partners has been highly meaningful. They bring strong capabilities in advanced management control, human resource base and recruitment, as well as an external network. By leveraging these strengths, we are confident this alliance will serve as a catalyst to transform our company.
Strengthening Sales and Marketing
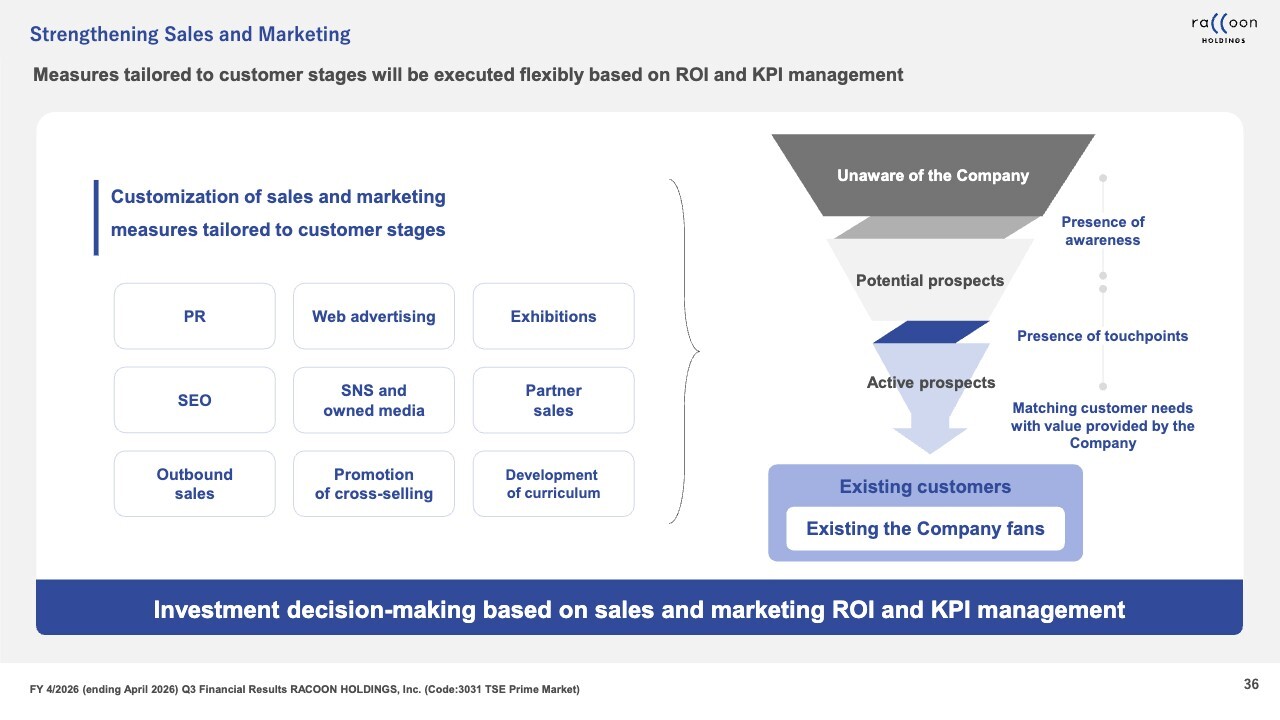
Regarding the strengthening of our sales and marketing functions, the details are shown on the slide, so I will not repeat them here.
Strengthening Existing Businesses
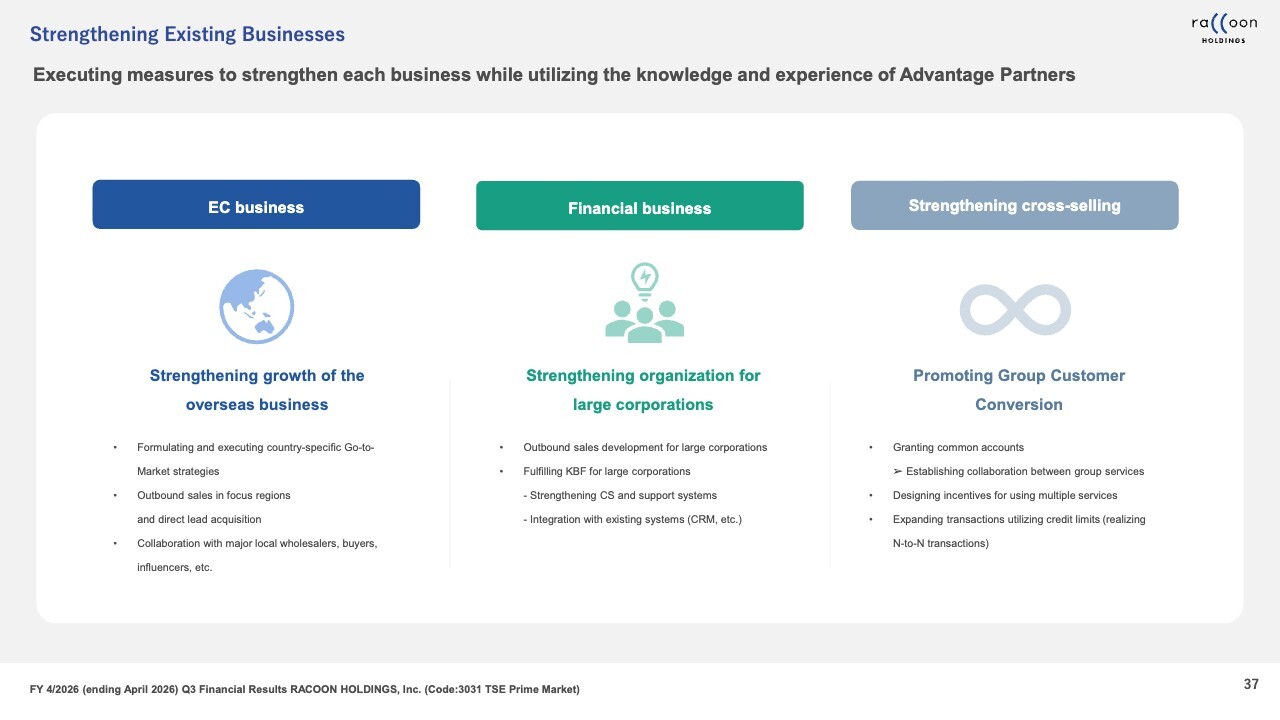
Next, on strengthening our existing businesses. As I mentioned earlier, we will continue to execute measures to strengthen each business. The slide includes the full details in text form, so please review it at your convenience.
M&A
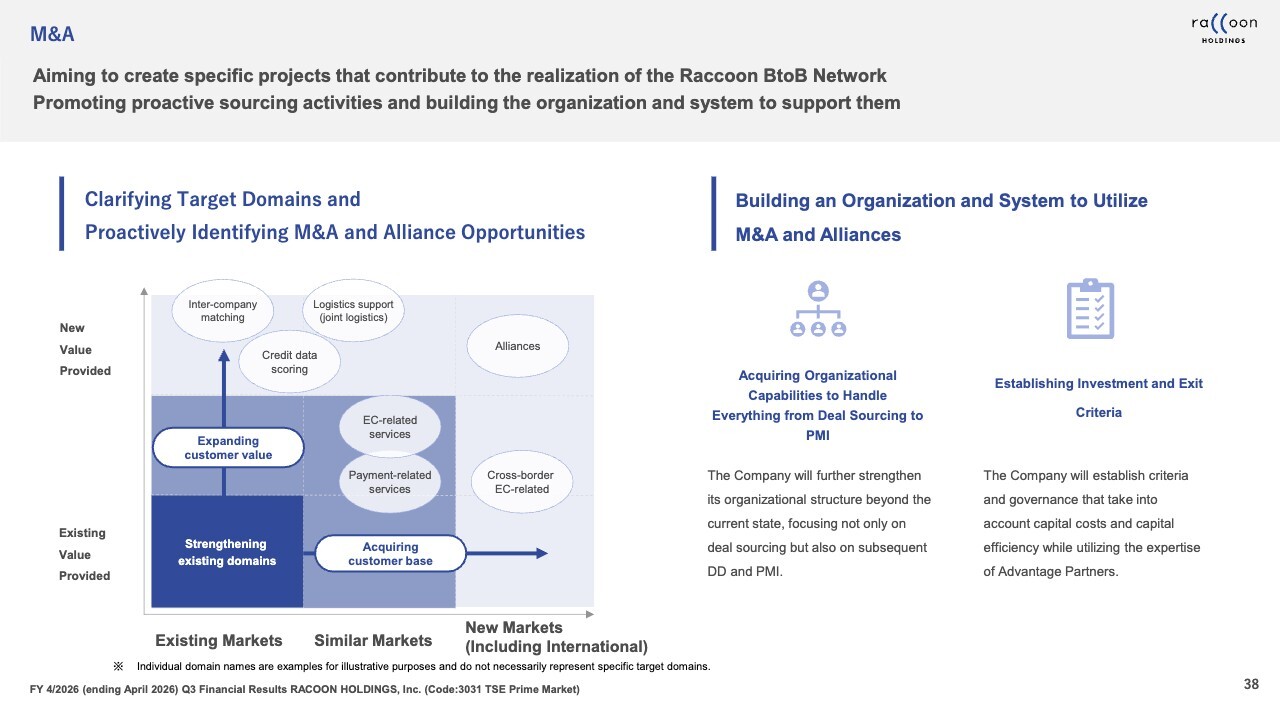
Regarding M&A, Advantage Partners will support us across the entire process—from sourcing and execution to post-merger integration (PMI). We have just begun taking initial steps on the sourcing front.
We have executed two M&A transactions in the past. The first was in 2010, when we acquired RACCOON FINANCIAL, Inc., formerly known as NIS Lease Co., Ltd., and made it a subsidiary. The second was in 2018, when we acquired RACCOON RENT, Inc. as a subsidiary. This business provided rent guarantee services, and we divested it last year.
RACCOON FINANCIAL, Inc. has delivered strong results and now stands as one of our two core pillars. We consider this acquisition a clear success.
In contrast, RACCOON RENT, Inc., which operated the rent guarantee business, was divested last year. Frankly, we view this investment as unsuccessful. The key issues were insufficient analysis at the sourcing stage and shortcomings in our PMI execution.
If we properly address and strengthen these areas, we believe we can significantly increase the probability of success in future M&A transactions.
That concludes my remarks on our partnership with Advantage Partners.
Desired Future State for 2031
Let me now turn to the desired future state for 2031. This may seem somewhat sudden, but we have issued a press release on this topic. Let me explain what we mean by the year 2031.
In our recent press release, we announced that we will formally discontinue our current Mid-term Management Plan at the end of the current fiscal year. We made this decision because the business alliance with Advantage Partners has significantly transformed our organizational structure including overall business environment.
We plan to announce our full-year results in June 2026, and at that time we will also unveil a new mid-term management plan. Accordingly, we will discontinue the current mid-term plan.
The new mid-term management plan will cover the three fiscal years from FY4/2027 through FY4/2029. FY4/2031 represents the stage two years beyond the plan period. It also marks the final year of the investment period for Advantage Partners.
The new mid-term management plan sets out our ideal vision for FY4/2031. From this plan, we will translate that vision into concrete budgets and earnings forecasts for the next fiscal year.
Numbers alone do not fully capture our ambitions, so let me explain our vision for 2031 from a qualitative perspective.
By 2031, we expect the Raccoon BtoB Network to be fully operational and to have driven significant growth for our company. In addition to SUPER DELIVERY, Paid, and URIHO, we plan to establish a comprehensive network that integrates a wide range of services for SMEs.
We currently have 500,000 registered accounts. By 2031, we aim to expand that base to several million. We envision a world in which participating SMEs seamlessly leverage services across our network and operate in a more efficient, optimized business environment.
Once this network is fully established, we expect it to significantly improve the business environment for SMEs across Japan.
The Raccoon Group operates under a three-company structure. RACCOON HOLDINGS, Inc. serves as the holding company. RACCOON COMMERCE, Inc. leads our EC business, and RACCOON FINANCIAL, Inc. operates Paid and URIHO.
By 2031, we expect to add multiple subsidiaries that participate in this network. We also anticipate having several equity-method affiliates, along with a growing number of minority investments. Based on this outlook, we have announced specific quantitative targets under the new plan.
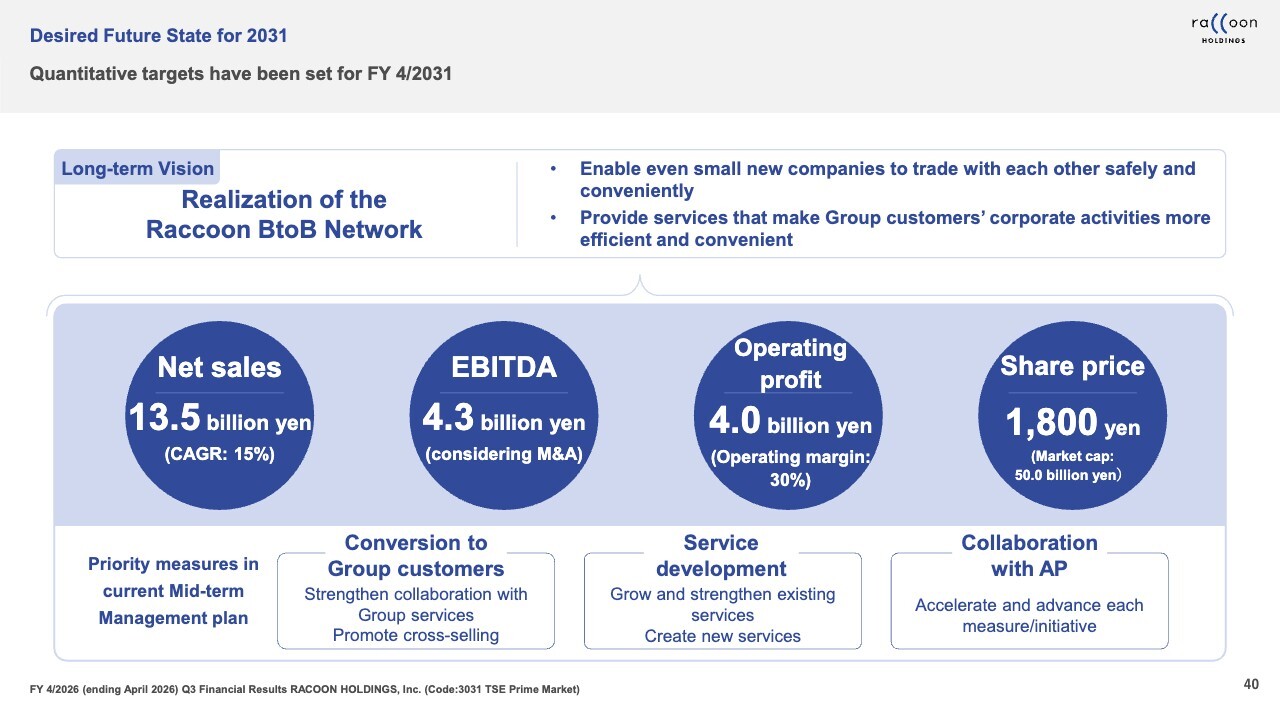
Under this plan, we target net sales of ¥13.5 billion, CAGR of 15%, EBITDA of ¥4.3 billion, and operating profit of ¥4.0 billion. Although we do not currently disclose EBITDA, we have a clear policy to pursue M&A going forward. Accordingly, starting next fiscal year, we will disclose EBITDA in addition to operating profit.
These figures incorporate a certain level of contribution from M&A. However, as the number and scale of future transactions remain uncertain, we have reflected them conservatively in our projections. If execution progresses successfully, we see potential for further upside.
We have not factored in significant cross-selling effects at this stage. If we execute well, cross-selling initiatives could provide additional upside beyond our current projections.
The slide shows our estimate of the share price in 2031. We have set a target of ¥1,800 per share and a market capitalization of ¥50 billion. Currently, our PER is approximately 15x.
Assuming Advantage Partners exercises all warrants and convertible bonds, and applying a target PER of approximately 20x based on the initial share count, this implies a share price of ¥1,800 and a market capitalization of around ¥50 billion. If we achieve this plan, we believe this represents a sufficiently attractive and attainable valuation level.
Changes to Dividend Policy (Introduction of Progressive Dividend and Profit-Linked Additional Dividend)
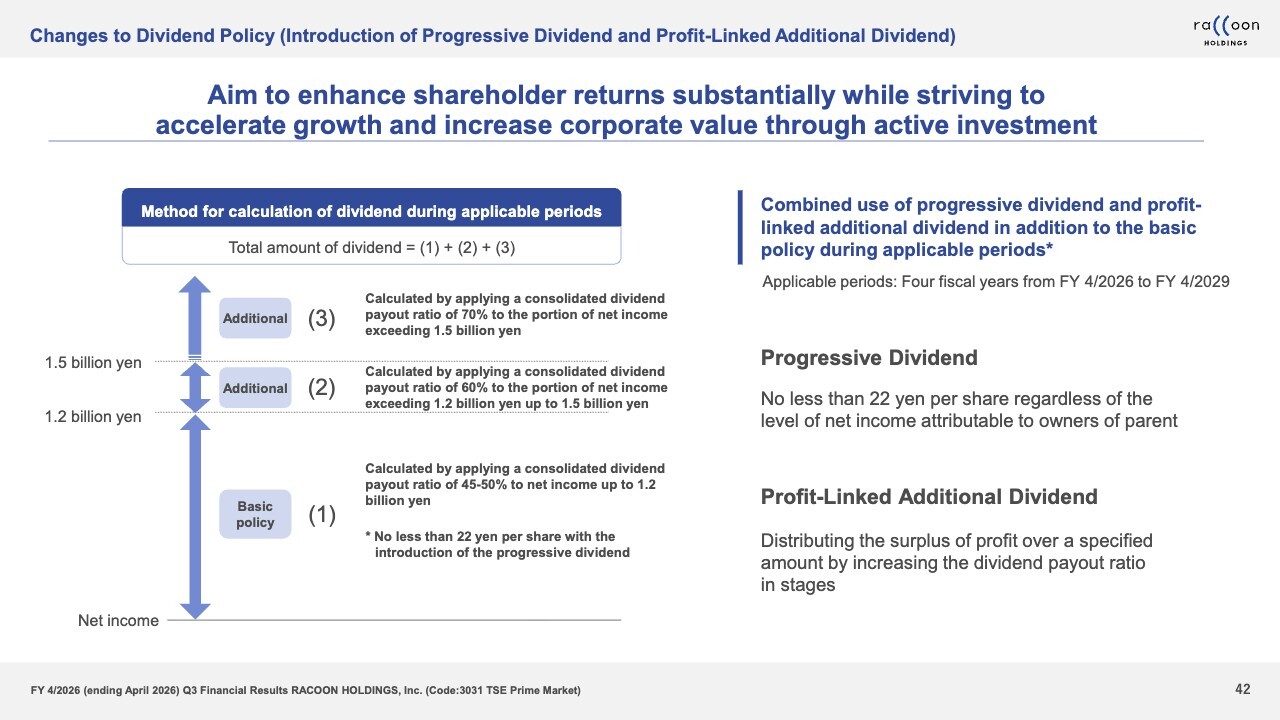
Let me turn to our dividend policy. Although the slide describes this as a change, it is not a fundamental revision. Rather, we have introduced a temporary addition to our existing dividend policy.
Our original dividend policy sets a consolidated payout ratio of 45% to 50% as the base guideline, and we will continue to follow this approach. In addition, for the period covered by the next mid-term management plan—from FY4/2026 through FY4/2029—we have introduced two additional measures.
The first measure introduces a progressive dividend policy by setting a minimum dividend level. We currently plan an annual dividend of ¥22 per share for the current fiscal year. For the four fiscal years including this one, we will maintain a minimum annual dividend of ¥22 per share. We believe this provides shareholders with greater stability and visibility.
The second measure is a profit-linked additional dividend. While this is our own term, the concept is straightforward: when profits exceed a certain threshold, we will raise the payout ratio in stages based on the excess amount.
Specifically, if net income exceeds ¥1.2 billion, we will apply a 60% payout ratio to the portion between ¥1.2 billion and ¥1.5 billion, and a 70% payout ratio to the portion above ¥1.5 billion. In this way, we will combine our base payout policy with both the progressive dividend and profit-linked additional dividend measures.
Earlier, I explained that we will partner with Advantage Partners to pursue M&A and other investments proactively, while also emphasizing our commitment to shareholder returns. Some investors may question whether these two priorities create a trade-off.
Our business generates strong cash flow, supported by a structure in which we receive cash upfront. As a result, we can fund sufficient investments while also enhancing shareholder returns. Against this backdrop, we decided to introduce the additional changes to our dividend policy.
That concludes my presentation.
Q&A: Impact of the shareholder benefit program
Question: Can we assume that the impact of the shareholder benefit program will no longer experience any discontinuous or sudden increases going forward?
Answer: Naturally, the impact depends on the number of shareholders. We provide benefits to shareholders who have held shares for more than one year, so while the effect may vary with the share price, there is some potential for a certain increase.
Since announcing the shareholder benefit program, we have recorded ¥46 million in Q1 an Q2, by which time the number of shareholders had already increased. While it is unclear what is specifically meant by “discontinuous” growth, we do not expect any sudden or extreme increases. That concludes our response at this time.
Q&A: Comparison with competitors and growth strategy
Question: The growth rate for payments on credit appears lower compared with competitors. Specifically, what initiatives do you plan to pursue to acquire large accounts?
Answer: I believe this question refers to Paid’s performance relative to its competitors. We recognize that those competitors have grown by acquiring large accounts. While we do not intend to simply copy their approach, we see this as an area where we can improve, and we plan to strengthen our efforts accordingly.
At this stage, we can share plans to strengthen our sales structure, leverage agency partners, and refine our promotional methods. Beyond these areas, there are other initiatives that are still under review or cannot be disclosed at this time.
Structurally, there is not a significant difference between our approach and that of competitors. While there are many minor distinctions, the key gap is our limited reach to large accounts. Currently, customer acquisition is largely inbound-driven, so we aim to strengthen our outreach to address this shortfall.
Q&A: Reasons for the increase in average sale per buying customer
Question: Regarding SUPER DELIVERY, do you view the rise in average sale per buying customer as driven more by price inflation or by your company’s initiatives?
Answer: We believe our initiatives have been the primary driver. As I explained earlier, the increase in average sale per buying customer is mainly due to our coupon and point programs. While inflation may have some effect, the growth is fundamentally the result of our own measures.
Q&A: Increase in average sale per buying customer and trend in buying customers
Question: This period, average sale per buying customer increased while the number of buying customers declined. Could you share your outlook on the sustainability of higher average sale per buying customer and your expectations for buying customer growth going forward?
Answer: We have recently identified an effective approach to increasing average sale per buying customer. Because our point and coupon programs can be applied continuously, we currently expect this upward trend to continue. While it will not rise indefinitely, we are confident that we can sustain a level higher than the current baseline over the long term.
The slight decline in buying customers this period was driven by a reduction in repeat purchases. This was the result of a temporary cutback in investments aimed at increasing average sale per buying customer. Since the cause is clear, we are confident that restoring these investments will allow us to sustainably grow our customer base going forward.
Q&A: Initiatives to expand buying customers and future direction
Question: I understand that the decline in repeat purchases was a key factor affecting the number of buying customers in the EC business. It is understandable that the significant increase in average sale per buying customer came with this trade-off. However, to achieve sustainable mid- to long-term growth, expanding buying customers remains essential. Looking ahead to the publication of the new mid-term management plan, do you intend to maintain a focus on growing the customer base?
Answer: To reiterate, we have not abandoned initiatives to expand the number of buying customers. In Q3, we temporarily redirected investments toward increasing average sale per buying customer. We recognize that significant white space remains.
We remain committed to significantly growing our customer base and are treating this as a key initiative within our partnership with Advantage Partners.
Q&A: Acquiring major member companies and the Paid platform
Question: We understand that Paid’s competitors have achieved strong growth by steadily acquiring large accounts. You mentioned that your company plans to strengthen efforts to acquire major member companies—are these initiatives aimed at catching up with competitors? Could you also clarify whether there are any structural differences between Paid and its competitors? If there are no major differences, does that suggest it is possible to catch up through large-account sales efforts?
Answer: We believe our previous explanation fully covers our approach to acquiring large member companies.
Putting minor differences aside, the core functions we provide to sellers and buyers are essentially the same as those of our competitors—rather than the specific structure of Paid. As a result, we believe we can acquire large accounts by improving our large-account sales and expanding our market reach.
Q&A: Outlook for earnings forecast
Question: It appears that performance is slightly behind the earnings forecast. Do you still expect to achieve the forecast, and what is your outlook going forward?
Answer: We cannot deny that we are slightly behind forecast. However, in terms of profits, we are not falling significantly short of our internal expectations. As I mentioned before, we recorded a combined ¥50 million shipping loss in Q1 and Q2, but this problem was fully resolved in Q3.
Regarding the earnings forecast, conditions differ significantly between H1 and H2. Based on the current situation, we believe achieving the forecast remains feasible.
Q&A: Impact of business alliance with Advantage Partners.
Question: Have we seen any effects from the business alliance with Advantage Partners in Q3, or are the impacts expected to emerge in the future?
Answer: Quantitatively, the effects are not yet clear. While I cannot provide detailed figures at this time, we are in the process of defining the initiatives to be implemented from next fiscal year onward, as part of the mid-term management plan and the Desired Future State for 2031.
At this stage, none of the new initiatives from our partnership with Advantage Partners have yet begun to impact the numbers.
However, we are reforming our KPI management, our approach to ROI, our M&A sourcing, and our meeting structure in an integrated way. We are also improving how quickly and accurately decisions are made within the company. Going forward, we expect further enhancements in decision-making speed and overall efficiency.
Q&A: Strengths of the Raccoon BtoB Network
Question: In developing the Raccoon BtoB Network, what are its strengths and competitive advantages compared with other companies’ BtoB infrastructure?
Answer: While it is unclear which competitors are being referenced, a key feature of the Raccoon BtoB Network is the Paid intercompany payment service, which serves as the central hub for the network.
Every BtoB transaction ultimately involves a payment. We have positioned this payment process as the central hub and built BtoB payment capabilities directly into our platform from the start. We believe this represents a significant competitive advantage for our company.
Assessing and taking credit risk for micro, small and medium-sized enterprises is extremely challenging, but we already possess the expertise and know-how to manage it effectively.
As I mentioned earlier, we have acquired over 500,000 accounts, the majority of which are customers for whom we can extend credit. We believe this capability is likely unique and not offered by our competitors.
Q&A: Assumptions underlying the 2031 target figures
Question: Today, the 2031 target figures were announced. The share price and market capitalization targets are being presented for the first time—could you explain the assumptions behind these calculations?
Answer: As I explained earlier, simply put, these figures are calculated based on a PBR of 20×.
Q&A: Differences Between Taiyo Pacific Partners L.P. and Advantage Partners.
Question: In the past, Taiyo Pacific Partners L.P. was a shareholder in your company. Could you share your candid view on how the current situation differs from that period?
Answer: In our interactions, the two firms are completely different. The most significant difference is that Taiyo Pacific Partners L.P. was an external party and not an insider.
Naturally, they did not have access to our internal information or company data. Taiyo Pacific Partners L.P. is an institutional investor in listed stocks and is considered a relatively engaged investor.
In contrast, Advantage Partners is treated as an insider and is provided with nearly all of our data. They work with us to develop and execute strategy based on that information.
For this reason, we view their stance as completely different from that of Taiyo Pacific Partners L.P.
Q&A: The importance of EBITDA and operating profit
Question: Considering your growth targets are set for 2031, should we view EBITDA as more important than operating profit over the intervening years? Or, given the dividend policy, should operating profit also be considered a key metric?
Answer: This is a complex issue, and I’m not certain I can provide a fully precise answer. That said, I do not currently view EBITDA as more important than operating profit. However, when conducting M&A, goodwill amortization naturally comes into play. As a result, relying solely on operating profit may make it harder to see the company’s potential for future growth and profit expansion.
We plan to disclose EBITDA so that both operating profit and EBITDA are visible. In our company, goodwill is typically amortized over 10 years, after which the amortization burden disappears. Therefore, when evaluating the company’s future, it is important to consider the gap between EBITDA and operating profit.
In this context, we plan to disclose both metrics and do not currently consider either one as inherently more important than the other.
Q&A: Dividend calculation method and its impact on strategic investments
Question: From a simple perspective, under the current dividend policy, higher profits could lead to more cash outflow to shareholders. As a result, the payout ratio appears high enough that it may be better to prioritize strategic investments instead. Could you share your view on this?
Answer: It may be easier to understand with a calculation. Regarding the dividend calculation method, only the amounts exceeding ¥1.2 billion and ¥1.5 billion, respectively, are considered.
For example, if profit increases by ¥300 million within the range above ¥1.2 billion up to ¥1.5 billion, the additional dividend amounts to 10% of that, or ¥30 million. From this perspective, compared with our total available funds and planned strategic investments, ¥30 million is not a significant amount.
For profits exceeding ¥1.5 billion, the consolidated payout ratio is set at 70%, but the additional portion is 20%. We believe this amount is not large enough to materially affect our strategic investments.
We announced this new dividend payout ratio after carefully calculating how much we can distribute while preserving ample flexibility to pursue strategic investments. We hope this provides reassurance.
Q&A: Initiatives to drive top-line growth and improve cost efficiency
Question: Should we view your company’s significant profit growth as primarily driven by top-line expansion from your BtoB platform and successful M&A? Or can cost-efficiency improvements also play a leading role?
Answer: This is somewhat complex, but the general view is that profit growth will be largely driven by the top line. We aim to actively increase GMV, including through cross-selling, so growth will primarily be fueled by top-line expansion rather than cost-efficiency improvements.
However, as an IT company, we aim to minimize cost pressures wherever possible, for example by leveraging AI. If AI can help control costs, we plan to pursue it actively.
While it may contribute slightly less than top-line growth, we believe there is significant potential to generate profit through cost-efficiency improvements.
This concludes my presentation. Thank you very much for attending today.