Consolidated Result Summary
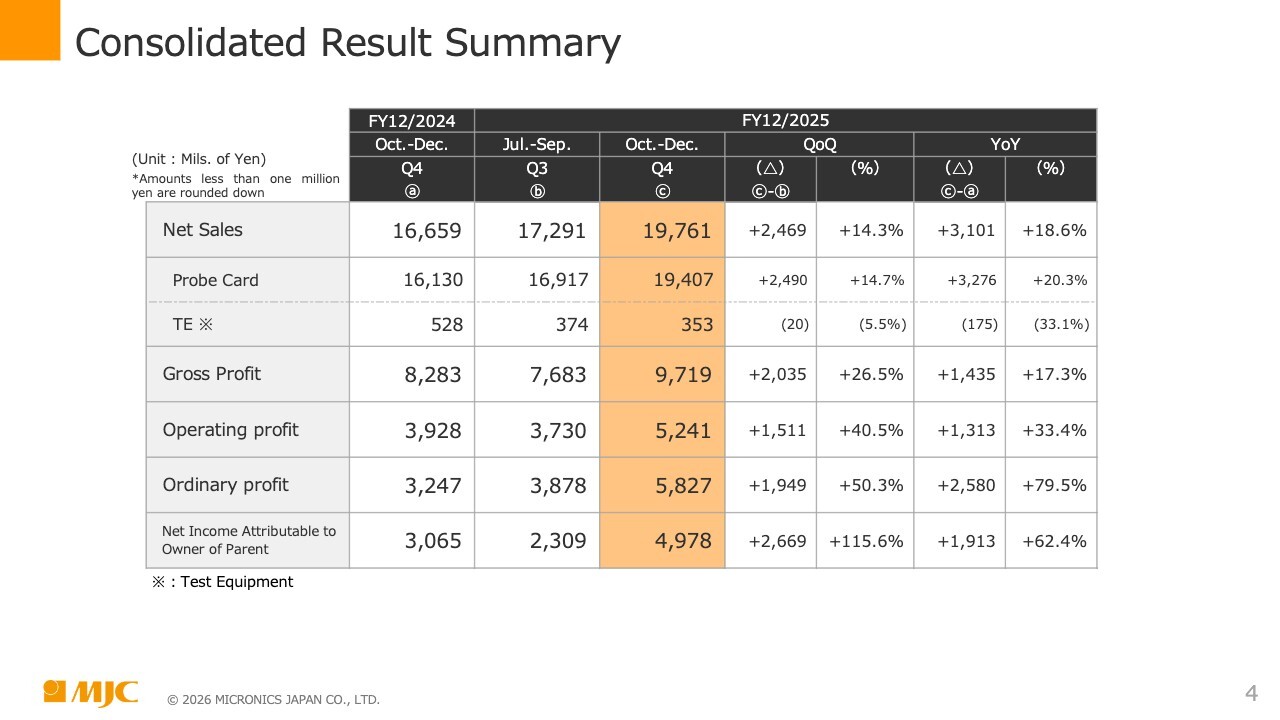
Yuki Katayama (hereafter, “Katayama”): My name is Yuki Katayama, Director, Senior Executive Officer, and Deputy General Manager of the Administration Division, Micronics Japan Co., Ltd. I will provide an overview of the financial results for Q4 FY2025. This slide shows quarterly results, with the orange column representing three-month results for Q4 (October to December).
Net sales totaled JPY19,761 million and operating profit was JPY5,241 million. Compared to the immediately preceding Q3 (July to September), net sales increased 14.3% and operating profit increased 40.5%. Compared to the same period the previous year (October to December 2024), net sales and operating profit increased 18.6% and 33.4%, respectively.
Consolidated Result Summary
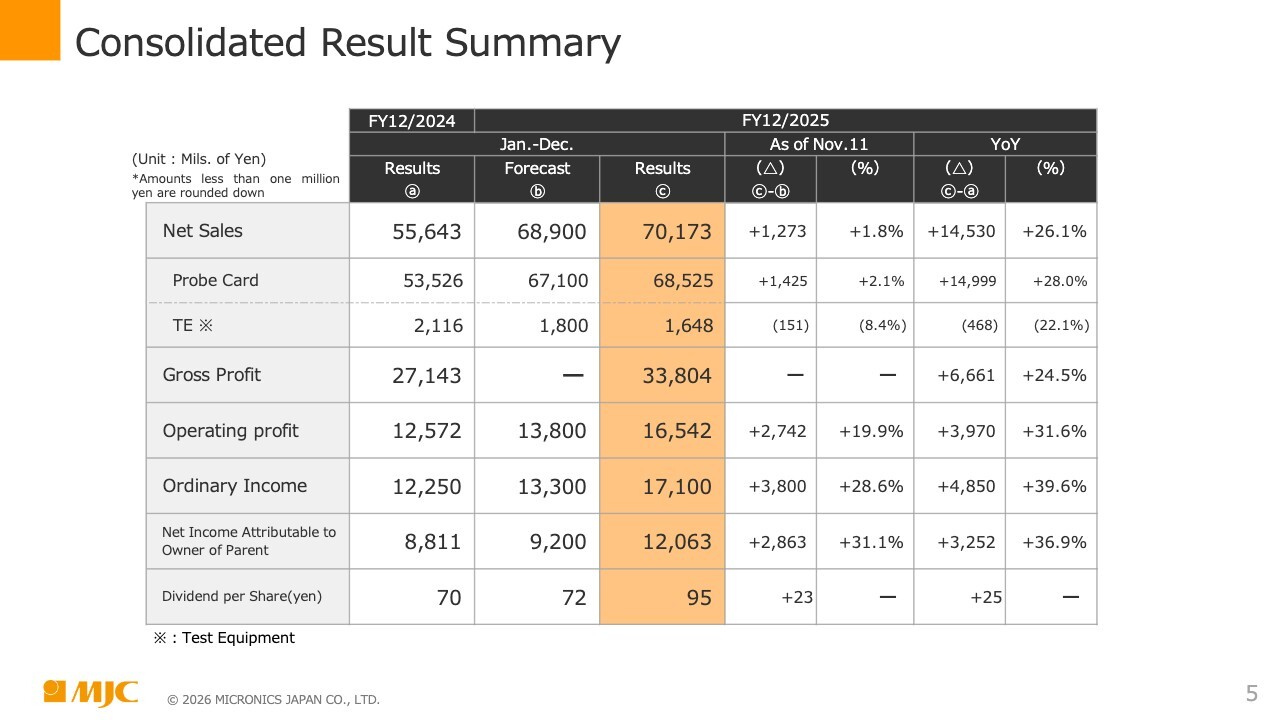
Now I will provide an overview of the full-year financial results. The orange column on this slide shows cumulative results for the period from January to December of FY2025. Net sales totaled JPY70,173 million and operating profit was JPY16,542 million. As for profit items, ordinary profit was JPY17,100 million and net income attributable to owner of parent was JPY12,063 million.
YoY comparisons are shown on the right side of the table. Net sales increased by 26.1% YoY, while operating profit and profit items increased more than 1.3-fold, with operating profit, ordinary profit, and net income attributable to owner of parent all recording increases of more than 30%.
SG&A expenses increased approximately JPY2.7 billion YoY. R&D expenses increased approximately JPY1.5 billion, accounting for 55% of total SG&A expenses. Other items consist mainly of increased personnel expenses, including performance-based compensation for employees.
Compared to the full-year financial forecast disclosed on November 11, net sales increased by JPY1,273 million, operating profit increased by JPY2,742 million, and net income attributable to owner of parent, which is the final profit item, increased by JPY2,863 million.
Please also refer to the timely disclosure of the difference between the consolidated financial forecast and actual figures for the full fiscal year at the same time as the disclosure of financial statements on February 13.
Under our basic policy of paying continuous and stable dividends to shareholders, the Board of Directors has approved a dividend forecast of JPY95 per share, an increase of JPY23 from the previous forecast of JPY72 per share, and this is on the agenda for the General Meeting of Shareholders to be held in March. With regard to foreign exchange, the actual exchange rate for the full year from January to December was approximately JPY149.
In the results for 1H FY2026 (January to June), which will be explained later, the assumed exchange rate is JPY150. We estimate that the impact of a one-yen change in the exchange rate against the US dollar in the 1H results will be less than JPY30 million.
Summary on Results
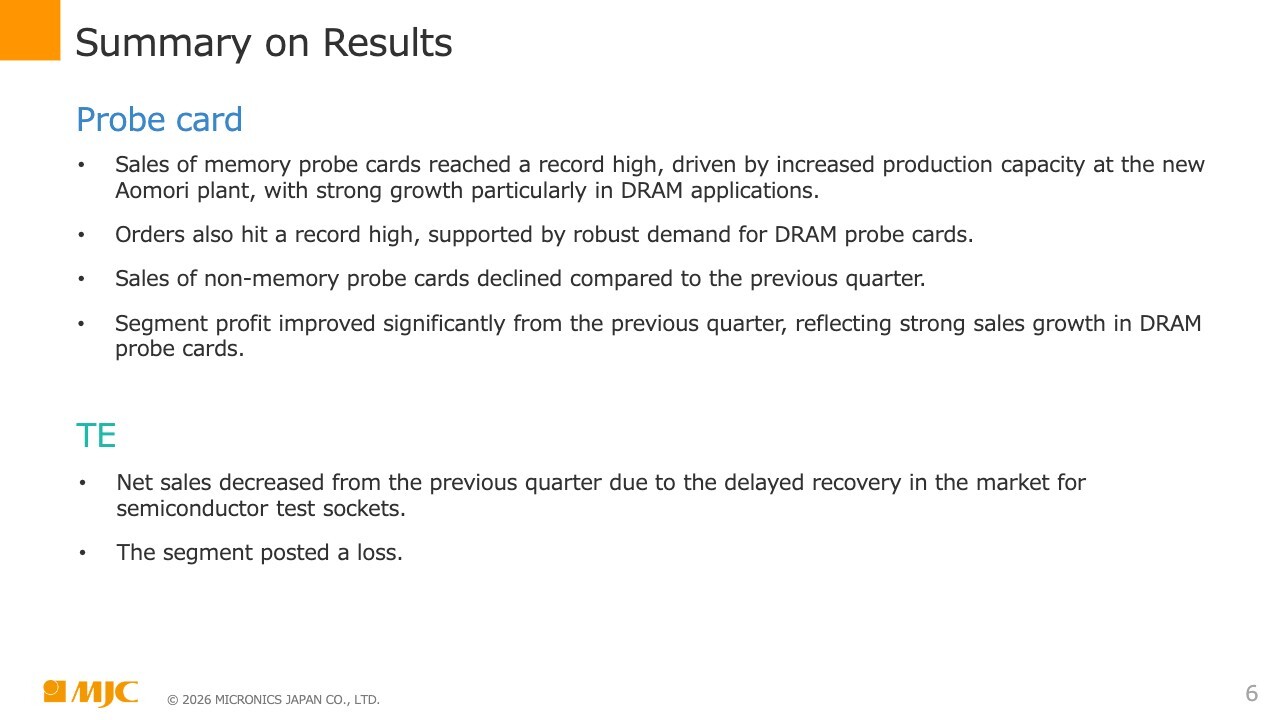
Here are the highlights for Q4 FY2025. In the probe card business, increased production capacity at the new Aomori plant building contributed to record-high net sales of memory probe cards, particularly in DRAM applications.
Orders received also reached a record high on the back of robust demand for DRAM. Net sales of non-memory probe cards declined QoQ, while segment profit improved significantly QoQ due to strong sales growth in DRAM-oriented probe cards.
As for the TE business, net sales decreased QoQ and segment profit posted a loss due to the delayed recovery of the semiconductor test socket market.
Quarterly Financial Result
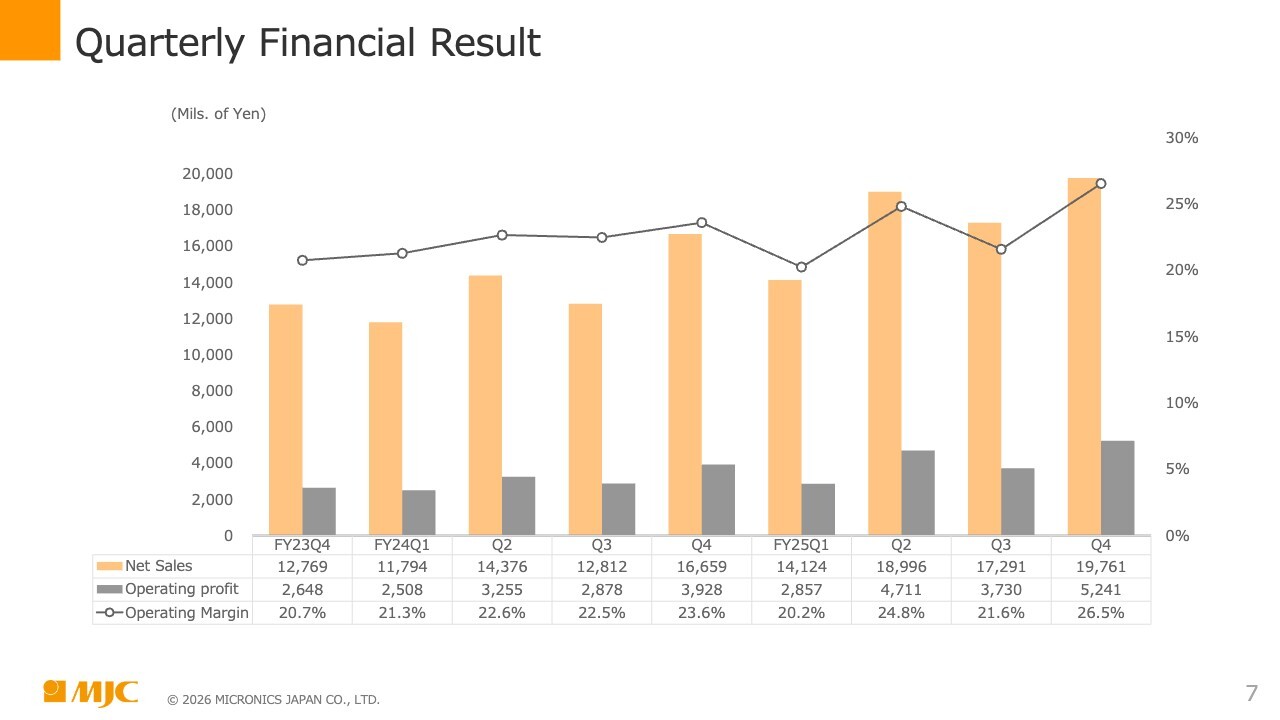
This slide is about quarterly financial results. The graph on the slide shows net sales, operating profit, and operating margin on a company-wide basis. On this basis, we have achieved an operating margin of 20% or more in every quarter, thereby continuing to secure stable earnings.
Business Condition by Segment
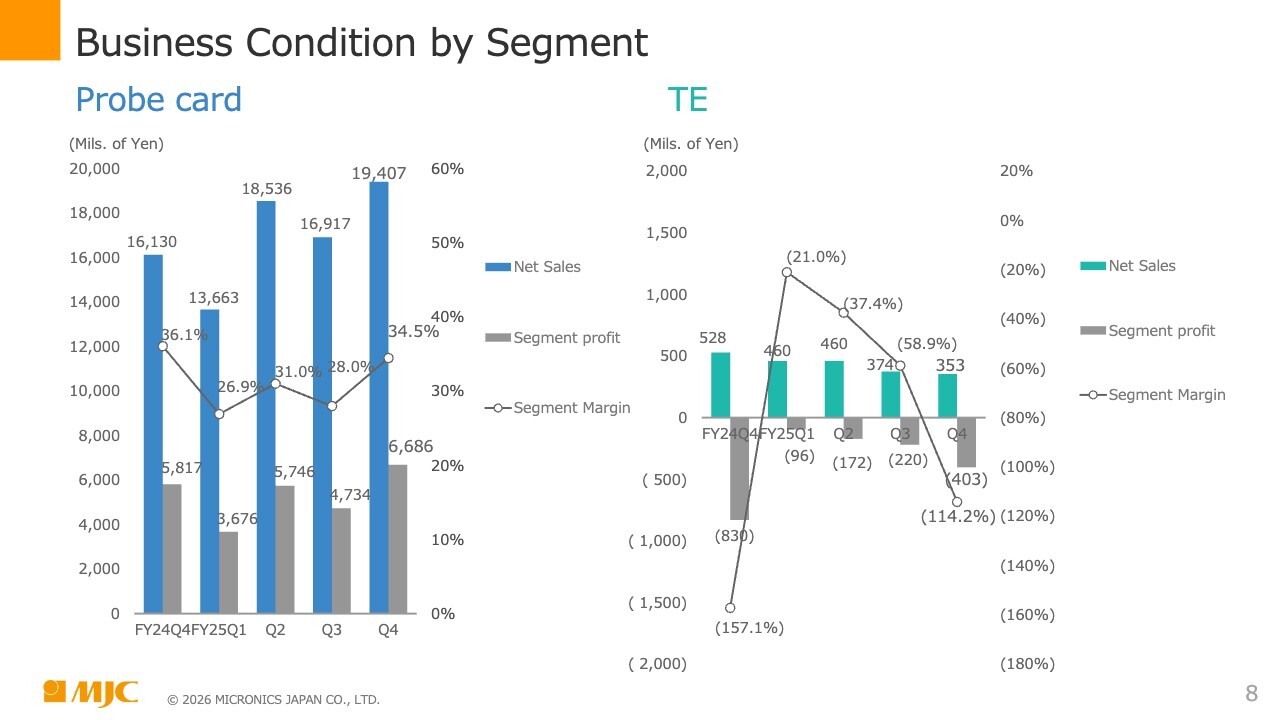
This slide is about quarterly financial results by segment. The graph on the left of the slide shows the probe card business. The segment margin for Q4 was approximately 34.5%, recording a high rate of return. The TE business on the right had a segment loss of JPY403 million.
Quarterly Orders, Net Sales & Backlog
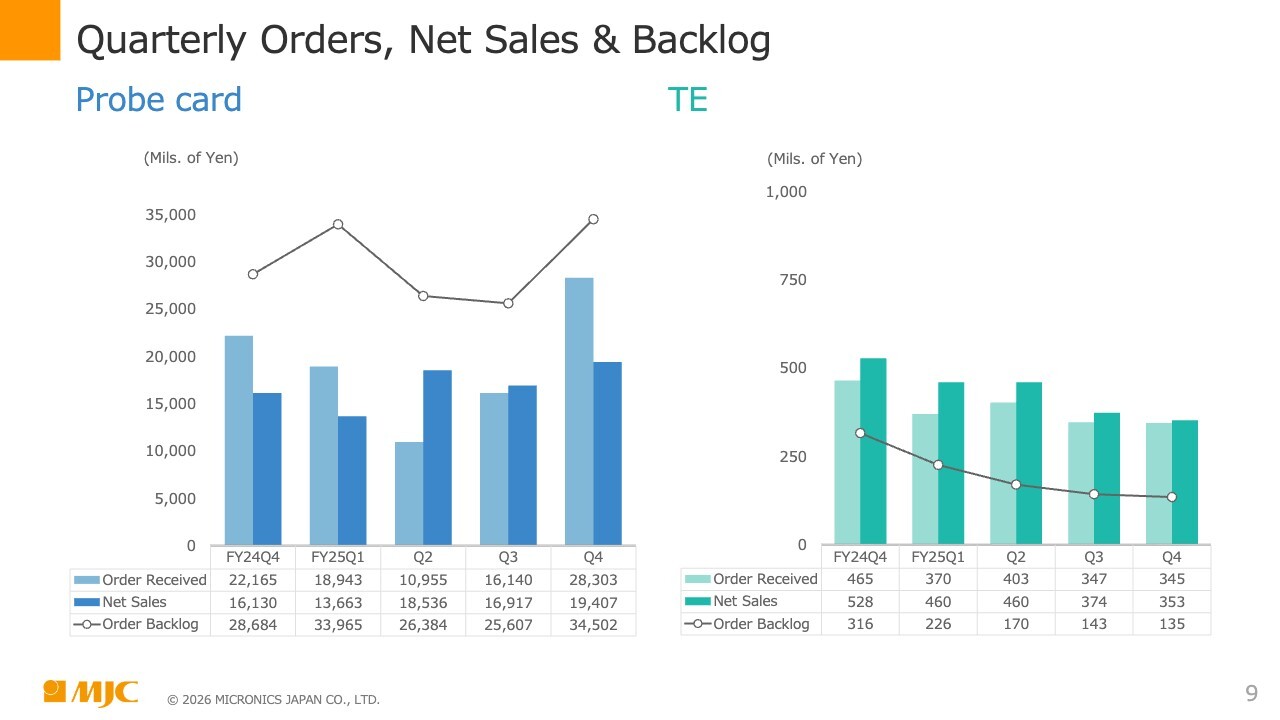
Now I will explain quarterly orders, net sales, and order backlog. Orders received for the probe card business on the left of the slide totaled JPY28,303 million in Q4, a record high on a quarterly basis. Order backlog was high at JPY34.5 billion and is reflected in the results forecast for 1H FY2026, which will be explained later.
In Q2, we were affected by changes in ordering policies at major customers, but in Q4 FY2025, there was once again a large movement to place orders ahead of schedule in order to secure production capacity, which led to a buildup of orders. Please see the right side of the slide for figures for the TE business.
Quarterly Net Sales by Product
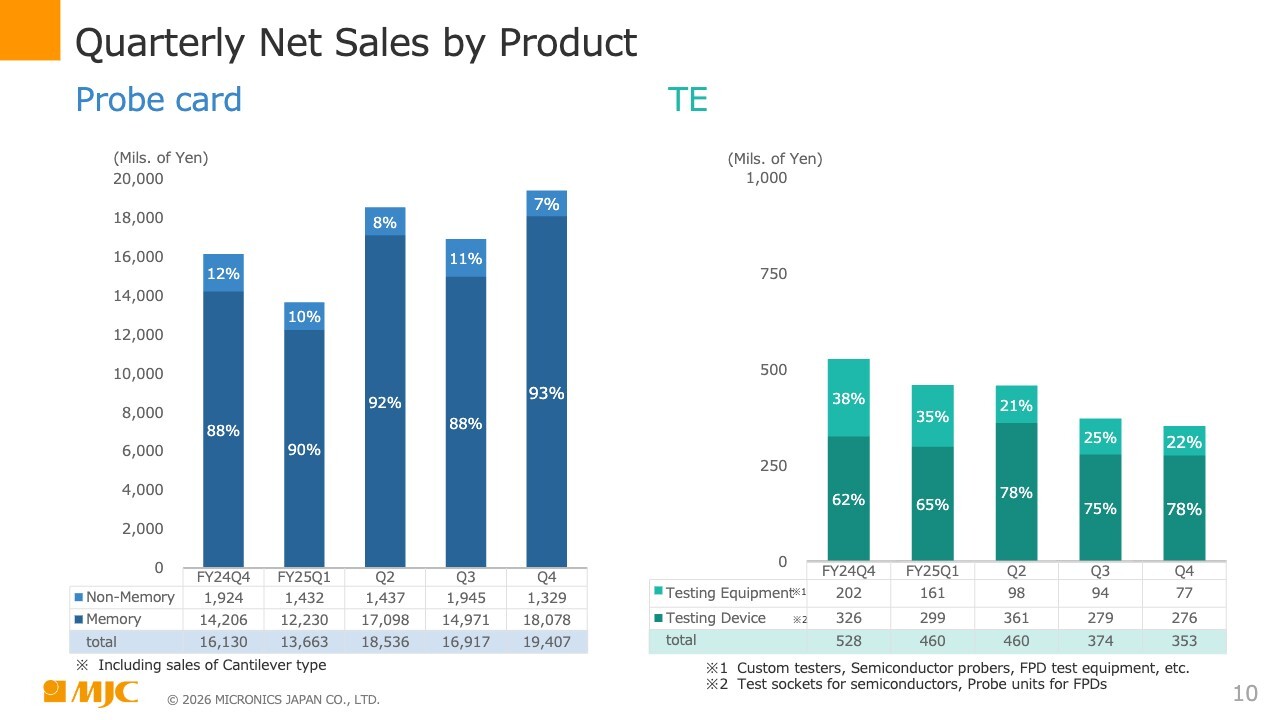
This slide shows graphs of quarterly net sales by product. The probe card business graph on the left shows percentages of memory and non-memory products. In Q4, memory products accounted for 93% of the total, while non-memory products accounted for 7%.
On a QoQ basis, net sales of memory products increased by JPY3.1 billion, while net sales of non-memory products decreased by JPY0.6 billion. As a result, the ratio of memory products increased by about 5 percentage points on a QoQ basis.
Regarding the TE business on the right of the slide, sales of semiconductor test sockets, which are inspection equipment, continue to be the main source of sales.
Quarterly Net Sales by Region
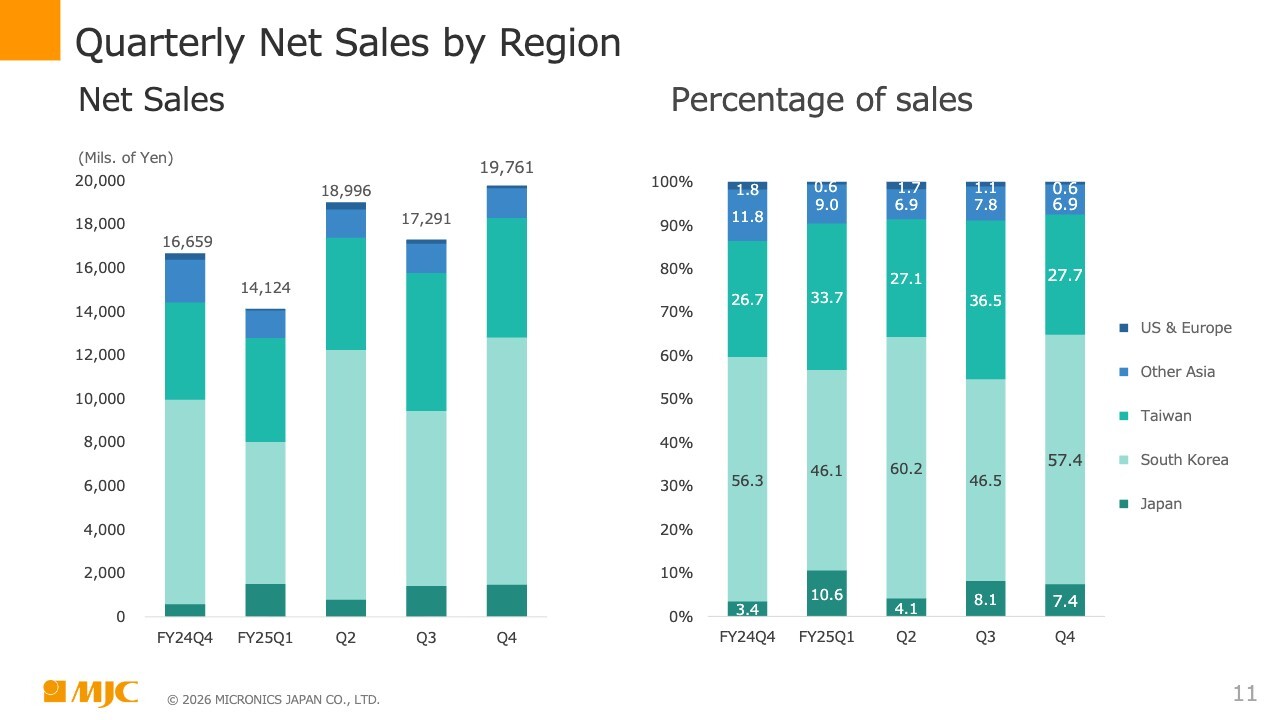
This slide is about quarterly net sales by region. The left of the slide is a graph based on net sales. Net sales in Q4 totaled JPY19,761 million. In particular, the breakdown shows an increase of JPY3.3 billion in net sales to South Korea—the second item from the bottom in the graph—on a QoQ basis.
The right of the slide shows the percentage of net sales. Net sales to South Korea accounted for 57.4% of net sales in Q4. On a full-year basis, net sales to South Korea and Taiwan accounted for 53.2% and 21% of net sales, respectively, with the two countries together accounting for approximately 80% of the Company’s net sales.
Consolidated Balance Sheet
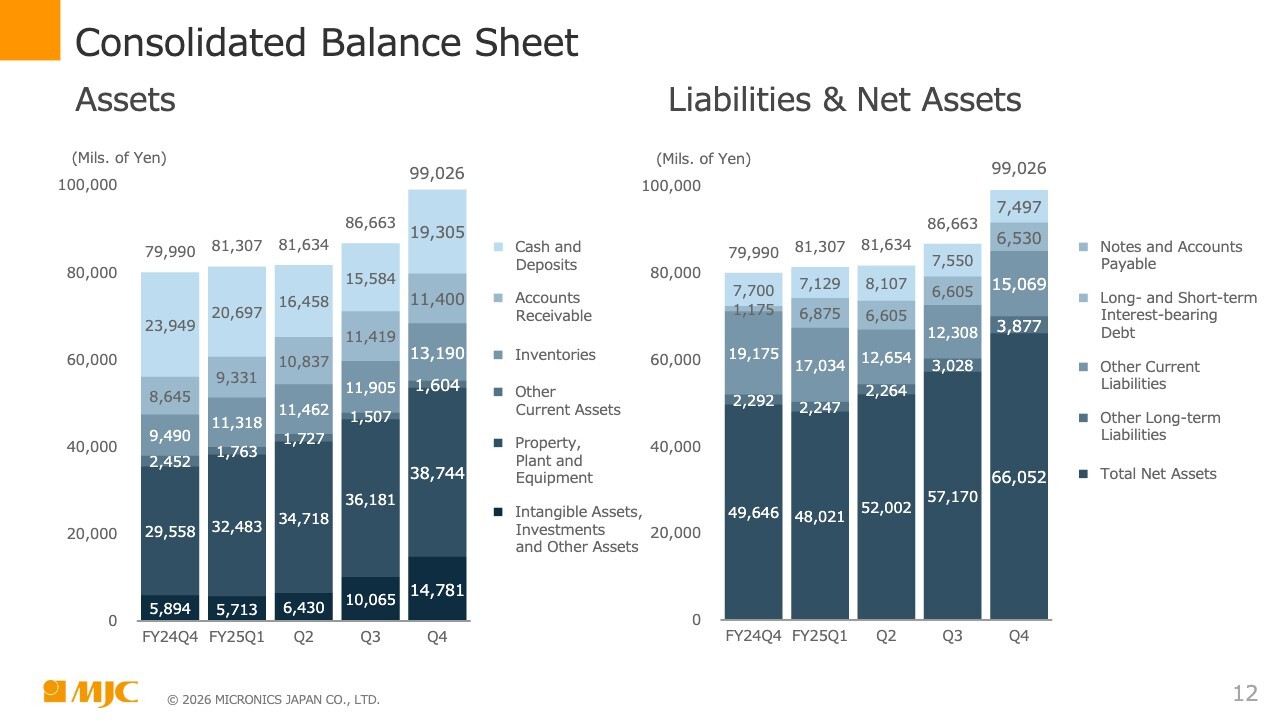
This is the consolidated balance sheet. The left of the slide is the assets section. Total assets at the end of the fiscal year were JPY99,026 million. Of this amount, cash and deposits amounted to JPY19,305 million, accounting for approximately 20% of total assets.
On a QoQ basis, “Inventories,” the third item from the top of the bar graph, increased approximately JPY1.3 billion due to an increase in order backlog. “Property, plant and equipment,” the second item from the bottom, increased by approximately JPY2.6 billion due to increased capital expenditures in response to increased production. The bottom item, “Intangible assets, investments and other assets,” increased by JPY4.7 billion. This was the result of the impact of mark-to-market valuation of policy holdings.
The Company holds six investment securities totaling approximately JPY10.7 billion. These holdings account for approximately 10% of total assets.
The right of the slide shows liabilities and net assets. Long- and short-term interest-bearing debt, the second item from the top of the graph, stands at JPY6,530 million, with an interest-bearing debt ratio of just under 10%. The Company has syndicated loans of JPY25 billion, and committed line of credit of +JPY10 billion. Currently, JPY6 billion has been utilized, leaving an unused quota of JPY19 billion.
Net assets, shown at the bottom of the graph, totaled JPY66,052 million, with an equity ratio of 66.7% and ROE of 20.9%. Net assets per share is JPY1,704 and net income per share is JPY312.
Investments/Cash Flows
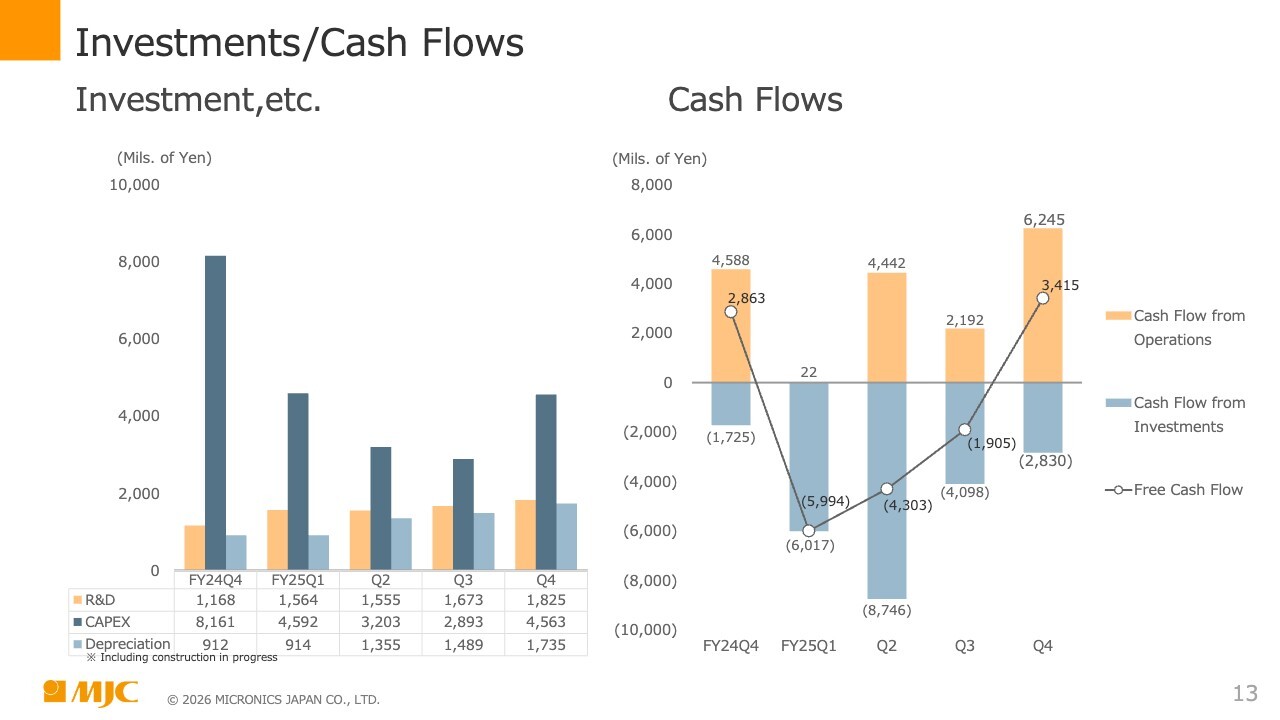
This slide shows the status of investments and cash flows. Investment, etc. on the left of the slide shows quarterly R&D expenses, capital expenditures, and depreciation.
R&D expenses continued to increase on a quarterly basis at a pace of JPY100 million to JPY200 million over the previous quarter. Depreciation shows a similar trend. Capital expenditures in Q4 amounted to approximately JPY4.6 billion, and consisted mainly of machinery and equipment.
Now I will explain the cash flows on the right of the slide. Cash flow from operations for Q4 was JPY6,245 million and cash flow from investments was JPY2,830 million, resulting in a free cash flow of +JPY3,415 million.
Full-year cash flows are disclosed in detail in the financial statements. On a full-year basis, cash flow from operations was JPY12.9 billion and cash flow from investments was JPY21.7 billion, resulting in free cash flow of -JPY8.8 billion.
With cash on hand and the execution of JPY6 billion in borrowings, our cash position at the end of the fiscal year was approximately three times that of monthly sales.
Medium- to Long-term Business Environment
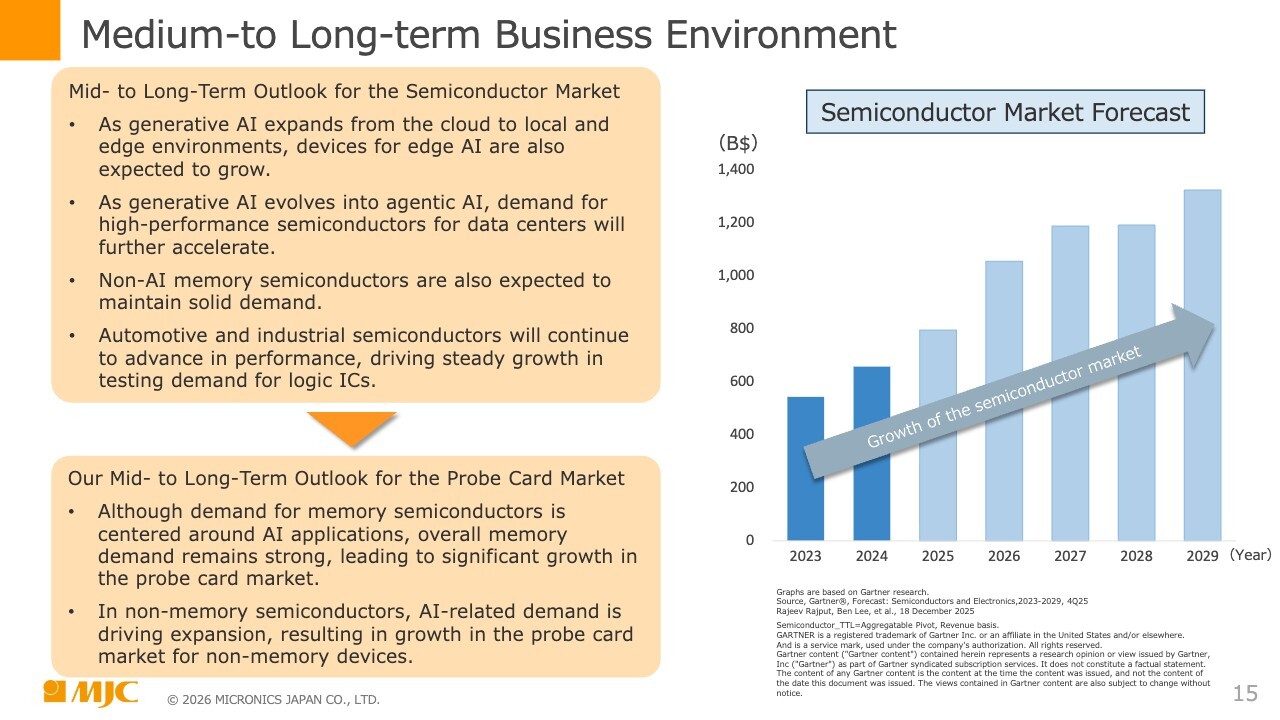
Masayoshi Hasegawa (hereafter, “Hasegawa”): My name is Masayoshi Hasegawa, President and CEO. I would like to give an overview of the Company’s business. First, I would like to discuss the medium- to long-term business environment.
Our medium- to long-term outlook for the semiconductor market is that as generative AI expands from the cloud to local and edge devices, semiconductors for edge AI will also grow. As generative AI evolves into agentic AI, demand for high-performance semiconductors for data centers is expected to accelerate further. We also expect solid demand to continue for non-AI memory semiconductors.
With automotive and industrial semiconductors, we expect an ongoing trend toward higher performance for accommodating AI devices. Demand for testing for logic ICs is also expected to grow steadily.
Our medium- to long-term forecast for the probe card market is that demand for memory semiconductors will grow significantly, mainly for AI, but also for all areas including NAND and consumer-oriented DRAM, with significant growth in the market for probe cards.
As for non-memory semiconductors, we believe that AI-related will be the driving force for expansion, resulting in growth in the non-memory probe card market as well.
The bar graph on the right of the slide shows the growth rate of the semiconductor market, for which we have cited data from Gartner research. Basically, we expect the semiconductor market to grow steadily from 2025 to 2027, and although we believe there will be some leveling off, this market is anticipated to grow steadily overall.
Medium- to Long-term Business Environment
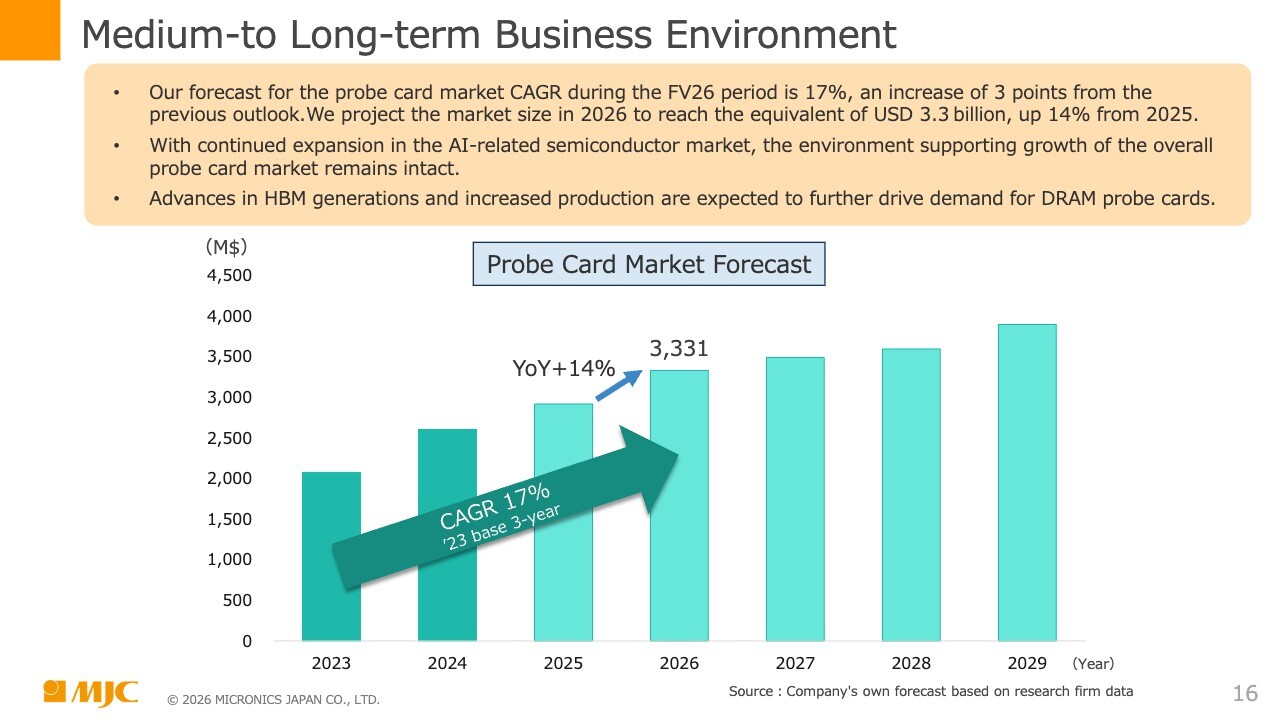
This slide is also about the medium- to long-term business environment. The bar graph on the slide represents the probe card market forecast. We expect growth of approximately 14% YoY from 2025 to 2026. We forecast a CAGR of 17% for the probe card market during Future Vision 26 (FV26), an increase of 3% from our previous forecast.
For market size in 2026, our forecast is equivalent to USD3.3 billion, or approximately 14% growth compared to 2025. We expect the environment supporting growth of the overall probe card market to remain intact as the market for AI-related semiconductors continues to expand.
We also expect demand for DRAM probe cards to grow further, driven by the generational evolution of HBM and increased production. As for HBM, we expect to see a further evolution from HBM4 to HBM4E through 2026, and the arrival of new custom HBM.
Overview of Business
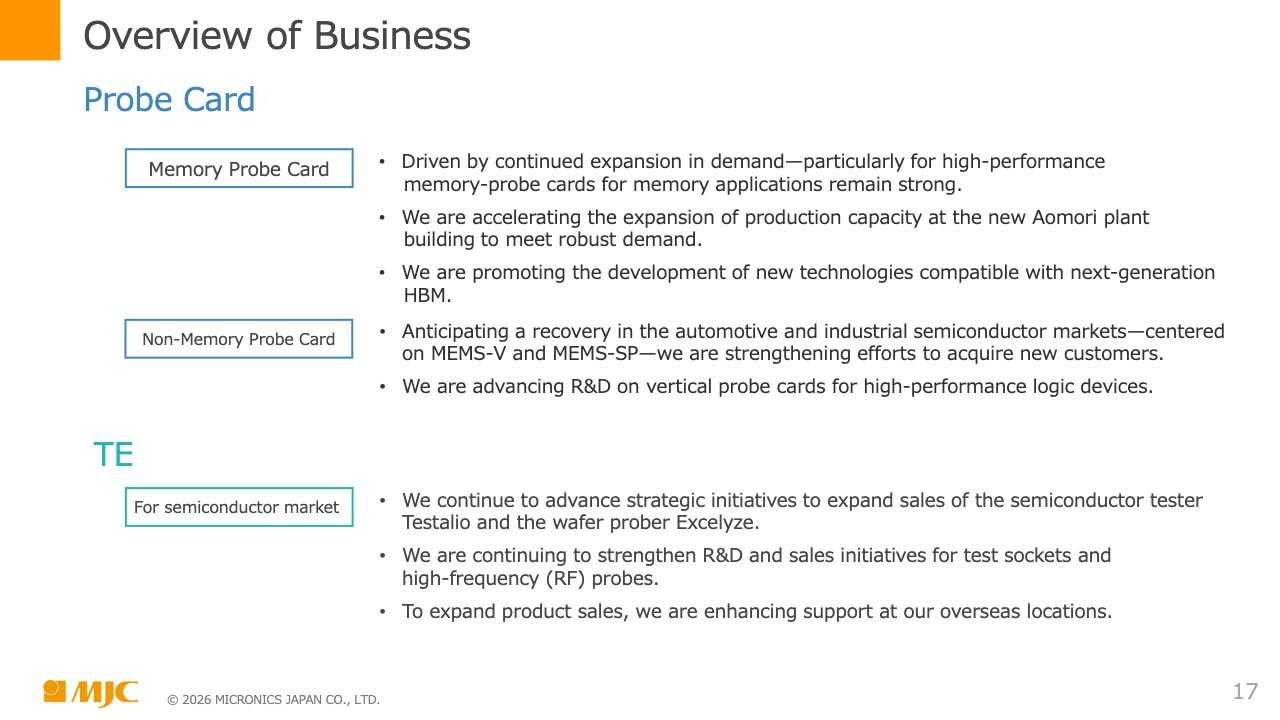
Now I would like to share our views on the business situation. In the probe card business, we expect memory probe cards to remain strong as demand continues to expand, especially for high-performance memory. We are working to meet robust demand by accelerating the expansion of production capacity at the new Aomori plant building, which was completed last year. We will also promote the development of new technologies compatible with next-generation HBM.
In response to custom HBM and other products mentioned earlier, we have focused on cantilever-type MEMS probe cards, but we believe that we need to focus our R&D on this area in order to support other probe designs as well.
For non-memory applications, we intend to strengthen our efforts to acquire new customers in anticipation of a recovery in the automotive and industrial semiconductor markets, centered on our MEMS-V and MEMS-SP products. In addition, we will promote R&D of new vertical-type probe cards for high-performance logic devices.
Next, I would like to discuss the TE business. We are focusing on the semiconductor market and will continue to promote strategic initiatives to increase sales of Testalio, a new semiconductor tester, and Excelyze, a new wafer prober that was launched last year.
We will also continue to strengthen our R&D and sales initiatives for semiconductor test sockets and high-frequency (RF) probes. To expand product sales, we will continue to enhance support at our overseas locations.
Progress of FV26
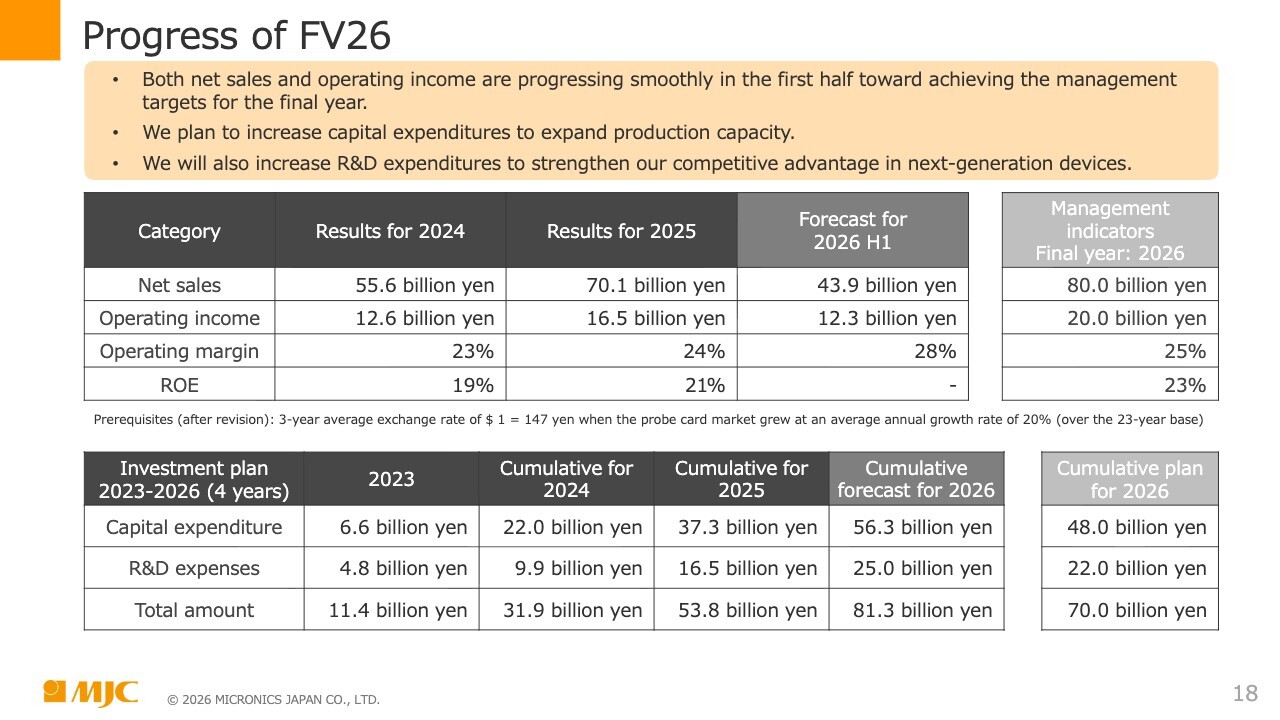
I would like to talk about the progress of our medium-term management plan FV26. We believe that both net sales and operating profit are progressing smoothly in 1H toward achieving the management indicators for the final year of the plan. In addition, we plan to increase capital expenditures in order to expand production capacity. We will also proactively increase R&D expenditures to enhance our competitive advantage in response to next-generation devices.
The table on the slide shows figures that were altered in November 2024. Compared to the sales target of JPY80.0 billion for FY2026, the forecast for 1H FY2026 is JPY43.9 billion. We intend to operate during 1H at a level well above this forecast. The same is true for profits, and we believe we can operate with a very good operating margin.
As for the investment plan, capital expenditures are expected to total JPY56.3 billion in the cumulative projected amount from 2023 to 2026. This is well above the level of the JPY48.0 billion investment, the alteration of which was announced in November 2024. R&D expenses totaled JPY25.0 billion, an increase of JPY3 billion from JPY22.0 billion at the time of the previous changes to FV26. The plan is scheduled to proceed with a total of JPY81.3 billion.
Our Forecast for 2026
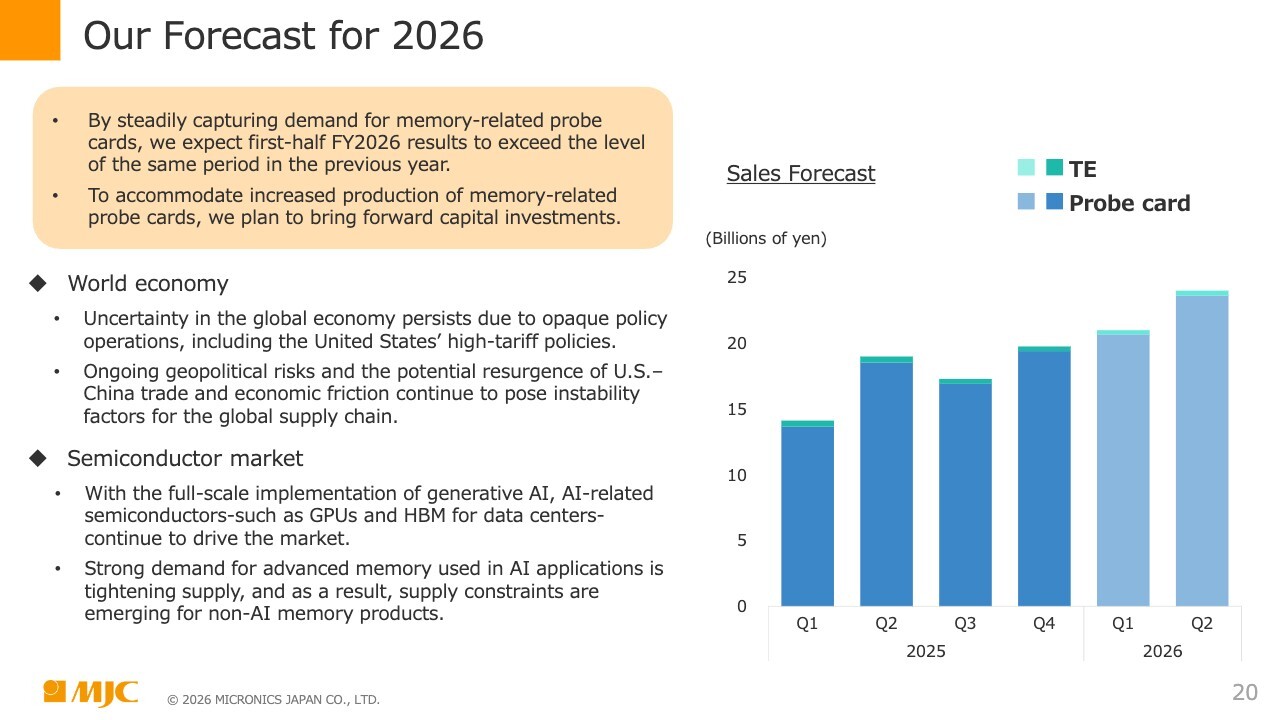
I will now discuss our financial forecast for FY2026. Our outlook involves steadily capturing demand for memory probe cards, and we expect 1H FY2026 results to exceed those of the same period in 2025. We plan to bring forward capital expenditures to accommodate increased production of memory probe cards.
However, we believe that uncertainty will continue in the global economy due to uncertainties around U.S. tariff policies and policy management. We believe that geopolitical risks will continue to be severe. We recognize the potential for renewed trade-related and economic friction between the U.S. and China, which would be a destabilizing factor for the global supply chain.
As for the semiconductor market, we believe that AI-related semiconductors such as GPUs and HBM for data centers will continue to drive the market due to the full-scale implementation of generative AI. Due to pressure on supply in response to the high demand for advanced memory for AI, supply constraints have arisen for non-AI memory.
As shown in the graph on the right of the slide, we are planning very high performance in both Q1 and Q2 FY2026 compared to the full-year 2025 quarter by quarter.
Financial Forecast
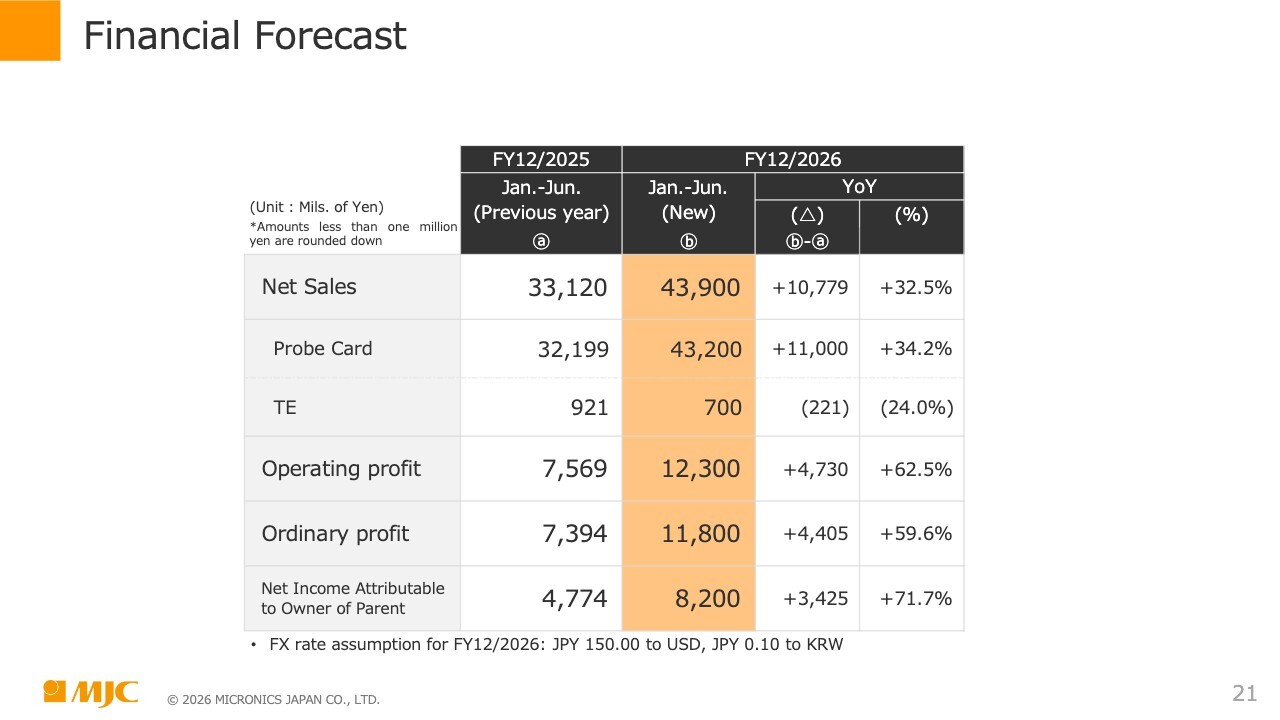
Now I will discuss specific figures. The orange portion of this table shows projected figures for January through June, as of February 13. The figures listed on the far left are for 2025. Net sales are projected to be JPY43,900 million in 1H, an increase of JPY10,779 million compared to 2025. Of this amount, JPY43,200 million is planned for the probe card business and JPY700 million for the TE business.
Operating profit is projected at JPY12,300 million, an increase of JPY4,730 million from 1H FY2025. Ordinary profit is projected to increase JPY4,400 million to JPY11,800 million, and net income attributable to owner of parent is projected to increase JPY3,400 million to JPY8,200 million.
Forecasts for R&D, Capex and Depreciation
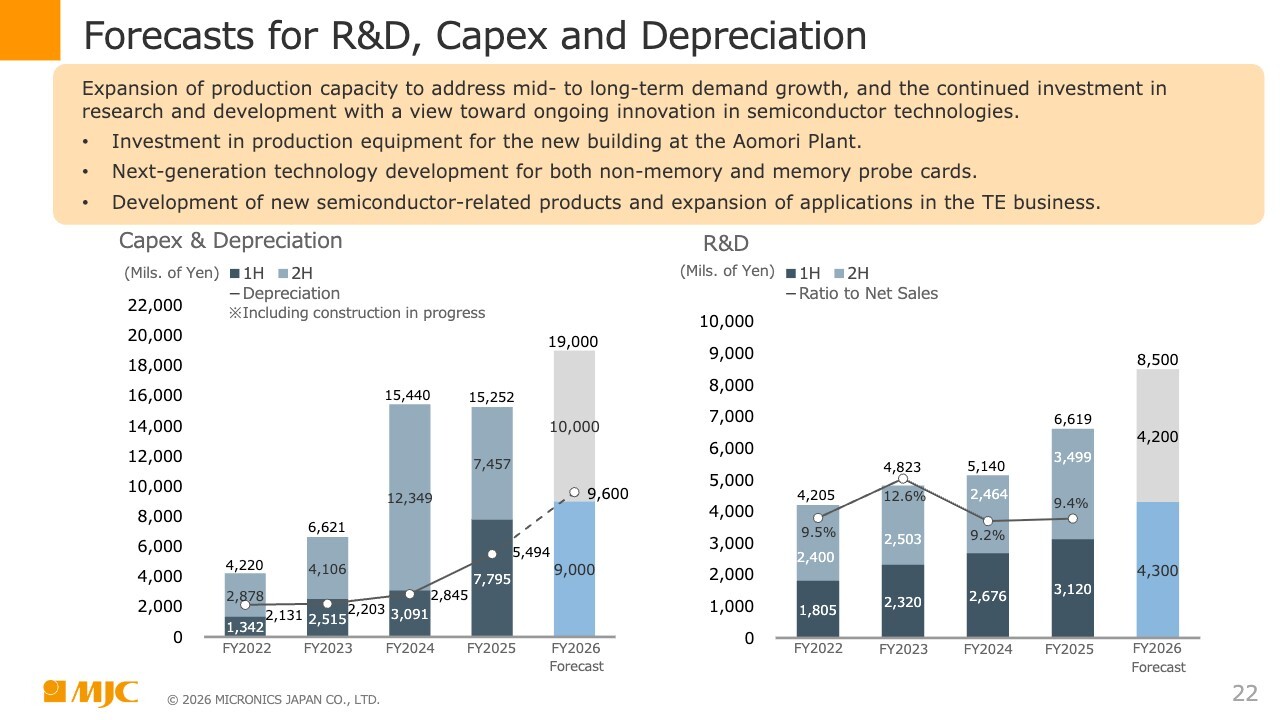
Now I will talk specifically about capital expenditures and R&D investment. In order to meet growing demand in the medium to long term, we intend to proactively expand production capacity, and to continue R&D with a view toward innovation in semiconductor technologies.
We hope to move forward with investment in production equipment for the new Aomori plant building. In addition to developing next-generation technologies for non-memory and memory probe cards, we plan to continue developing and promoting sales of new semiconductor-related products in the TE business. In addition, we plan to advance R&D, including through the expansion of applications such as probers and testers.
For FY2026, we plan capital expenditures of JPY9,000 million in 1H and JPY10,000 million in 2H, making for a total of JPY19,000 million. At the same time, depreciation is also on the rise. We plan to proceed with R&D investment of JPY4,300 million in 1H and JPY4,200 million in 2H, making for a total of JPY8,500 million.
Regarding the Sales Outlook
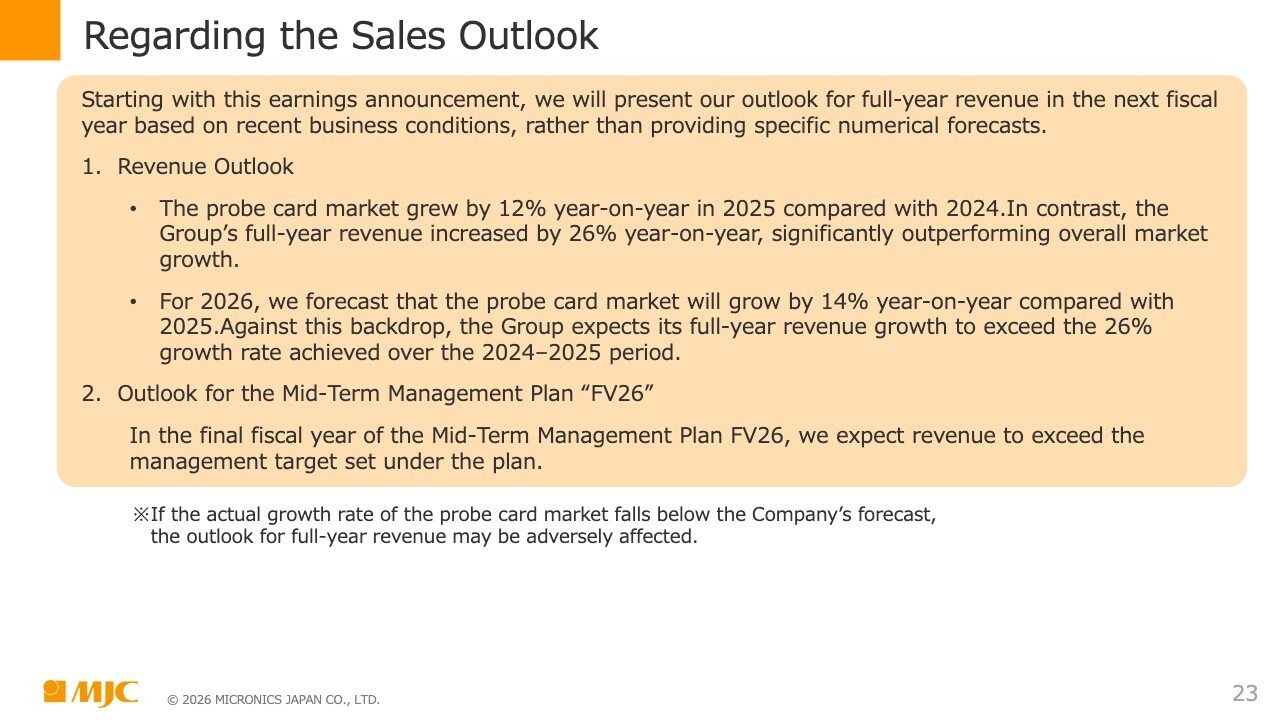
Starting with this financial results announcement, we would like to provide our outlook for full-year revenue in the next fiscal year, based on recent business conditions rather than specific numerical forecasts.
This is our sales outlook. The growth rate of the probe card market in 2025 was 12% compared to 2024, but the Group’s full-year revenue increased by 26% compared to 2024, far exceeding the market growth rate.
In the plan for FY2026, we expect the probe card market to grow at a rate of 14% YoY. Therefore, we expect the Group’s full-year net sales to exceed our net sales growth rate of 26% between 2024 and 2025.
In 2026, the final year of our medium-term management plan FV26, we expect net sales to far exceed our management indicator targets.
Regarding Order Information
Next, I will discuss order information. Starting this fiscal year, it will be our policy not to disclose order information. Disclosure of information on orders received and order backlog will cease after FY2025, and this information will no longer be disclosed from the FY2026 financial results announcement onward. The Company has determined that order information is not suitable for conveying the actual business situation or future outlook, due to short-term fluctuations and changes in the business environment.
Q&A: Probe Card Business Net Sales Forecast and Profit Margin
Questioner: I would like to ask about your estimate of this year’s net sales. Regarding probe cards, as the President and CEO mentioned earlier, the target was set at 26% or more. If we multiply that figure by the actual results for the fiscal year that just ended, we can expect a figure of just over JPY86 billion, but I understand that you are aiming for more than that. How should the profit margin be considered in such a case?
Shigeki Toda (hereafter, “Toda”): My name is Shigeki Toda, General Manager of the Corporate Planning & Strategy Office. While it is difficult to give you an exact figure for the level of profit margin, as you mentioned, we expect the full-year net sales forecast to remain at 26% or more. Regarding profit margin, we have set a management indicator of 25% in our medium-term management plan FV26, and we believe that we will continue to aim for a level higher than that.
Since it is difficult to answer regarding specific figures, we would appreciate your assessment based on our latest 1H financial forecast.
Q&A: Growth Trends in the Memory Market
Questioner: I recognize that the profit margin for the fourth quarter that just ended was very good. However, since amortization expenses are expected to increase in the future, what level of profit margin should we expect and what factors have led to the performance of net sales exceeding expectations to this point?
I understand why you are outperforming expectations in the probe card market, but what are the trends in the memory market, especially when compared to memory probe cards?
Toda: Earlier, the President and CEO mentioned that we forecast the probe card market to reach USD3.3 billion in 2026, which is a 14% YoY increase.
Although it is difficult for me to explain in detail because we have not provided specific figures, we estimate that the memory market can be expected to grow by even more than 14%.
In terms of market size, the non-memory market is considerably larger for probe cards, but the growth rate of the memory market is assumed to be much higher. We currently estimate that probe cards as a whole will grow by 14%. I will just say that if we broadly classify into memory and non-memory, the former has a higher growth rate.
Q&A: Progress of Production Capacity Expansion and Capital Expenditures
Questioner: Sales have exceeded the plan on this occasion, and I think one of the reasons for this is that production capacity has been accelerated considerably. Please explain the background to the timely increase in production capacity in relation to the fact that capital expenditures and depreciation are lower than planned.
Also, your company usually performs very strongly in Q4 and I wonder if this is due to seasonal factors. Please also tell us about your production capacity forecast for Q1 and beyond.
Toda: For the quarter in question, and specifically regarding October to December 2025, we planned to respond to a malfunction with production equipment—which I mentioned at the previous financial results meeting in August—in Q4, and for our capacity to include this response.
However, the response to this malfunction was quicker and less costly than originally planned, and the Company was able to use that amount for normal production. As a result, net sales for Q4 were much higher than originally planned. With regard to capital expenditures, the portion that appears to have fallen partially short of the initial plan is simply due to the fact that actual capital expenditure amounts were shifted to the first quarter, and actual investments are proceeding according to plan.
With regard to production capacity, the capacity scheduled to be achieved by the end of 2025 is progressing as planned. However, the amount of capital expenditures finished lower than originally planned because the recording of some amounts related to equipment was shifted to the first quarter onward.
As for capital expenditures from Q1 FY2026 onward, as the President and CEO just mentioned regarding the 1H and full-year plans, we will accelerate initial plans from the medium-term management plan and increase capital expenditure amounts. As a result, the increase in production capacity is scheduled to continue growing gradually in Q1 and Q2.
The 1H financial forecast has been formulated to reflect this. The planned sales figures for Q1 and Q2 FY2026 are clearly stated in the document “Our forecast for 2026,” which the President and CEO just talked about.
Basically, we expect production capacity to expand steadily and for net sales to grow in line with this. Since capital expenditures will continue, production capacity is expected to have grown steadily by the end of this year.
Q&A: Probe Development and Current Status in Relation to HBM4E
Toda: We have a question saying: “Does this mean that cantilevers will no longer be able to handle the transition to HBM4E? I would appreciate your technical explanation and how you see the Company maintaining its share of the memory probe card market if memory probe cards are no longer cantilevered.”
Hasegawa: I mentioned earlier that we need vertical-type probe cards, but basically I don’t see any particular problem at the moment regarding HBM4E.
As various functions are added and customized HBM and other devices are introduced, it is possible that the locations of probes—in other words, pads on devices that feed electricity from the tester—may come to be randomly placed. Therefore, we believe it is necessary to develop vertical-type probe cards.
However, this does not mean that our current U-Probe will not be available for utilization immediately, and we do not believe there are any concerns as you have stated in your question.
Q&A: Probe Card Supply System
Questioner: I understand that you are building up production capacity ahead of schedule. With annual probe card sales of JPY86 billion this year and around JPY43 billion in 1H, I recognize that your facilities continue to operate at full capacity and that capacity is steadily expanding.
The situation for 1H involves quarterly increases of JPY21 billion, JPY22 billion, and JPY23 billion, and further increases are expected in 2H. As a result, you are expected to reach JPY25 billion in quarterly sales by the end of the year, and I sense that you may be able to provide JPY100 billion in capacity in the next fiscal year.
Regardless of the amount that is achieved, the market is expanding to include a variety of applications, as the President and CEO mentioned earlier. As such, can you please explain your supply capacity, including whether you have a supply structure that can handle sales of JPY100 billion, as well as your current lead times?
Hasegawa: I cannot give you specific figures, but I am certain that the current situation will continue for some time before we are able to deliver the orders we have received from the market on the desired delivery dates.
Along with other probe card manufacturers, we are working on many initiatives to tackle this issue.
The Company is further strengthening operations to keep up with its competitors. In addition, we have a system in place to respond to all orders received in the desired timeframes, in order to provide the market with reliable delivery dates.
Currently, we have a nearly 40% share of the market for memory probe cards. We intend to take firm measures to maintain this market share and to proceed with capital expenditures. We are committed to maintaining MJC’s position in 2026 and 2027, so please stay tuned.
Q&A: Factors Behind the Increased Profit Margin in Q4 and the Impact of the Product Mix
Questioner: At the end of Q4, I believe that operating profit was significantly in excess of the Company’s plan. As Mr. Toda mentioned just now, some production problems occurred in the half-yearly financial results, and I think the impact was JPY700 million to JPY800 million. I am aware that the implication was that personnel expenses would also increase. Could you please reiterate the background to this situation?
In addition, you mentioned an improved product mix. Is this due to an increase in sales for HBM, and if not, what kind of product mix led to this result? I would like to know if you have implemented any price increases in response to market conditions.
Toda: As I mentioned earlier, one of the reasons for the profit margin in Q4 was that we had planned sufficient capacity to respond to malfunctions, but we completed our response earlier than expected and the cost of responding to the malfunction was lower than initially expected.
Regarding the product mix, we continued to assume a less profitable mix in Q4. However, the Q4 results show a very high profit margin, as disclosed in the financial results. This is because the switch to high-margin products—not only HBM but also non-HBM DRAM, general-purpose DRAM, and mobile DRAM—has progressed from Q1 to Q4 ahead of schedule, resulting in a product mix with figures that are considerably higher than originally planned. As a result, the Company finished with figures at a higher level than originally planned, and this was a factor in the improved profit margin.
We believe that the two main reasons for the profit margin in Q4 were that the initially expected costs were actually lower, and that figures for the product mix were better than originally planned. As for price increases, I will refrain from responding to this question as it is a separate discussion.
Katayama: I would like to add to my previous answer. In a comparison between the financial forecast and how the results finished, the results showed a significant improvement in profits. Specifically, operating profit finished JPY2.7 billion higher than at the time of disclosure in November, and the final operating margin also rose significantly.
In addition, the increase in profit amount was more than double the increase in sales. This was due to the fact that the portion of provisions for product warranties that was set aside in Q3 to deal with malfunctions returned several hundred million yen at the end of the fiscal year.
However, this amount is only part of the JPY2.7 billion increase in operating profit, and the main reason is still our mix of highly profitable products. Regarding the exchange rate, we initially expected JPY147 and the exchange rate finished at JPY149, but I think it can be said that the impact of the exchange rate was limited.
Q&A: Capital Expenditure Financing Plan and Free cash Flow Projection
Questioner: I would like to ask you about finances. While the Company has been very profitable in accounting terms, free cash flow for the fiscal period just ended was significantly in the red, and your plan is to increase capital expenditures significantly again this year. Please tell us how you plan to finance this capital expenditure.
Katayama: As you indicated, free cash flow was in the red by approximately JPY8.8 billion throughout 2025. However, the position of cash and deposits at the beginning of the fiscal year was very high, which was the result of a solid cash buildup in cash flow from operations in anticipation of capital expenditures.
As the President and CEO explained earlier, we are planning JPY19 billion of capital expenditures during the current fiscal year. With respect to this investment, as I mentioned a little earlier, we have approximately JPY19 billion remaining in committed lines of credit and syndicated term loans. While taking advantage of this, we also expect to strengthen cash flow from operations, as we have announced an operating margin of 28% for 1H in our financial forecast.
Therefore, our policy is to raise funds as needed from time to time while effectively utilizing cash flow from operations. The Company’s financial position is currently very sound, and we believe that the JPY19 billion in capital expenditures can be implemented within a reasonable range.
Questioner: When do you envision free cash flow moving into the black?
Katayama: To be honest, I cannot say whether we will be able to bring it to a positive level in 2026, as we are not providing specific information such as profit margin for the full year. However, when operating profit is added to depreciation, a fairly strong cash flow from operations can be assumed. I think it is possible to estimate that cash flow from operations will be strongly positive just based on the information from 1H.
Q&A: Replacement Demand for Probe Cards
Toda: The next question is: “I hear that the amount of heat generated increases as you move from HBM4 to HBM4E, but will the replacement demand increase? If so, please let us know if there is any quantitative information you can provide.”
Hasegawa: You are right about the increased amount of heat that is generated. As for replacement demand, for example, the same thing happened when DDR4 was replaced by DDR5, but probe cards are replaced each time something like this occurs. Therefore, we can expect to see approximately the same amount of replacement.
Q&A: Response in Die Level Testing
Toda: The next question is: “In the case of die level testing, what preparations are necessary in terms of products?”
Hasegawa: For our part, we will basically use probe cards, but we do not expect any major changes.
Q&A: Progress with Non-Major Customers
Toda: The next question is: “Please let us know the state of progress besides that with your two main customer companies.”
Hasegawa: Your question probably relates to the market share of the three major DRAM manufacturers, and the current situation is that we have not yet delivered large quantities to SK Hynix. However, the relationship continues to be positive and we expect greater interaction in the future.
Q&A: Market Trends and Product Development with Non-Memory Probe Cards
Toda: The next question is: “Please explain the reason for the decline in fourth quarter sales for non-memory and the outlook for this fiscal year. Please also comment on your reaction to the acquisition of non-memory customers and the development of applications.”
Hasegawa: We received a large number of orders for one particular product in Q3. The numbers involved were not as large as for memory products, but the backdrop to this is our strength in non-memory probe cards, especially for automotive applications. As a result and depending on the situation, the numbers have been increasing and decreasing very rapidly, as with series.
We expect the same environment to continue in FY2026, but given the background of the ongoing shift from the previously manufactured vertical-type probe cards to a new type of MEMS called MEMS-V, we also expect sales of MEMS-SP and MEMS-V to gradually increase for non-memory applications.
In addition, since the market is dominated by general industrial products and in-vehicle-related products, which are the forte of our MEMS-V and MEMS-SP, it is difficult to expect an immediate recovery, but we believe that we will begin to make progress with our reputation in Europe and China, partly because customers are becoming more aware of our products. We expect FY2026 to be a year of steadily sowing the seeds for the future.
In addition to these two products of MJC’s, we believe that we need to develop more arrayed vertical-type probe cards. We intend to move forward with this initiative so that we can achieve appreciable results between FY2026 and FY2027.
Q&A: Reasons for Discontinuation of the Advance Warning-Type Takeover Defense Measure
Toda: The next question is: “What are the reasons, background, etc. for discontinuing the takeover defense measure?”
Katayama: Last week, we made a timely disclosure. The Board of Directors has resolved that the Company will not continue with respect to the advance warning-type takeover defense measure. Against the backdrop of recent trends and dialogues with institutional investors, the Company has decided that its advance warning-type takeover defense measure will expire at the end of its term of validity.
In the event of a situation arising that involves a large shareholding, the Company may consider a response in accordance with the Financial Instruments and Exchange Act and other legal and regulatory means.