
FY2026/3 Q2 | Management Evaluation and Summary
Motoaki Tanigo (hereinafter “Tanigo”): I am Motoaki Tanigo, President and CEO. Thank you for joining our financial results briefing today. I will first present the overview of our financial results for FY2026/3 Q2, followed by the current status of business development by service, and finally the progress of our initiatives in the current fiscal year to achieve medium-term targets.
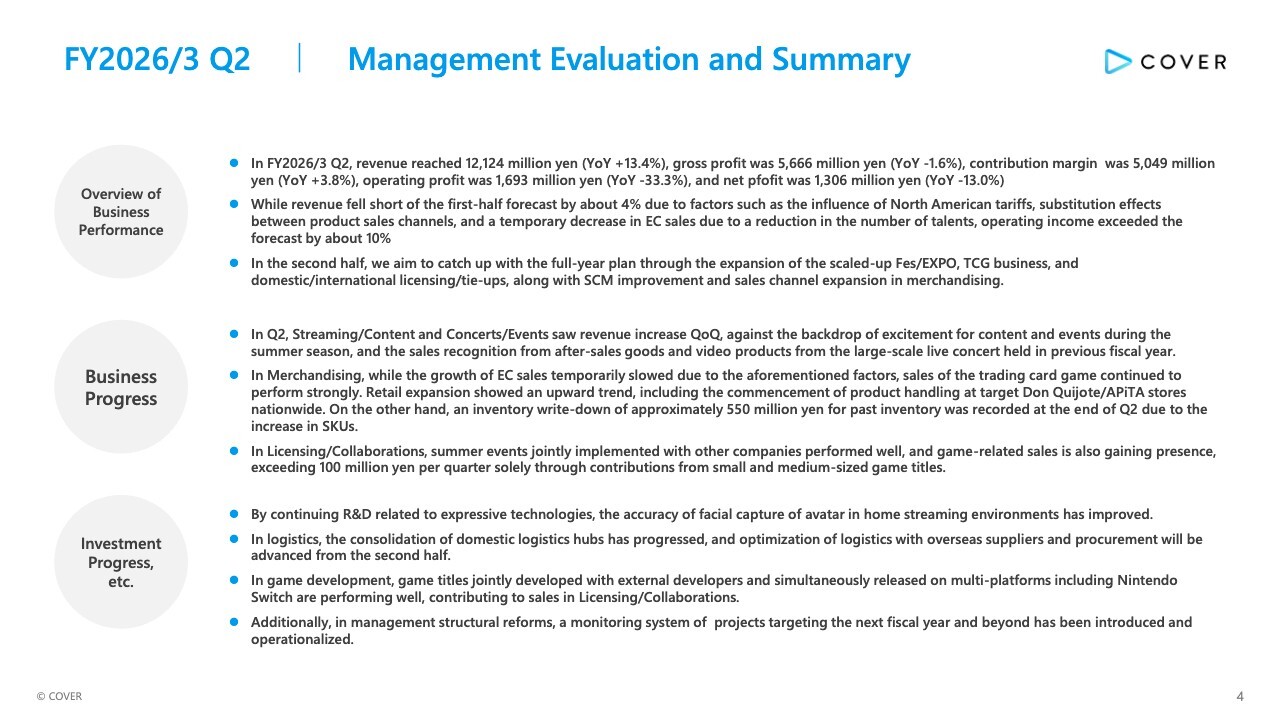
In FY2026/3 Q2, revenue reached approximately ¥12.1 billion (YoY +13.4%) and operating profit was roughly ¥1.7 billion (YoY -33.3%). While revenue fell short of the first-half forecast by about 4% due to factors such as the influence of North American tariffs, substitution effects between product sales channels, and a temporary decrease in EC sales due to a reduction in the number of talents, operating profit exceeded the forecast by about 10%.
In the second half, we aim to catch up with the full-year plan through the expansion of the scaled-up Fes/EXPO, TCG business, and domestic/international licensing/tie-ups, along with supply chain management (SCM) improvement and sales channel expansion in merchandising.
Next, let me outline our business progress. In Q2, Streaming/Content and Concerts/Events saw revenue increase QoQ, against the backdrop of excitement for content and events during the summer season, and the sales recognition from after-sales goods and video products from the large-scale live concert held in previous fiscal year.
In Merchandising, while the growth of EC sales temporarily slowed due to the aforementioned factors, sales of the trading card game continued to perform strongly. Retail expansion continued an upward trend, including the commencement of product handling at target Don Quijote/APiTA stores nationwide.
On the other hand, an inventory write-down of approximately ¥550 million for past inventory was recorded at the end of Q2 due to the increase in SKUs.
In Licensing/Collaborations, summer events jointly implemented with other companies performed well, and game-related sales is also gaining presence, exceeding ¥100 million per quarter solely through contributions from small and medium-sized game titles.
Finally, I will provide an update on investment progress, etc. By continuing R&D related to expressive technologies, the accuracy of facial capture of talent/avatar in home streaming environment has improved.
In logistics, the consolidation of domestic logistics hubs has progressed, and optimization of logistics with overseas suppliers and procurement will be advanced from the second half.
In game development, game titles jointly developed with external developers and simultaneously released on multi-platforms including Nintendo Switch are performing well, contributing to sales in Licensing/Collaborations.
Additionally, in management structure reforms, a monitoring system of projects targeting the next fiscal year and beyond has been introduced and operationalized.
Financial Highlights | Summary for FY2026/3 Q2
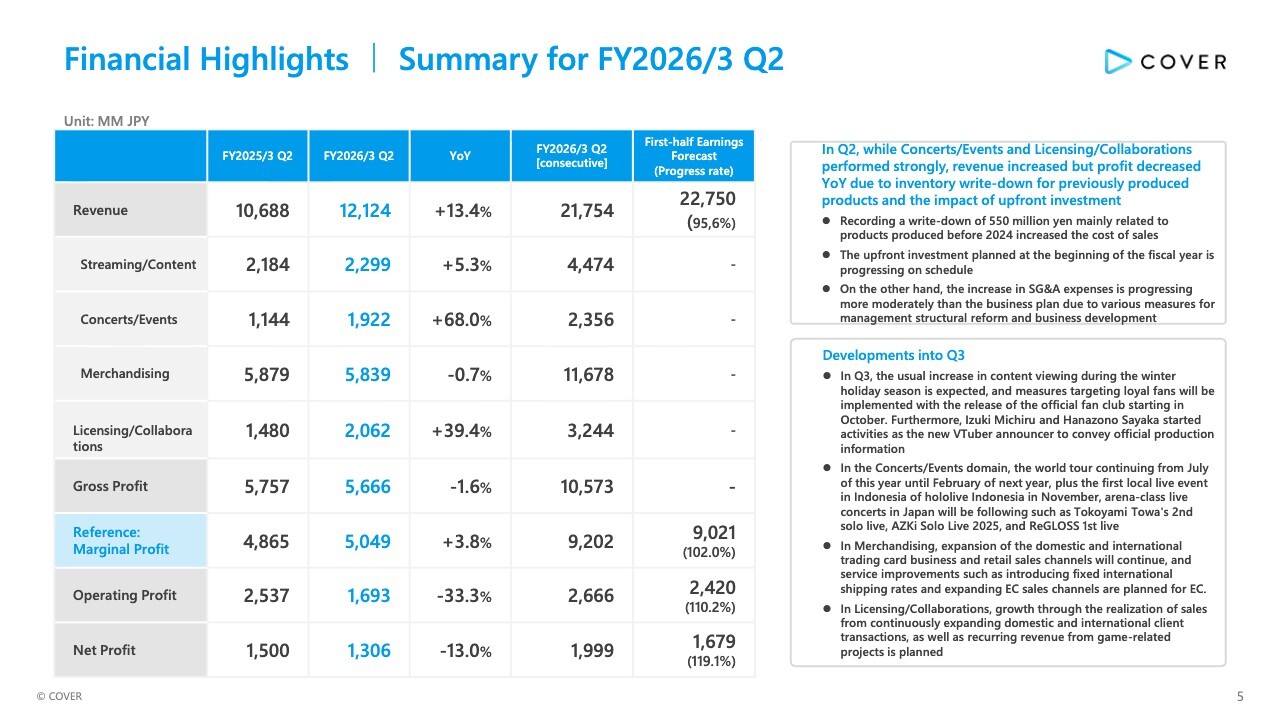
The detailed Q2 financial results are shown in the slide table. In Q2, while Concerts/Events and Licensing/Collaborations performed strongly, revenue increased but profit decreased YoY, due to inventory write-down for previously produced products and the impact of upfront investment.
Breaking down the figures, the upfront investment planned at the beginning of the fiscal year is progressing on schedule, alongside inventory optimization mainly related to products produced before 2024. As a result, a write-down of ¥550 million increased costs of sales, but the increase in SG&A expenses is progressing more moderately than the business plan due to various measures for management structure reform and business development.
The developments into Q3 are shown at the bottom right of the slide. In Streaming/Content, the usual increase in content viewing during the year-end and New Year holiday season is expected, and measures targeting loyal fans will be strengthened with the release of the official fan club starting in October.
Furthermore, Izuki Michiru and Hanazono Sayaka started activities as the new VTuber announcer to convey official production information, further enhancing the fan experience.
In Concerts/Events, the world tour continuing from July of this year until February of next year is underway, and the first local live event in Indonesia of hololive Indonesia is scheduled for November. In Japan, arena-class live concerts such as Tokoyami Towa's 2nd solo live, AZKi Solo Live 2025, and ReGLOSS1st live will continue.
In Merchandising, expansion of the domestic and international trading card business and retail sales channels will continue, and service improvements such as introducing fixed international shipping rates and expanding EC sales channels are planned.
In Licensing/Collaborations, growth through the realization of sales from continuously expanding domestic and international client transactions, as well as recurring revenue from game-related projects is planned.
Historical Trends in Revenue and Gross Profit
Yosuke Kaneko (hereinafter “Kaneko”): I am Kaneko, Director and CFO. Next, I will provide more details on our financial results.
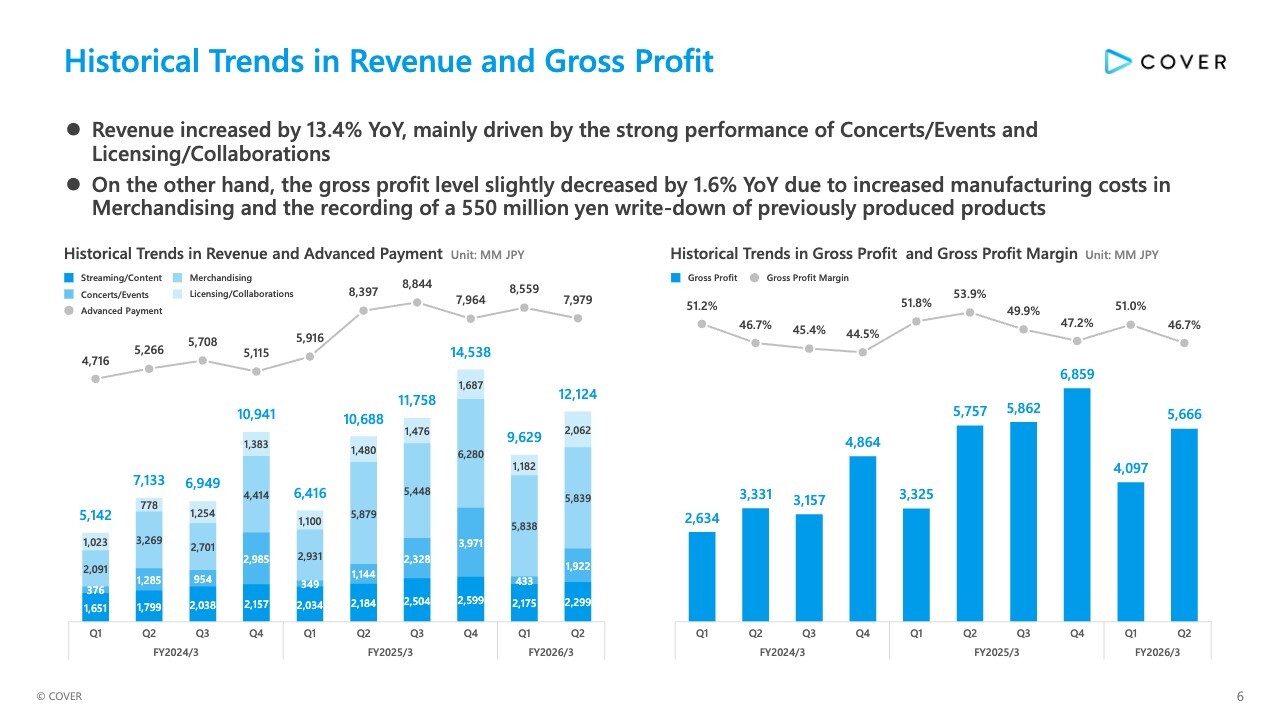
First, the historical trends in revenue and gross profit. Q2 revenue increased by 13.4% YoY, mainly driven by the strong performance of Concerts/Events and Licensing/Collaborations. On the other hand, the gross profit level slightly decreased by 1.6% YoY due to increased manufacturing costs in Merchandising and the recording of a ¥550 million write-down of previously produced products.
Historical Trends in Cost of Sales and SG&A Expenses
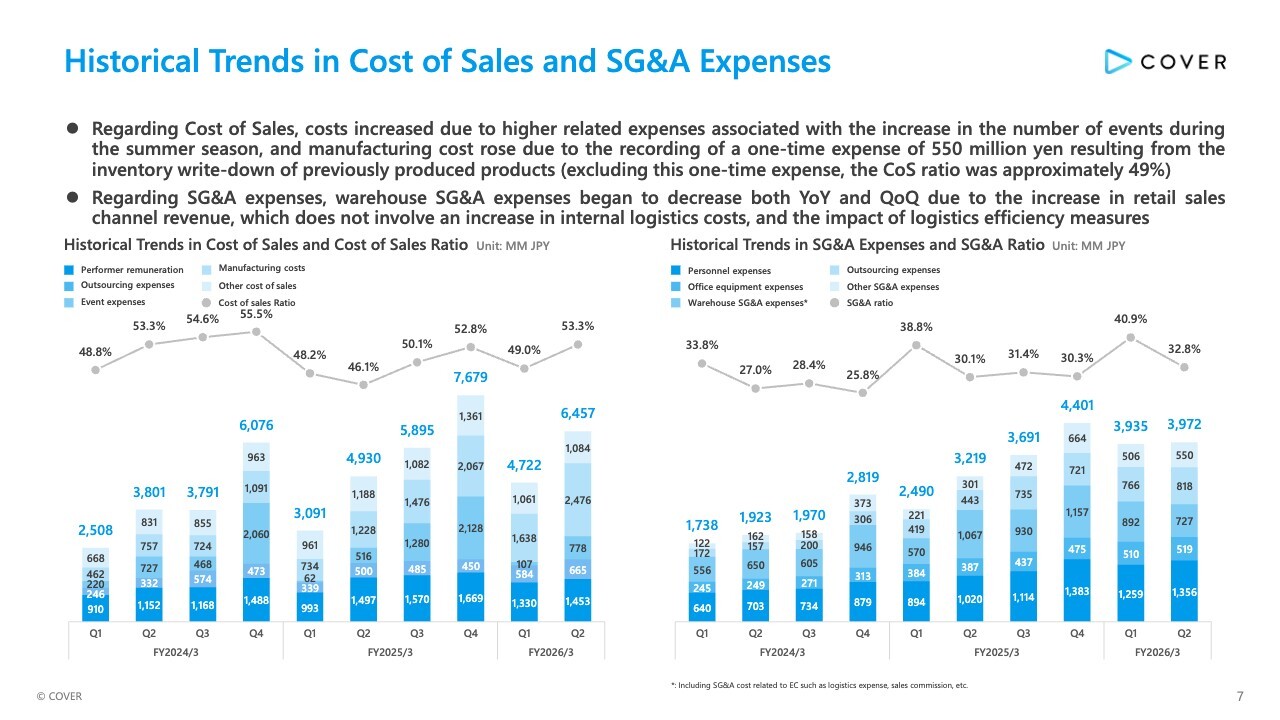
Here is the historical trends in cost of sales and SG&A expenses. Regarding cost of sales, costs increased due to higher event-related expenses associated with the increase in the number of events during the summer season, and manufacturing cost rose due to the recording of a one-time expense of ¥550 million resulting from the inventory write-down of previously produced products. Excluding this one-time expense, the CoS ratio was approximately 49%, indicating no significant change in the cost structure QoQ.
Regarding SG&A expenses, warehouse SG&A expenses began to decrease both YoY and QoQ due to the increase in retail sales channel revenue, which does not involve an increase in internal logistics costs, and the impact of logistics efficiency measures, reflecting our ongoing efforts to optimize costs.
Historical Trends in Contribution Margin and Operating Profit
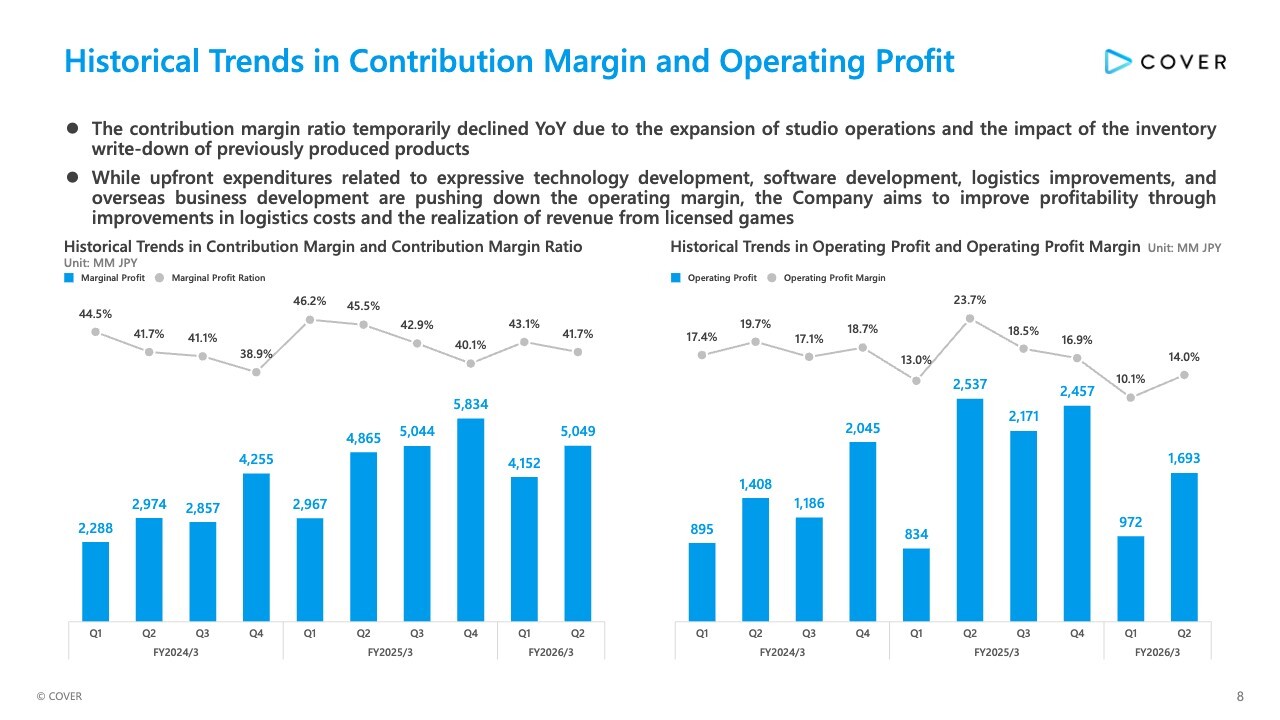
The historical trends in contribution margin and operating profit are shown here. The contribution margin ratio temporarily declined YoY, due to the expansion of studio operations and the impact of the inventory write-down of previously produced products.
While upfront expenditures related to expressive technology development, software development, logistics improvements, and overseas business development are pushing down the operating margin, we aim to improve profitability through improvements in logistics costs and the realization of revenue from licensed games.
Business Development by Services | Streaming/Content
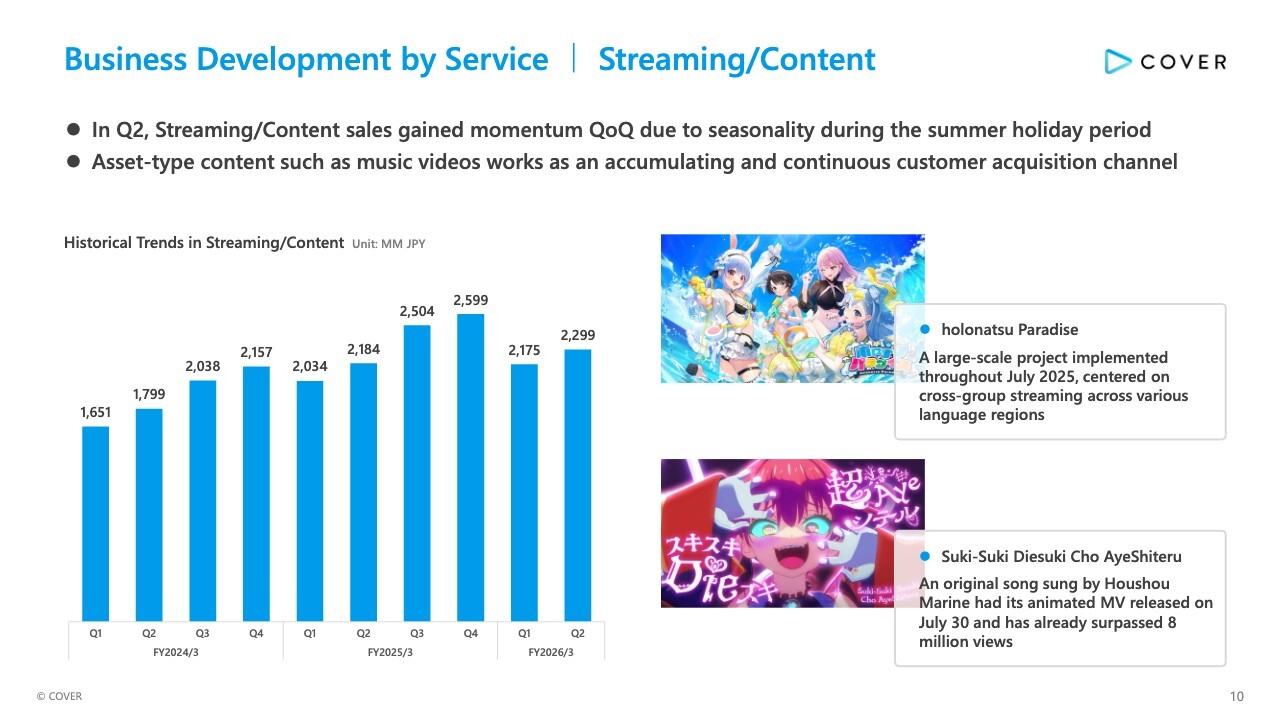
Tanigo: I will now explain the current status of business development by service, beginning with the Streaming/Content service. In Q2, Streaming/Content sales gained momentum QoQ due to increased viewership during the summer holiday period. Asset-type content such as music videos works as an accumulating and continuous customer acquisition channel.
Streaming/Content | Outlook on Traffic
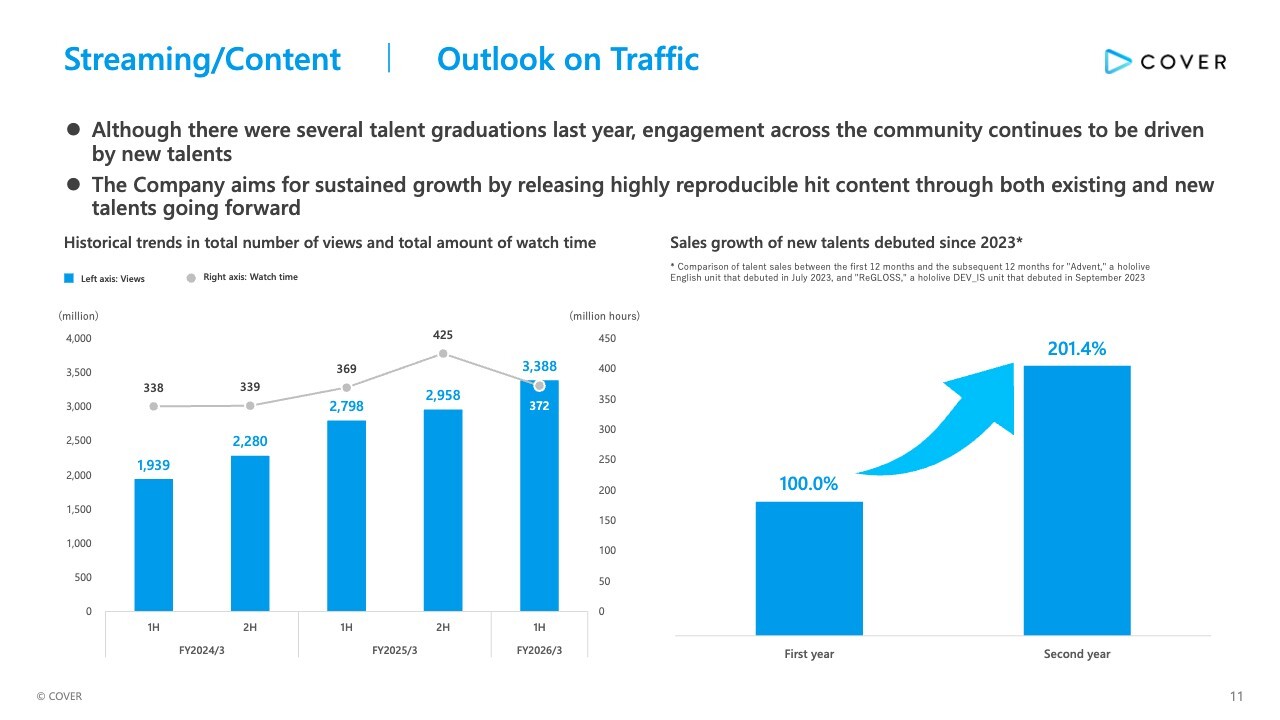
Due to several talent graduations, primarily last year, total content watch time in the first half of the current fiscal year declined by just over 10% compared with the second half of the previous fiscal year. However, views of our video content continue to trend upward thanks to the reach expansion driven by accumulated content such as music videos, short-form content like YouTube Shorts, and the acquisition of new fans through newly debuted talents.
For relatively new talents who debuted in 2023 or later, revenue in the 12 months following their debut nearly doubled compared with their first 12 months. Going forward, we aim for sustained growth by releasing highly reproducible hit content through both existing and new talents.
Business Development by Services | Concerts/Events
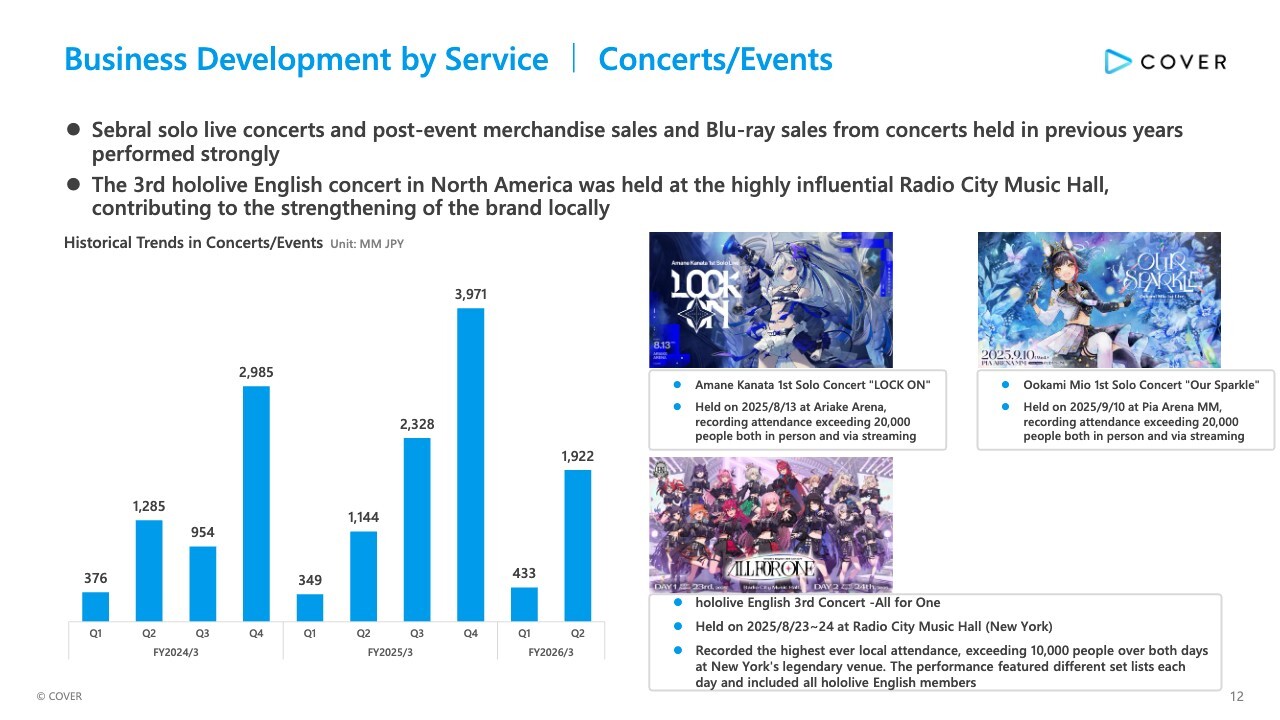
Here is an update on the business development of Concerts/Events. Strong sales from multiple solo live concerts, post-event merchandise sales, and Blu-ray sales from past shows drove a 68% YoY revenue increase in Concerts/Events.
The third full-scale “hololive English” concert in North American was held at the highly influential Radio City Music Hall, contributing to strengthening our brand presence in the North American market. We are also strengthening initiatives that leverage our past concert assets—such as broadcasting rights sales—to drive sustainable growth in Concerts/Events.
Business Development by Services | Merchandising
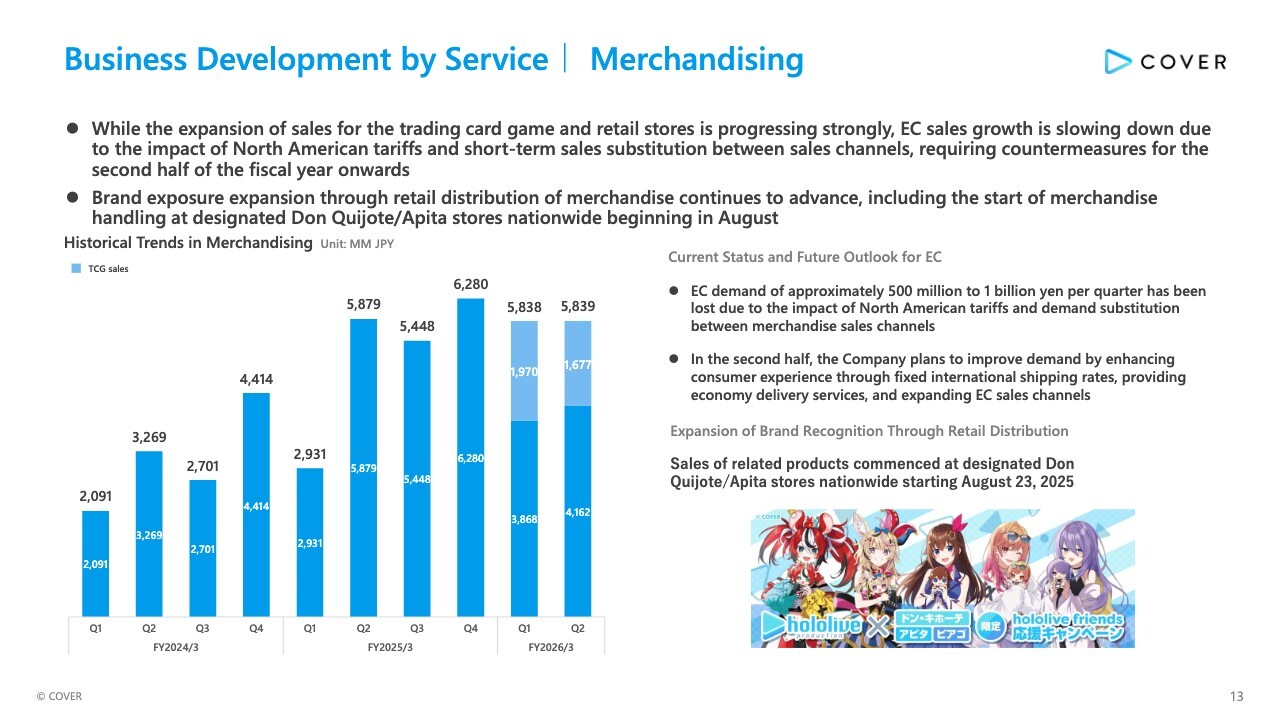
Here is an update on the business development of Merchandising. While the expansion of sales for the trading card game and retail stores is progressing strongly, EC sales growth is slowing down due to the impact of North American tariffs and short-term sales substitution between sales channels, resulting in quarterly revenue remaining flat YoY.
From the second half onward, we plan to improve demand by enhancing consumer experience through fixed international shipping rates, providing economy delivery services, and expanding EC sales channels.
Starting in August, our products commenced at designated Don Quijote and Apita stores nationwide, further expanding brand recognition through retail distribution. In Merchandising, we will pursue multi-channel expansion beyond e-commerce.
Merchandising | TCG-Related Initiatives in Q2
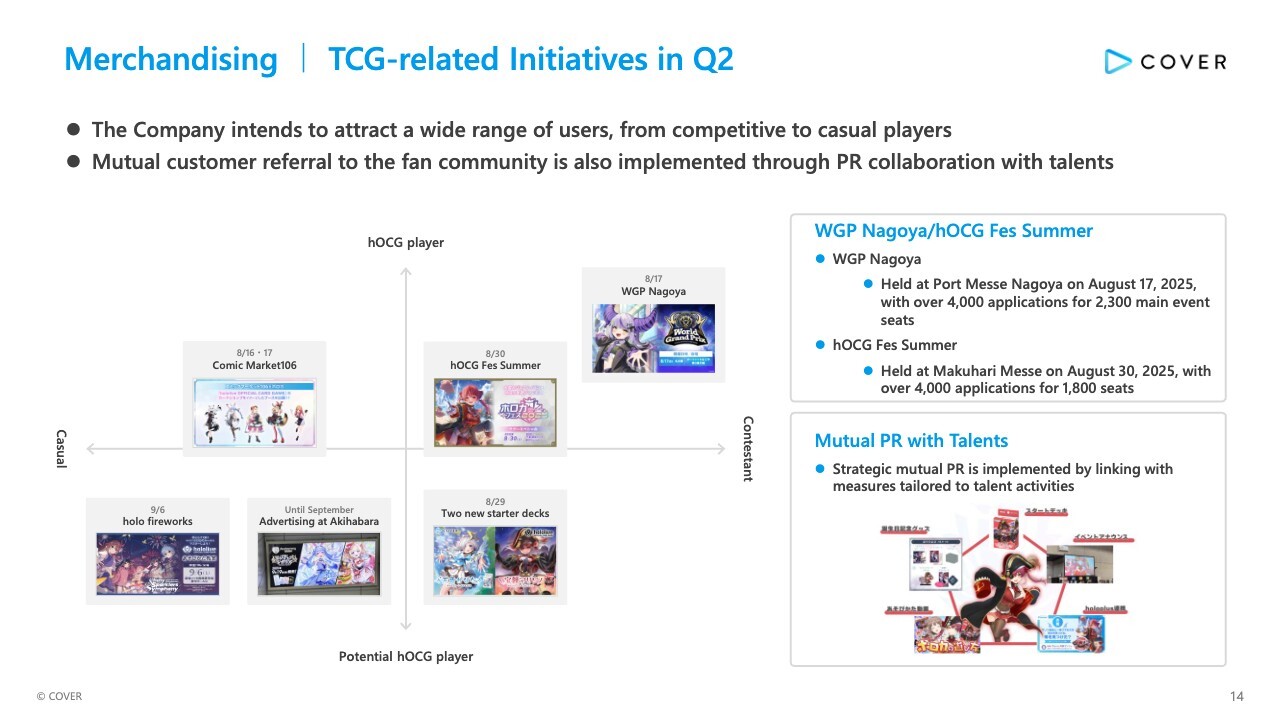
I will explain TCG-related initiatives. Within Merchandising, the trading card game market continues to expand as the player base grows.
During the summer season, we implemented initiatives to engage a broad audience—from competitive to casual players—including targeted tournaments, collaborations with our own events, expanded advertising, and cross-promotion with talents.
Quarterly revenue fluctuates due to factors such as the resale schedule of past products, but sales of the quarterly released booster packs continue to grow.
Revenue from the English-language version, which began being recognized last quarter, reached roughly ¥200–300 million per quarter. We are steadily carrying out marketing initiatives aimed at gradually expanding our sales channels in each region.
Business Development by Services | Licensing/Collaborations
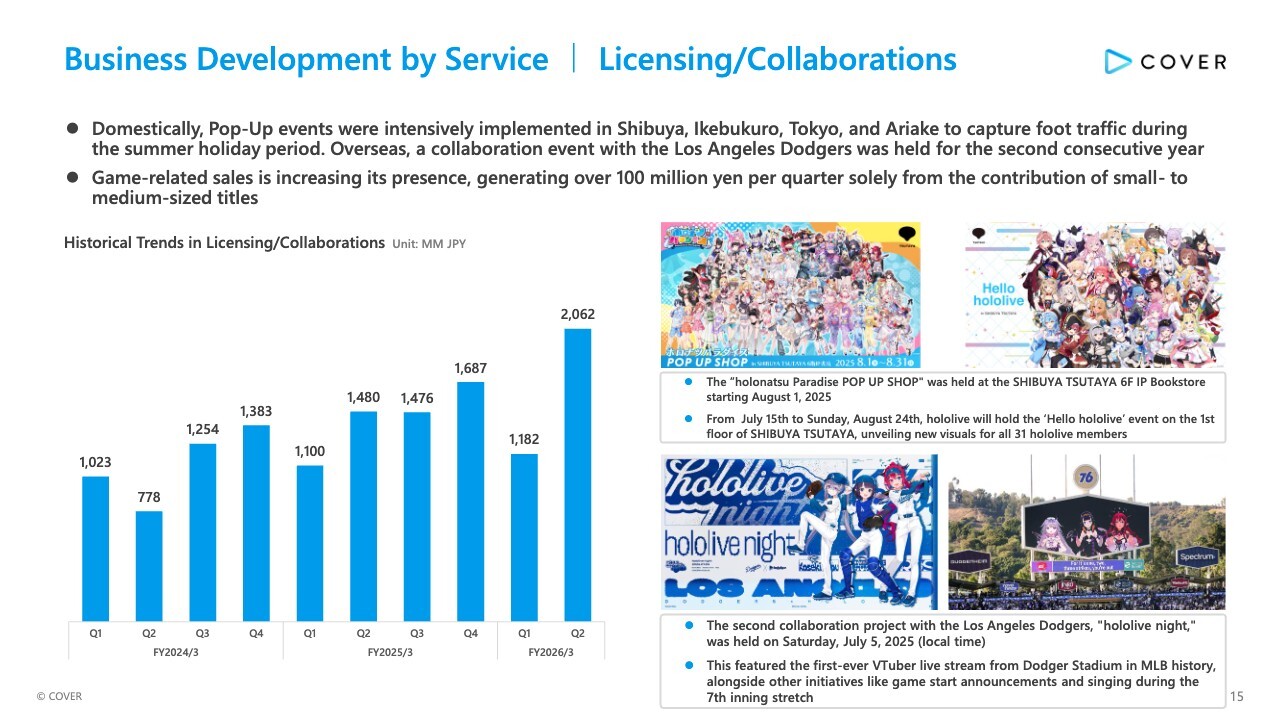
Here is an update on the business development of Licensing/Collaborations. Overall, quarterly revenue surpassed ¥2.0 billion for the first time, marking a significant 39% YoY increase.
Domestically, Pop-Up events were intensively implemented in Shibuya, Ikebukuro, Tokyo, and Ariake to capture foot traffic during the summer holiday period. Overseas, a collaboration event with the Los Angeles Dodgers was held for the second consecutive year.
Game-related sales is increasing its presence, generating over ¥100 million per quarter solely from the contribution of small-to medium-sized titles.
Status of Progress of Business Expansion to Achieve Medium-term Targets
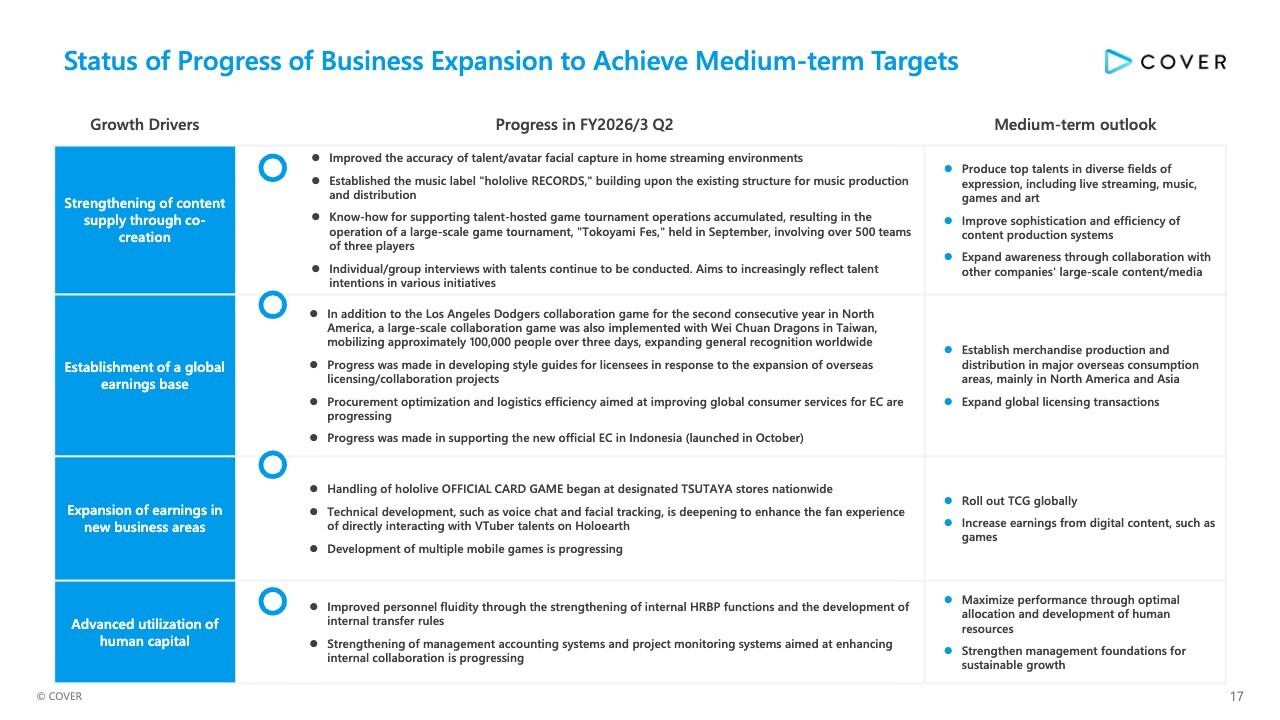
I will explain the progress of the current fiscal year’s initiatives toward achieving medium-term targets. This slide summarizes the status of progress toward the medium-term targets by growth driver.
In the first growth driver, “Strengthening of content supply through co-creation,” we are improving the accuracy of talent and avatar facial capture in home streaming environments. Because home streaming accounts for a large share of our talents’ activities, we plan to significantly expand the environment that allows them to use the proprietary motion-capture technology and avatar assets available only to our affiliated creators.
We also established the music label “hololive RECORDS,” building upon the existing structure for music production and distribution. Furthermore, we accumulated know-how for supporting talent-hosted game tournament operations, resulting in the operation of a large-scale game tournament, “Tokoyami Fes,” held in September, involving over 500 teams of three players.
In the second growth driver, “Establishment of a global earnings base,” we held the Los Angeles Dodgers collaboration game for the second consecutive year in North America. We also implemented a large-scale collaboration game with Wei Chuan Dragons in Taiwan, mobilizing approximately 100,000 people over three days.
In addition, we are developing style guides for licensees in response to the expansion of overseas licensing/collaboration projects. Furthermore, the procurement optimization and logistics efficiency aimed at improving global consumer services for EC are progressing, and we launched the new official EC in Indonesia in October.
In the third growth driver, “Expansion of earnings in new business areas,” we began handling of hololive OFFICIAL CARD GAME at designated TSUTAYA stores nationwide. Technical development, such as voice chat and facial tracking, is deepening to enhance the fan experience of directly interacting with VTuber talents on Holoearth.
In addition, multiple mobile games are under development and are scheduled for gradual release from next fiscal year onward.
In the fourth growth driver, “Advanced utilization of human capital,” we have strengthened internal HRBP functions and developed internal transfer rules, improving personnel fluidity. We are also strengthening management accounting systems and project monitoring systems aimed at enhancing internal collaboration is progressing.
Progress Status of Upfront Expenditures | Logistics Related
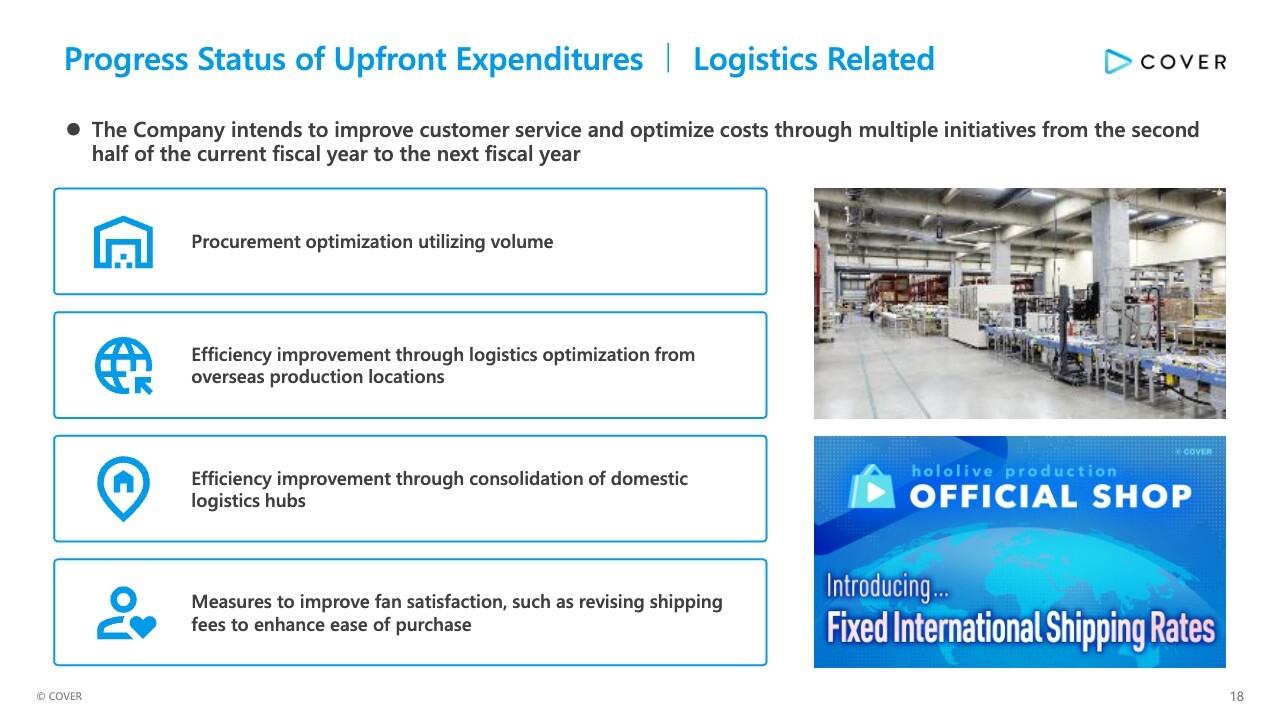
In logistics area, we will implement multiple initiatives from the second half through the next fiscal year to enhance customer service and optimize costs.
First, under “Procurement optimization utilizing volume,” we are refining order planning in the merchandise supply chain to reduce manufacturing lead times and optimize costs.
Next, under “Efficiency improvement through logistics optimization from overseas production locations,” we are consolidating shipments from international manufacturing locations to domestic warehouses to reduce procurement-related logistics costs.
Under “Efficiency improvement through consolidation of domestic logistics hubs,” we are merging multiple domestic warehouses to streamline order-to-shipment processes, aiming to shorten delivery times and reduce costs.
Under “Measures to improve fan satisfaction, such as revising shipping fees to enhance ease of purchase,” we are mitigating cost impacts through the aforementioned measures, while standardizing international shipping rates for overseas customers, enhancing the convenience of our global e-commerce services. In addition, we plan to implement numerous measures gradually to further improve our e-commerce services.
Progress Status of Upfront Expenditures | Game-related Business/Holoearth

I will explain the progress status of upfront investment in Game-related Business/Holoearth.
In Game-related Business, small to medium-sized game titles developed by external developers are gradually being released, driving sales of downloadable software for Nintendo Switch. Our VTubers are also steadily increasing their presence in the gaming market.
Holoearth centers on the fan experience of interacting with Vtuber talents. Recent updates include avatar facial and motion tracking via webcams and voice chat functionality with talents.
We are also gradually hosting “Arrival Fest ”events in the Holoearth space, where talents appear as themselves and interact with users in real time, further enhancing the fan experience.
Progress in Management Structure Reforms and Other Matters
We will report on the key initiatives in our management structure reforms as of Q2.
First, in reviewing our personnel and organizational systems, we have been gradually developing operation and management accounting systems under the new organizational structure implemented in April onwards. Additionally, the institutional reorganization of the appointment and transfer flow led to numerous instances of company-wide team reorganization and personnel reallocation.
In strengthening performer support, we continue to hold Individual/group interviews and town hall meetings aimed at sharing management status and exchanging opinions. We also strengthening the environment for creating content from the talent/fan perspective by increasing the frequency of contact between performers and various planning departments.
In cost optimization, increasing transparency of ordering status across departments is gradually driving cost rationalization for each business department. We are also advancing the inventory and optimization of SaaS services and hardware such as PCs, expected to reduce expenses by over ¥100 million on a full-year basis.
Finally, in strengthening project governance, we have introduced project operation and monitoring systems aimed at the next fiscal year and beyond, and begun their operation. We are re-evaluating existing projects based on their suitability for medium-to long-term strategy, aiming to achieve flexible resource reallocation in response to overall strategy and project progress.
Q&A: Revenue drivers and sales channel optimization in the Merchandising business
Question: I have a question regarding revenue in the Merchandising business. You explained that, due to tariffs and demand substitution across sales channels, e-commerce demand is expected to decline by roughly ¥500 million to ¥1 billion per quarter. Could you clarify what exactly is happening with this demand substitution between sales channels? Additionally, is this a temporary phenomenon, or something that can be resolved quickly through appropriate measures?
In the previous briefing, you mentioned that the impact of tariffs had begun to recover. If possible, could you give a clearer idea of how tariffs and demand substitution across sales channels might affect sales?
Kaneko: Let me explain the demand substitution effect. In the trading card game segment, sales were previously distributed roughly 30% via e-commerce and 70% through retail stores, although e-commerce still accounted for a certain portion of sales.
E-commerce sales continue, but as the trading card game matures, demand for new card packs on release day has increased. As a result, retail sales have risen over e-commerce, which involves shipping delays, and the majority of card revenue now comes through retail channels.
A similar trend is seen with plush toy series and other staple products. For example, we understand that some e-commerce demand has shifted to retail as customers prefer to see and handle plush toys sold through e-commerce in-store to check individual variations within the same plush toy series or confirm actual size before purchasing. As for the impact of tariffs, as a rough benchmark, we view the effect as being around ¥300 to ¥400 million.
Question: As a follow-up, I have a question. While some demand substitution has likely occurred to a certain extent in the past, what factors contributed to its impact on the current results? Should we understand that the company deliberately encouraged this substitution?
Kaneko: We believe the presence is gradually strengthening.
Compared with the past, retail sales channels are diversifying—for example, the official Osaka store opened in the previous quarter, and sales through general retail channels, including Don Quijote, are expanding. Therefore, we do not view overall demand as declining.
Accordingly, we are optimizing sales channels and products based on overall GMV forecasts, and we see ourselves transitioning to a process that aims to maximize revenue and profit through sales channel and product optimization.
Although our short-term revenue balance may appear uneven, we plan to implement an internal management system similar to those used by major IP license companies. This will allow us to track product supply and demand trends by IP and product, analyze areas of excess capacity, and expand internal capabilities to optimize the entire sales channels—including merchandising, as well as licensing/tie-ups—thereby supporting overall business growth.
Q&A: Current trading card revenue and outlook for the second half
Question: I have a question regarding trading card revenue, which may relate to the previous discussion. Current revenue are around ¥1.7 billion, slightly below the ¥2.0 billion recorded in Q1. Given the first anniversary and the start of overseas expansion, I expected stronger numbers. What is the outlook going forward?
Kaneko: Regarding trading cards, we understand that fundamentals remain strong, with real demand expanding alongside the growing player base. For example, in Q1, sales of resale products temporarily boosted revenue to nearly ¥2.0 billion, but this does not indicate a decline in quarterly booster pack sales.
Quarterly revenue fluctuates slightly depending on product supply schedules. However, sales of booster packs released each quarter are trending upward, and considering the excess demand from players registering for tournaments, we believe real demand is steadily expanding.
On the other hand, we expect that growth in overseas markets may take some additional time to accelerate.
In overseas card markets, particularly in North America, the structure differs from Japan, where major card franchises handle everything from purchasing to sales. Instead, the market is highly fragmented, with a vast number of family-office card shops and small- to mid-sized buyers dispersed across different regions.
Therefore, marketing efforts in such markets require more time. We plan to gradually implement measures, such as expanding region-specific marketing strategies, to steadily grow sales over the medium term.
While second-half trading card revenue remain difficult to predict, we expect underlying demand to remain strong throughout the year. This may fluctuate with product supply schedules, but we are confident in the medium- to long-term market growth.
Q&A: Progress on logistics cost reduction following the launch of the new logistics center
Question: I have a question regarding logistics costs. As noted in the briefing materials, the new logistics center began operations in June, and according to the breakdown of SG&A expenses, warehouse-related SG&A fell by about ¥200 million in Q2 compared with Q1. This seems to show early results—can we expect this reduction to continue accelerating going forward?
Could you clarify whether the effects will be visible immediately from Q3, or if they will gradually materialize over the medium to long term?
Kaneko: The complex measures outlined on page 18 are progressing on different timelines. Therefore, we cannot definitively say at this point whether they will deliver accelerated results in the second half.
For example, there is potential to reduce costs by over ¥1.0 billion on an annualized basis or achieve significant cost savings. We are currently finalizing implementation plans, and while some effects will materialize in the short term, others are expected to take effect over the medium to long term.
Q&A: Outlook for achieving second-half plans and key drivers
Question: Operating profit exceeded the company plan for the first half by about 10%. However, it appears to have declined YoY. Looking ahead to the second half, how do you plan to achieve the next targets?
Additionally, in the second half, plans include activities for highly popular units and the first local live event in Indonesia. Could strong merchandise sales and a significant increase in event revenue from these activities serve as key drivers for achieving full-year company targets?
Kaneko: In the second half, we continue to aim for profit levels in line with the company’s guidance announced at the beginning of the fiscal year. As of the end of Q2, strong performance in Concerts and Licensing, along with the contributions of the expanded sales team over the past fiscal years, continues to drive revenue and profit in Licensing/Collaborations.
Meanwhile, Merchandising is slightly below the initial plan, as noted earlier. To catch up, we plan to implement corrective measures in e-commerce, including introducing fixed shipping fees, expanding economy delivery services, and enhancing e-commerce convenience.
Our business structure has historically allowed us to achieve substantial growth in the second half. As you pointed out, when major events occur in succession, the resulting increase in overall customer-traffic momentum can naturally lift all segments. Building on this foundation, we intend to further enhance revenue and strengthen our operations through continued business development efforts.
Additionally, because trading card revenue remains strong, the key will be how much they can offset the temporary slowdown in e-commerce growth.
Q&A: Overseas business performance and the achievements of COVER USA
Question: I have a question regarding your overseas business. It has been about a year since you established COVER USA. While Licensing and Collaborations appear very strong, are these segments also performing well in overseas markets?
Additionally, has the establishment of COVER USA contributed to stronger local recognition of VTubers and robust sales of merchandise? We would appreciate your insights on the overseas situation.
Kaneko: We are pursuing multi-layered business development overseas. At this stage, we consider ourselves in a short-term phase rather than a long-term one.
In the short-term phase, we have secured major partnerships, such as the local collaboration with the Los Angeles Dodgers mentioned on page 15 and the previously announced large-scale collaboration with Twitch. These initiatives deepen localization efforts, and we view our North American operations as effectively functioning.
The growth in North American revenue is driven not only by live concerts but also by an increase in outbound projects from Japanese companies entering the region, which has raised our local presence.
Additionally, Japan is promoting global IP exports as a national policy, which was also highlighted in last year’s Cool Japan strategy. Strong support from the government and relevant ministries provides a favorable tailwind.
As I mentioned, marketing trading cards in North America takes time to penetrate local distribution channels. In this context, the North American office is expected to play a key role in identifying local partners, advancing localization, and driving marketing activities in the second half and into the next fiscal year.
Q&A: Decrease in advanced payments for made-to-order merchandise and factors driving the variance
Question: I have a question regarding merchandising, specifically made-to-order merchandise. This year, it seems that the variance from the amount of advance payments has grown larger than before. What factors are the factors behind this?
In addition, the second quarter is typically a period when advanced payments build up, but this time they have declined. Could you also explain the factors behind this decrease?
Kaneko: By “variance,” are you referring to the gap between the advanced payments built up in the previous quarter and the revenue recognized in the current quarter?
Question: Yes. Historically, roughly half of the total advanced payments has been recognized as revenue, which was the usual pattern. I am asking because the current situation seems to deviate from this, and I’d like to understand the reason for this variance.
Kaneko: Advanced payments reached roughly ¥8.5 billion in Q1, reflecting distinct customer segments within our e-commerce channel, each showing different demand patterns by product line. These advanced payments span product groups with varying lead times from production to sale.
When order volumes are relatively even across products, revenue recognition against advanced payments tends to follow a predictable quarterly pattern. However, slight fluctuations in product-level order volumes create variance between the advanced payments booked in Q1 and the revenue recognized in Q2.
In particular, we have not observed significant shipment delays due to logistics issues relative to the order backlog.
Recent decline in advanced payments accumulation reflects several factors. EC sales as mentioned earlier now substitute for other channels and products, North American demand has weakened year over year due to tariff impacts, and the one-off surge from commemorative goods for graduating talents in previous fiscal years has fully run its course. These elements collectively drove the decline.
Q&A: Substitutability of merchandise included in advanced payments
Question: I had understood that advanced payments primarily relate to made-to-order merchandise, consisting of items whose demand is less likely to be substituted through retail channels. So, does this mean that some of these items can, in fact, be substituted?
Kaneko: Identical items sold through e-commerce channels, such as plush toys, are unlikely to appear as made-to-order merchandise in retail stores. However, when customers have broader demand for categories like plush toys or apparel, some substitution may occur.
Regarding tariffs, we believe they are exerting a downward pressure even on made-to-order products.
A portion of the advanced payments also comes from pre-sales and post-event sales of live merchandise. Since these revenues are recorded under Concerts/Events, they also contribute to the observed variance.
Q&A: Contribution of Nintendo Switch games to Licensing/Collaborations
Question: Please explain the contribution of games co-developed with external partners, such as those for the Nintendo Switch, to Licensing/Collaborations.
Kaneko: On a quarterly basis, the Q2 revenue impact from these titles ranged between ¥100 million and ¥200 million. Revenue contribution varies by title, depending on whether a game is a hit or a moderate performer.
Mid-sized titles released on the Nintendo Switch generate more consolidated revenue compared with smaller, indie-style games. Several titles are now expected to deliver individual revenues of ¥100–200 million.
Q&A: Impact of talent attrition and VTuber departures on revenue
Question: Regarding revenue from Merchandising, you provided relatively specific figures for the impact of North American tariffs and substitution effects across sales channels. Could you also clarify the revenue impact attributable to the decrease in talent and VTuber departures?
Kaneko: Quantifying the exact mathematical relationship between a decline in talent numbers and EC sales is challenging. However, as an example, each talent typically drives around two made-to-order merchandise sales annually, tied to birthday or anniversary events. While the impact varies by talent, the lost sales opportunities represent a direct effect on revenue.
We believe higher overall traffic increases customer engagement with content that drives purchases. However, total content watch time has declined roughly 10% compared to the previous second -half, suggesting this reduction may be affecting customer exposure and engagement to some extent.
Q&A: Inventory write-downs associated with increased SKUs and outlook going forward
Question: With the recent increase in SKUs, I understand that you recorded a past inventory write-down of ¥550 million. Given your broadening product lineup, further SKU expansion could similar risks and trigger additional inventory write-downs. Could you share your view on these inventory write-downs?
Kaneko: Since our listing, we have deliberately expanded our SKU count. Previously, the limited number of SKUs often left customers unable to find what they wanted when visiting our e-commerce site.
During the merchandising expansion around 2023–2024, increasing the number of products led to a cumulative buildup of excess SKUs within individual series.
Currently, order management and demand forecasting have improved compared to that period. During this period’s warehouse relocation, we conducted a thorough inventory review and implemented targeted write-downs on slow-moving or space-consuming past stock to streamline operations.
We view the current phase as a temporary cleanup of past inventory rather than a long-term trend. By conducting semiannual inventories and improving demand forecasting, we aim to gradually curb large-scale write-downs.