
Index
Shiro Tomiyasu (hereinafter, Tomiyasu): Good afternoon. I am Shiro Tomiyasu, President and Representative Director of ISEKI & CO., LTD. Thank you very much for taking the time to join our briefing today. I would also like to express my sincere appreciation for your continued guidance and support toward our IR activities. Today, I will proceed in accordance with the index shown.
Key Points
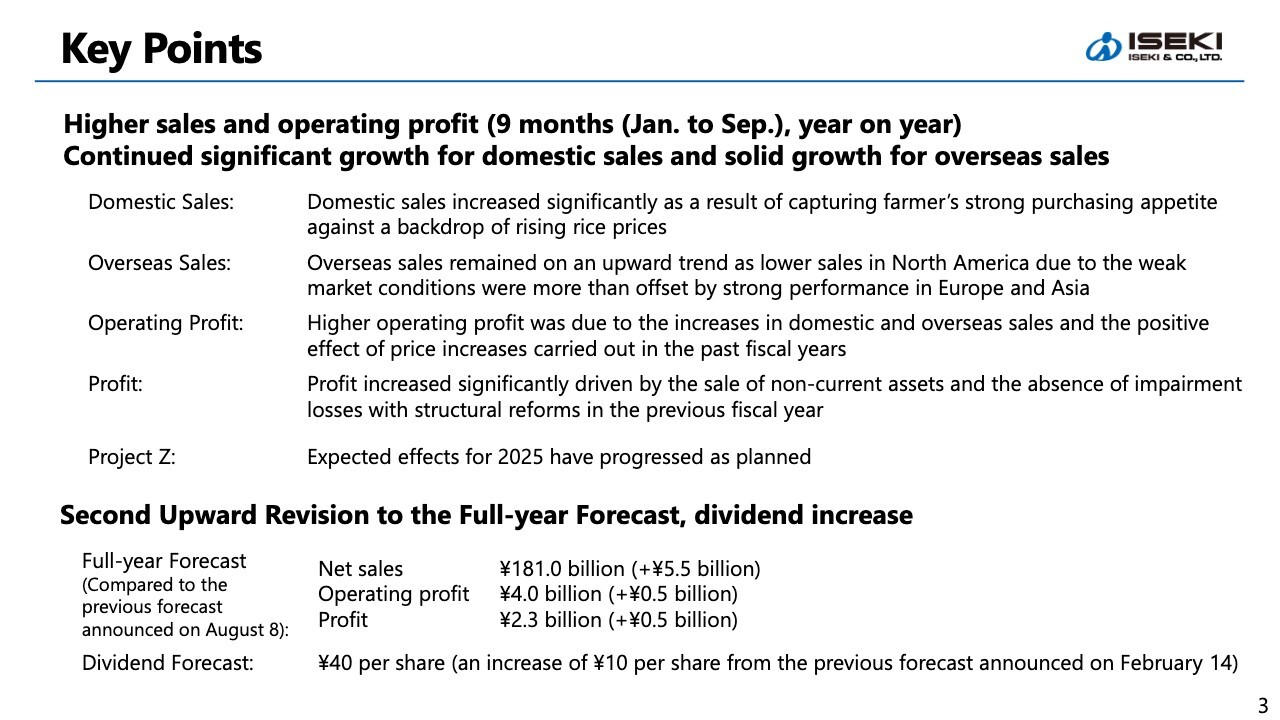
Let me begin by summarizing the key points of the financial results. For 3Q FY12/2025, sales and operating profit increased year on year. Domestically, we continued to record a significant increase in sales, while overseas sales also remained steady and posted an increase. The slide outlines the main components of domestic and overseas sales. I will explain the details later.
On the profit side, operating profit increased due to higher sales domestically and overseas, as well as the benefits from price revisions implemented in prior years. Quarterly profit attributable to owner of parent grew substantially, reflecting gains on sale of non-current assets and the absence of impairment losses associated with structural reforms in the previous fiscal year.
Regarding “Project Z,” which we have been vigorously driving forward, the benefits realized in this fiscal year have progressed as planned.
As for the full-year forecast, by the end of 3Q we had already exceeded the sales and profit projections announced in August 2025. As both sales and profit are expected to surpass the August forecast for the full year as well, we have revised our forecast upward once again.
In addition, we have revised our dividend forecast to ¥40 per share, representing an increase of ¥10.
Outline of Consolidated Business Performance
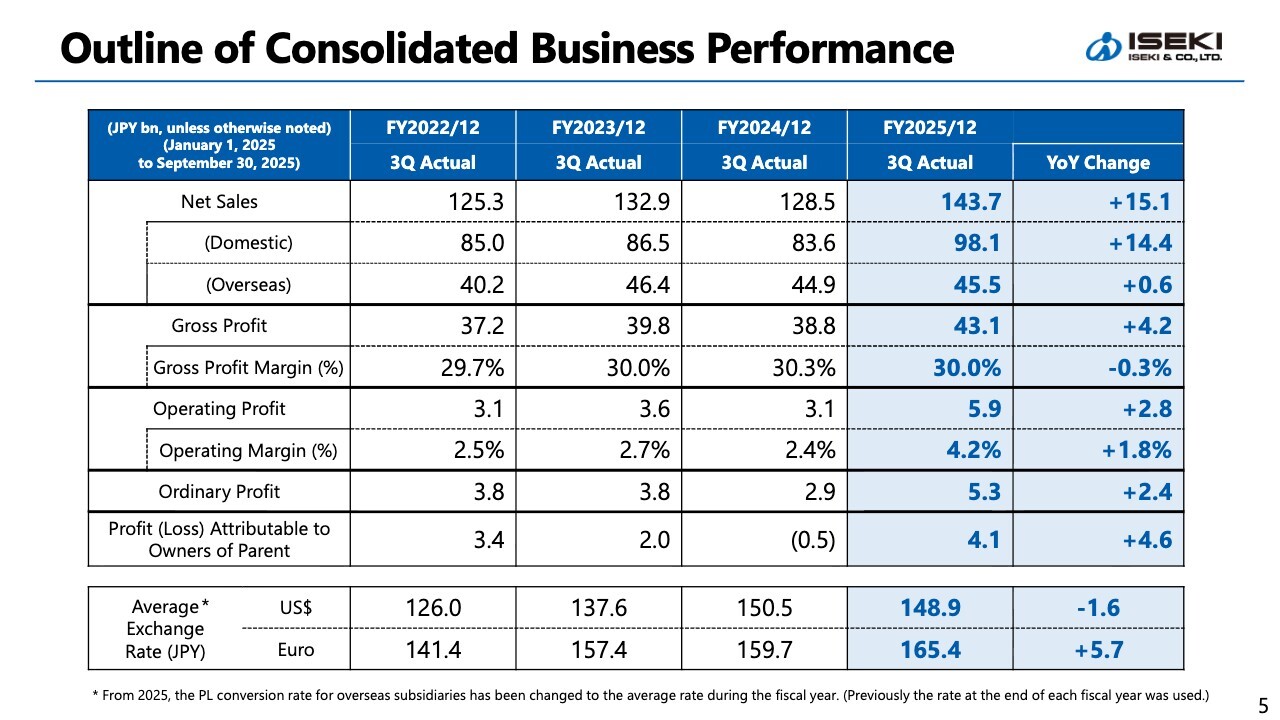
Here is an outline of the consolidated business performance. Net sales increased by ¥15.1 billion YoY to ¥143.7 billion. Of this, domestic sales grew by ¥14.4 billion, and overseas sales increased by ¥0.6 billion. On the profit side, operating profit rose by ¥2.8 billion to ¥5.9 billion, and both ordinary profit and quarterly profit attributable to owner of parent also increased YoY.
Trends in Consolidated Financial Result (Quarterly)
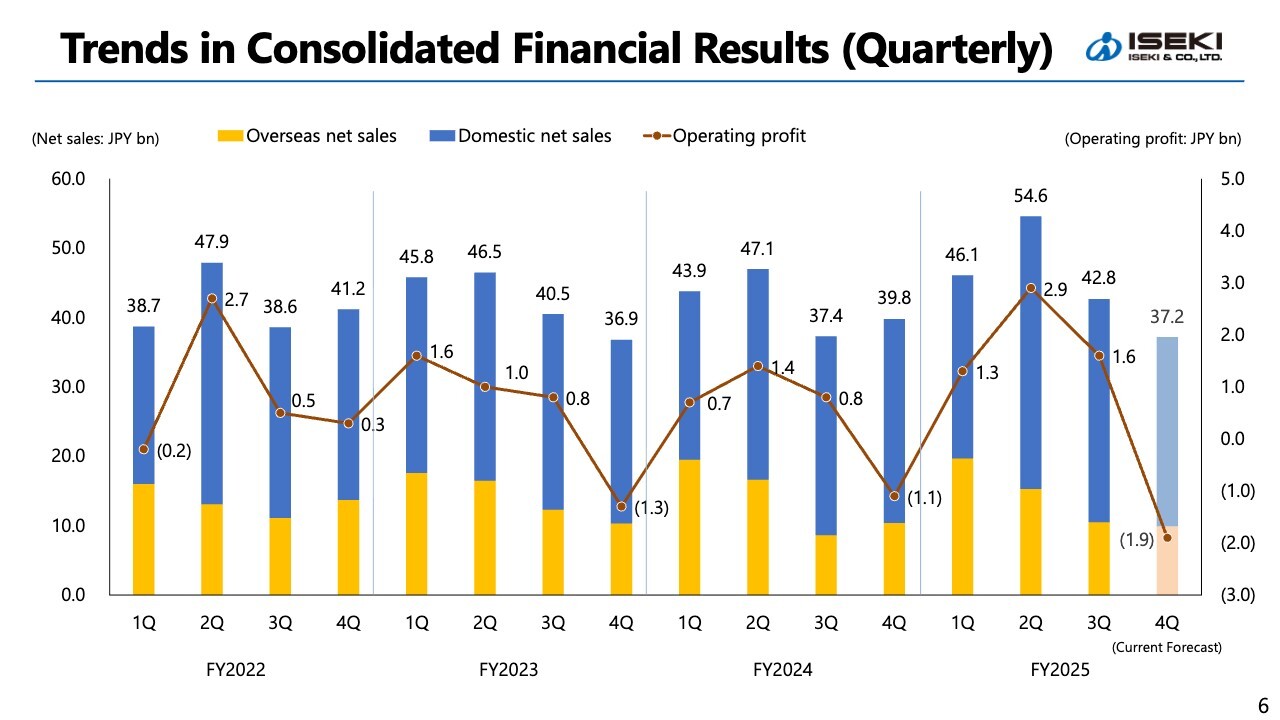
This section shows quarterly net sales and operating profit. The bar chart represents net sales, with blue indicating domestic net sales and yellow indicating overseas net sales. The line graph represents operating profit.
For 4Q of the current fiscal year, we expect an operating loss of ¥1.9 billion. Although the 4Q of FY2022 recorded a profit, it included special factors. For our company, 4Q typically falls in the off-season for agricultural machinery in Japan, which usually results in a loss.
Furthermore, although customer orders, particularly in Japan, have been progressing well, we face supply constraints for certain products, including those we manufacture and those we procure.
There are also factors that will not contribute to sales within the current fiscal year, and we have incorporated the associated risks into our forecast.
Domestic Sales
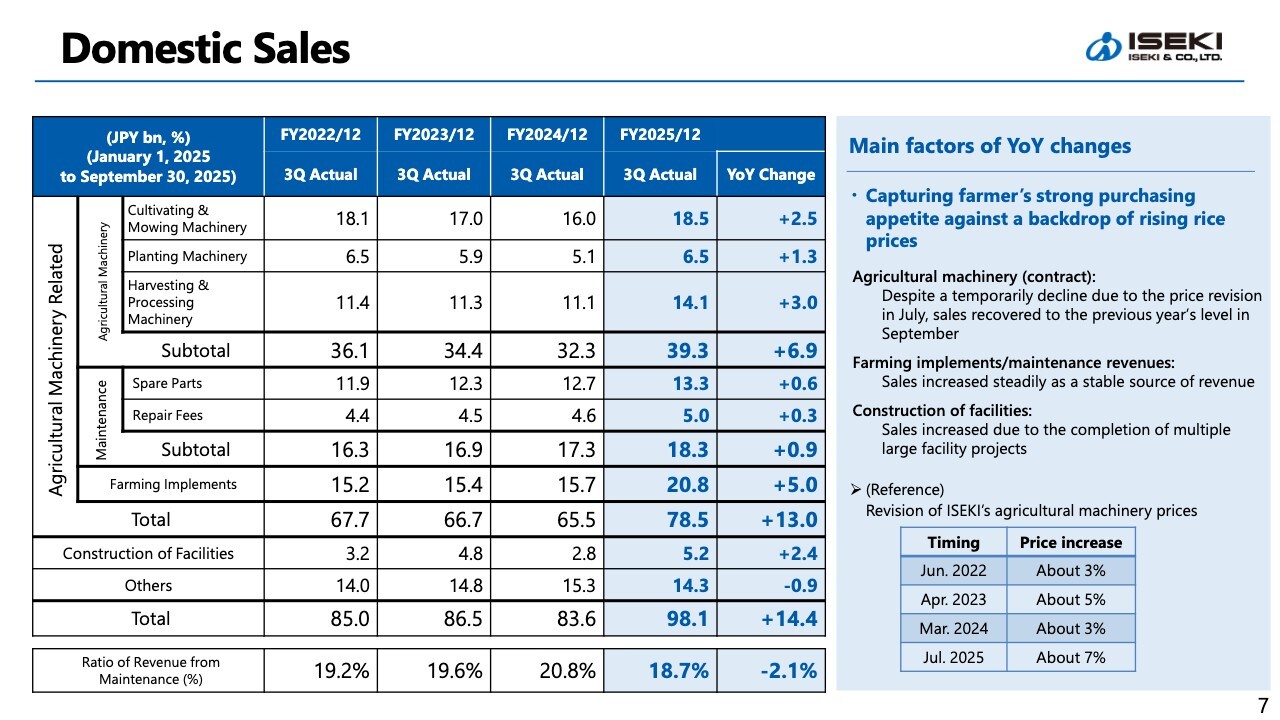
As shown in the “Total” column of the table on the slide, domestic sales increased significantly, rising by ¥ 14.4 billion YoY.
In the agricultural machinery segment, the fourth row from the top, farmers’ purchasing appetite improved thanks to the recovery and rise in rice prices, resulting in a substantial YoY increase of ¥6.9 billion.
Maintenance services also rose by ¥0.9 billion YoY, and farming implements recorded an increase of ¥5.0 billion. These segments, such as maintenance and farming implements, continue to show steady growth as stable revenue sources.
Meanwhile, in the construction of facilities, the completion of a large facility project during the period led to a YoY increase of ¥2.4 billion.
Overseas Sales
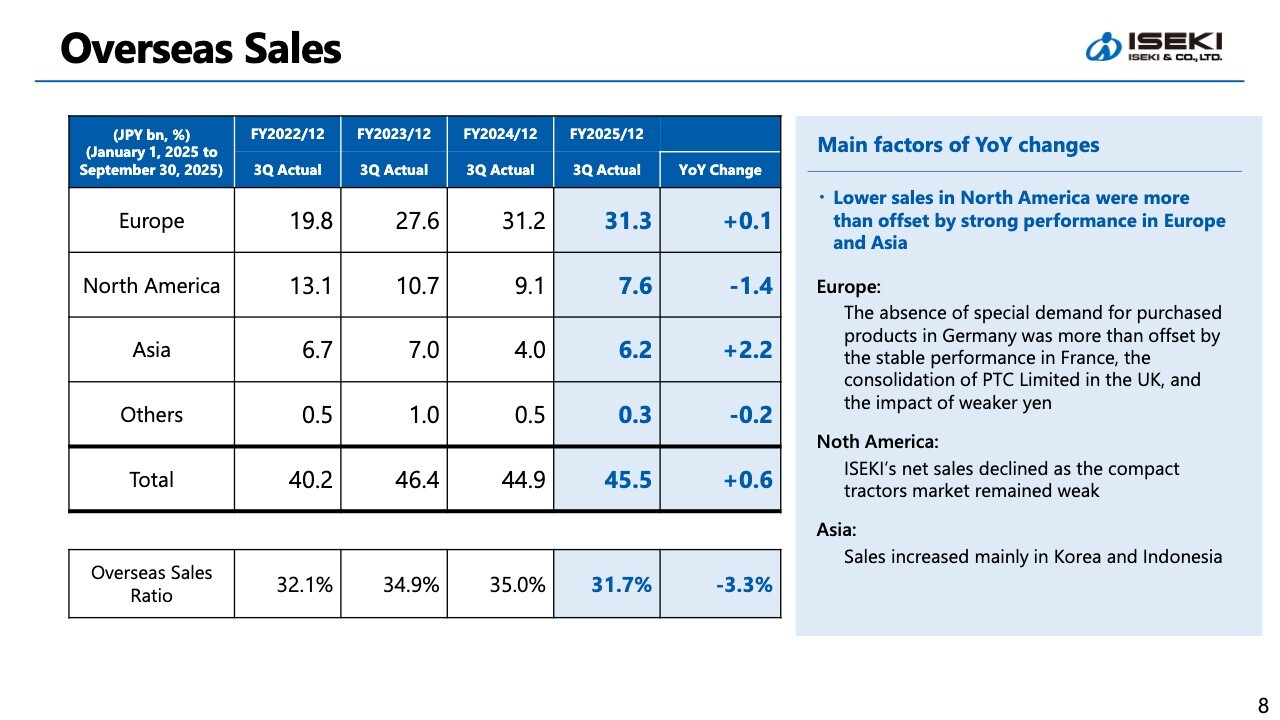
As shown in the “Total” column of the slide, overseas sales increased by ¥0.6 billion YoY. In Europe, sales remained strong in France, and results were further supported by the consolidation of UK sales subsidiary PREMIUM TURF-CARE (PTC) Limited and the impact of a weaker yen.
Last year, Germany saw special demand for purchased products, which had boosted European sales. With that demand falling away this year, sales in Germany declined significantly. Although this resulted in a decrease of just over ¥3.0 billion, we successfully offset the impact.
In North America, the compact tractors market remained weak, resulting in a ¥1.4 billion YoY decline. In contrast, Asia performed well, with South Korea and Indonesia contributing to a ¥2.2 billion YoY increase.
The overseas sales ratio, shown in the bottom row of the table, stands at 31.7%. Although it exceeded 33% at certain times in the past, this fiscal year it is 31.7% due to strong domestic performance.
Operating Profit
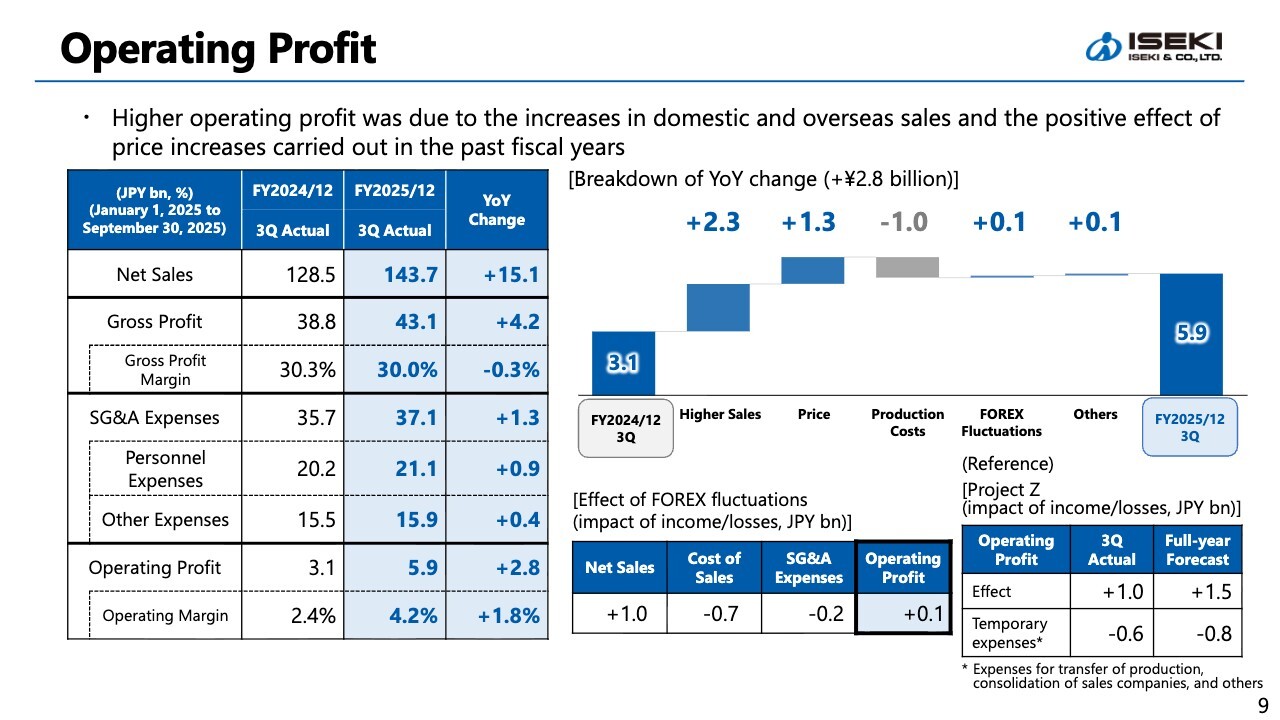
This slide shows operating profit. As illustrated in the graph on the right side of the slide, operating profit increased YoY by ¥2.3 billion due to higher gross profit from increased sales (the second bar from the left), and by an additional ¥1.3 billion due to the effect of price revisions.
On the other hand, raw material cost inflation, driven less by market commodities such as steel and copper, and more by rising labor costs at our suppliers, resulted in a negative impact of ¥1.0 billion YoY. Overall, operating profit increased by ¥2.8 billion YoY, reaching ¥5.9 billion.
As shown in the table at the lower right of the slide, the weaker yen contributed a positive impact of ¥1.0 billion to net sales and ¥0.1 billion to operating profit. The initiatives under Project Z generated effects totaling + ¥1.0 billion over the nine months from January to September 2025.
Conversely, one-off expenses, primarily costs associated with the integration of a distribution subsidiary, resulted in a negative impact of ¥0.6 billion. All items are progressing in line with our plan.
Ordinary Profit & Profit
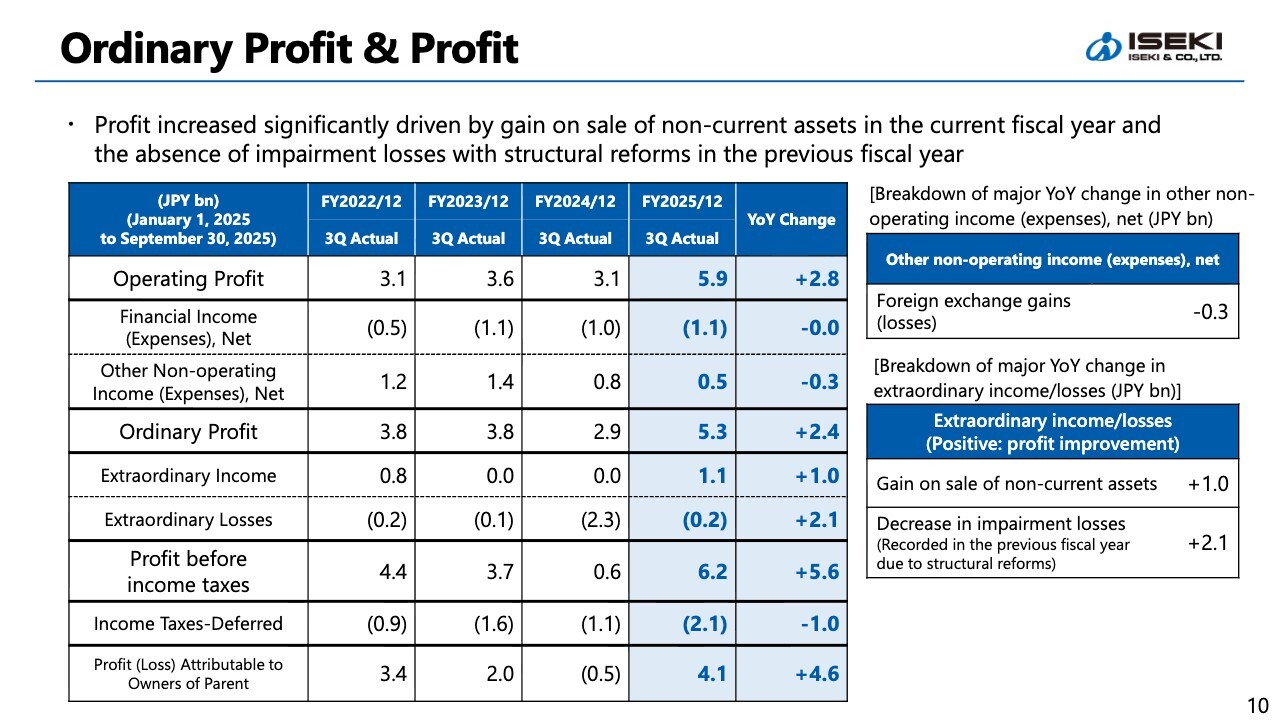
Let me now explain the items below ordinary profit. Ordinary profit saw a lower YoY increase than operating profit, mainly due to a decline of roughly ¥0.3 billion in foreign exchange gains (losses) as shown on the right side of the slide.
Meanwhile, quarterly profit attributable to owner of parent increased significantly, rising by ¥4.6 billion YoY to ¥4.1 billion. This growth reflects gains on sale of non-current assets recorded this fiscal year, as well as the absence of impairment losses associated with last year's structural reforms.
Balance Sheet
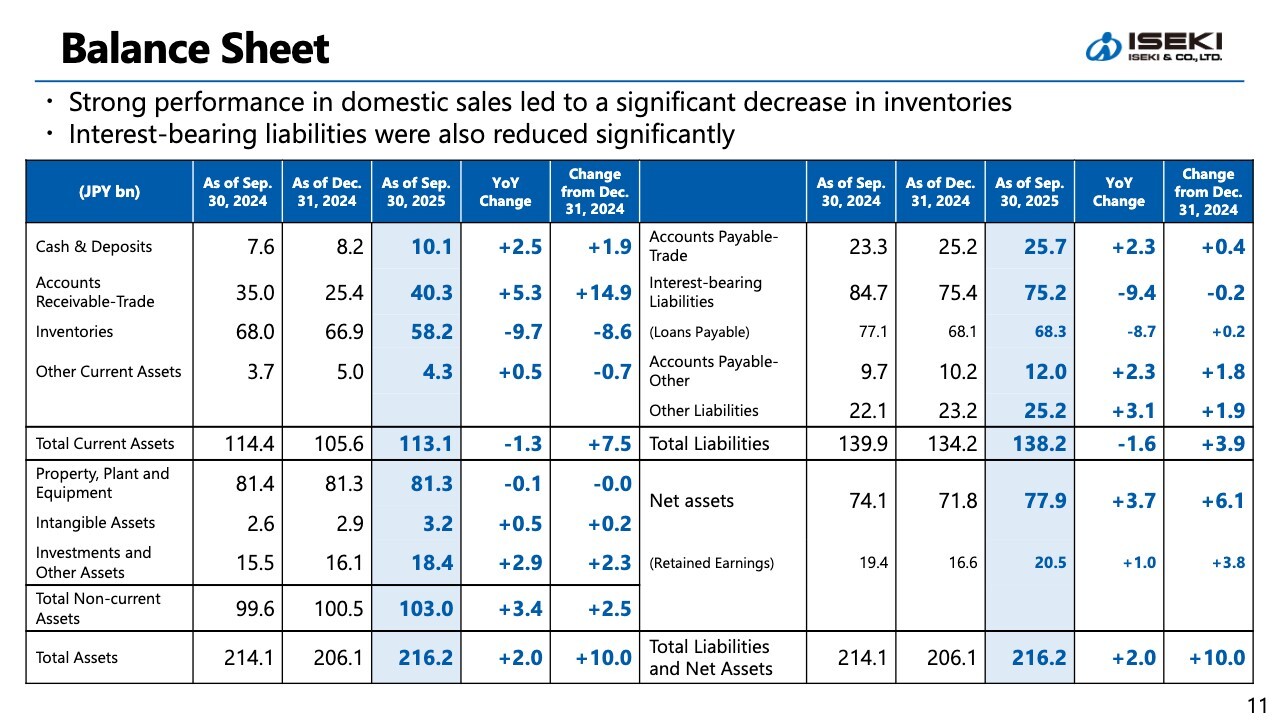
Turning to the balance sheet, total assets increased by ¥2.0 billion YoY to ¥216.2 billion.
Regarding inventories, which we recognize as one of our most critical issues, we achieved a significant reduction of ¥9.7 billion YoY, supported by strong domestic sales. This reduction includes increases associated with the consolidation of certain overseas subsidiaries.
Interest-bearing liabilities decreased by ¥9.4 billion YoY. Both the reduction in inventories and the reduction in interest-bearing liabilities are progressing ahead of the assumptions made at the beginning of the fiscal year.
Equity Ratio / Interest-bearing Liabilities
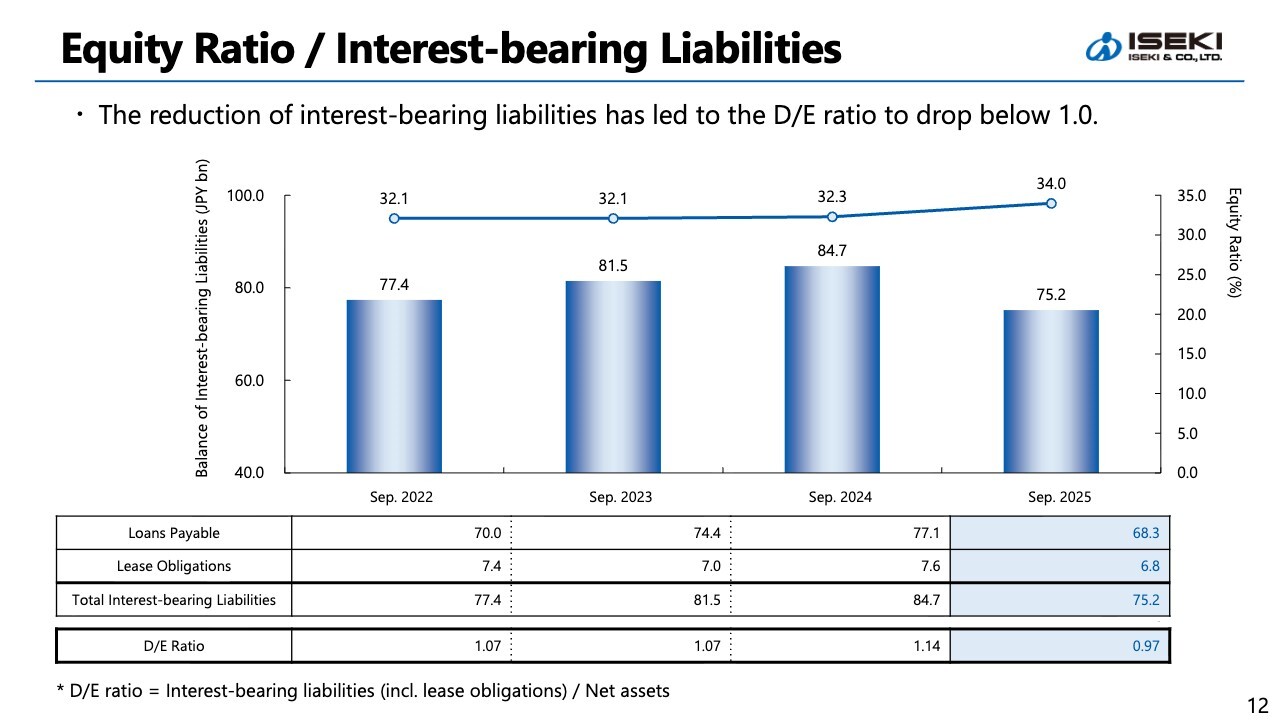
This slide shows the trends in the equity ratio and interest-bearing liabilities during 3Q.
Interest-bearing liabilities continued to decline as inventories were reduced, as mentioned earlier in the balance sheet section. As a result, the D/E ratio dropped to 0.97, just below 1.0. The equity ratio stands at 34%, still at a low level, although it has improved somewhat.
Toward the fiscal year-end in December, we expect further collection of accounts receivable, which should enable additional reductions in interest-bearing liabilities.
Cash Flows
Let me now turn to cash flow.
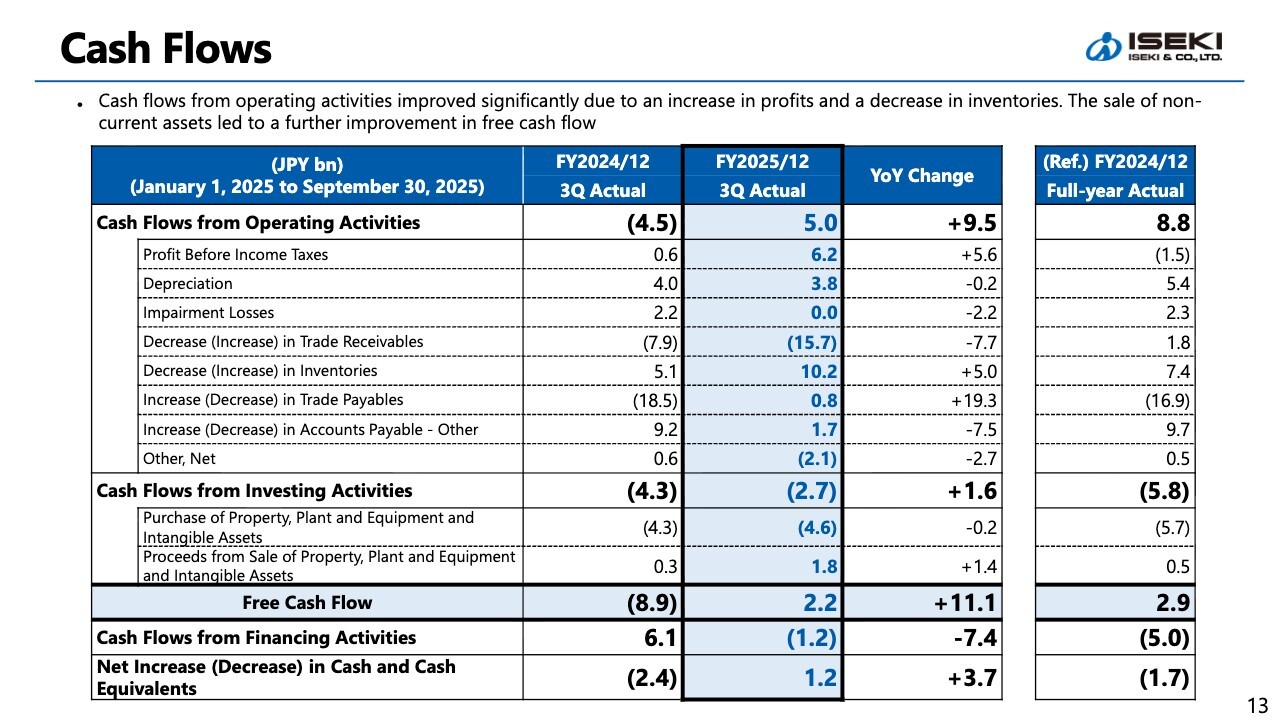
Driven by higher profit and reduced inventories, cash flows from operating activities returned to positive territory. As I mentioned earlier, we expect further collection of accounts receivable in 4Q. For the full fiscal year, we anticipate continued improvement in cash flows from operating activities.
With respect to cash flows from investing activities, we continued to execute capital expenditures under Project Z during this period. Despite these investments, free cash flow remained positive for the second consecutive quarter, following the positive result in 2Q.
Progress of Project Z
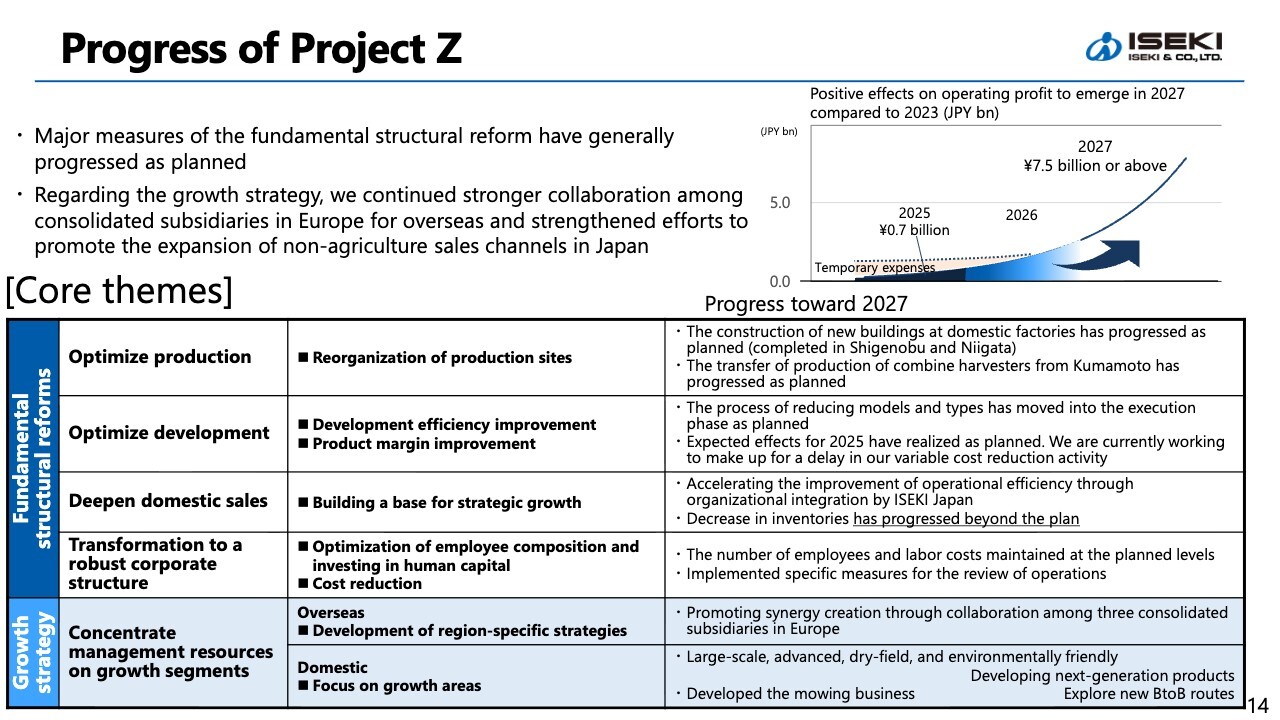
Here is an update on the progress of Project Z. Key initiatives, including the reorganization of production sites and the integration of our distribution subsidiary, both core elements of our fundamental structural reforms, are generally progressing as planned.
As noted earlier, we achieved inventory reductions ahead of plan, driven by the growth in domestic sales.
Regarding “Optimize development,” which involves a fundamental review of our design methodologies from the ground up, we are seeing benefits in the current fiscal year as planned. However, some activities aimed at reducing variable costs, which will contribute from next fiscal year onward, are experiencing some delays. We are taking focused actions to make up for this delay.
Alongside these fundamental structural reforms, we are also advancing our growth strategies. Overseas, we are strengthening collaboration among our consolidated subsidiaries in Europe to create synergies.
In Japan, we are developing new products for growth markets and have launched a new mowing business. We have begun preparing to introduce in Japan the ride-on mowers, which enjoy strong brand recognition in Europe.
Domestic Market Trends
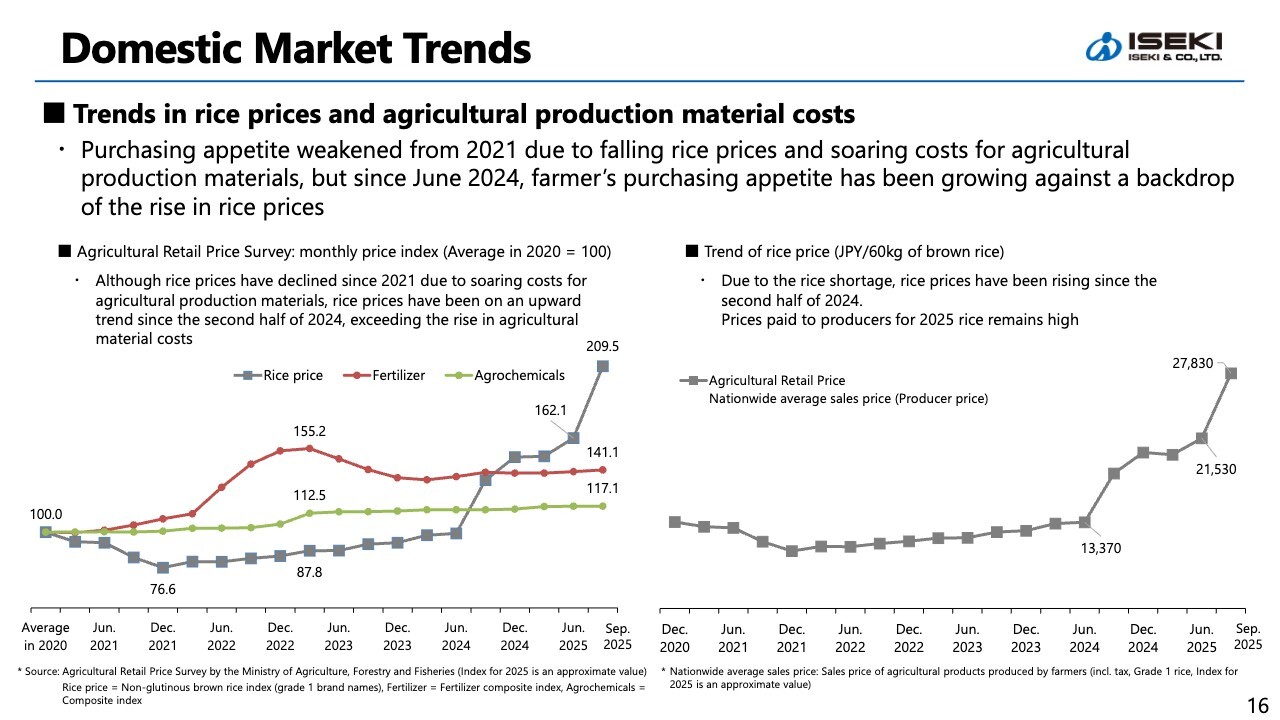
Let me now discuss domestic market trends. First, I will touch on rice prices, which many of you are following closely. The line graph on the left shows the price index for rice, fertilizer, and agrochemicals, with 2020 set at 100.0.
In 2021, rice prices declined due to reduced inbound demand during COVID-19 and weak performance in the restaurant industry. At the same time, the weaker yen drove up the prices of agricultural production materials such as fertilizer, agrochemicals, feed, and greenhouse film.
As a result, farmers faced difficult conditions, and naturally, their purchasing appetite for machinery also declined.
Since June of last year, however, rice prices have recovered, leading to a rebound and strengthening in farmers’ purchasing appetite. The graph on the right shows the trend of rice price. Producer prices remain high for the 2025 harvest, with provisional prices staying elevated across regions.
Domestic Market Trends
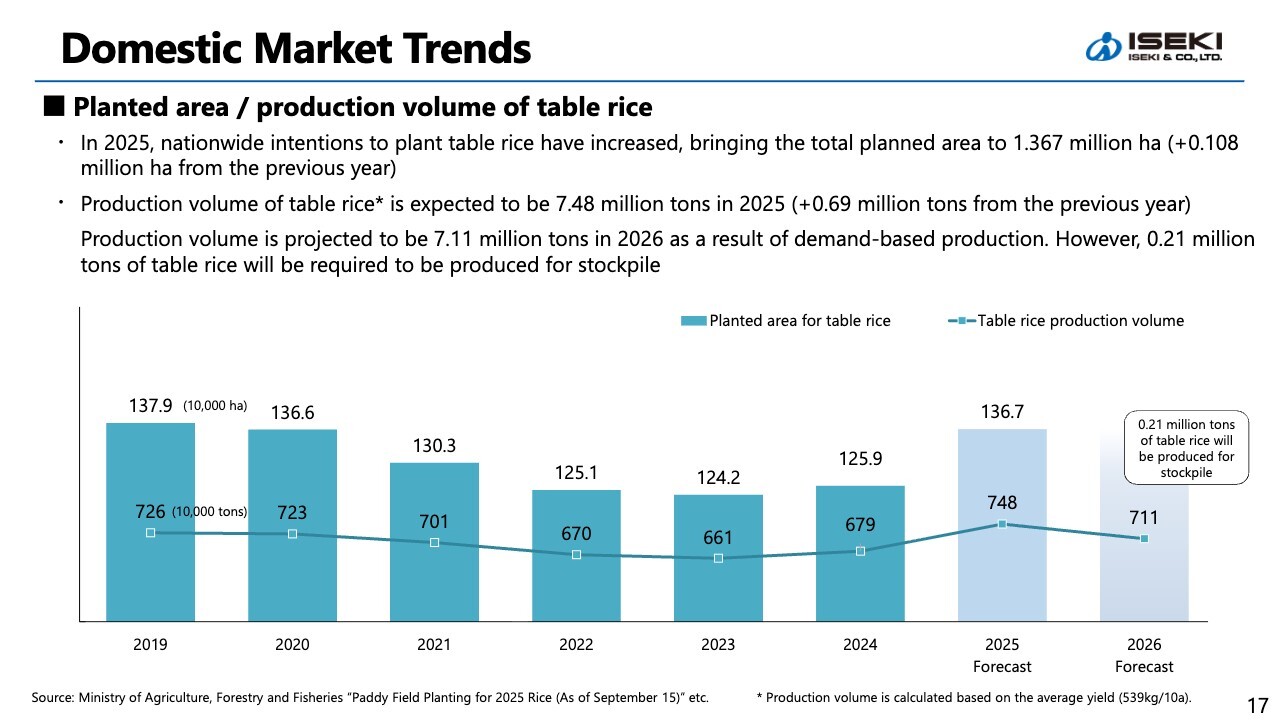
The bar graph shows the planted area for table rice, while the line graph indicates table rice production volume. For 2025, the planted area for table rice is expected to increase nationwide to approximately 1.37 million hectares. Production volume is forecast to rise by 0.69 million tons YoY, reaching 7.48 million tons.
For 2026, supply is expected to be adjusted to match demand, including inventory held by private companies, resulting in an estimated 7.11 million tons. Separately, the government plans to purchase around 0.21 million tons of rice for the stockpile. This amount should be considered outside the figures shown on the chart.
Market Trends and Status of ISEKI (Japan, Europe)
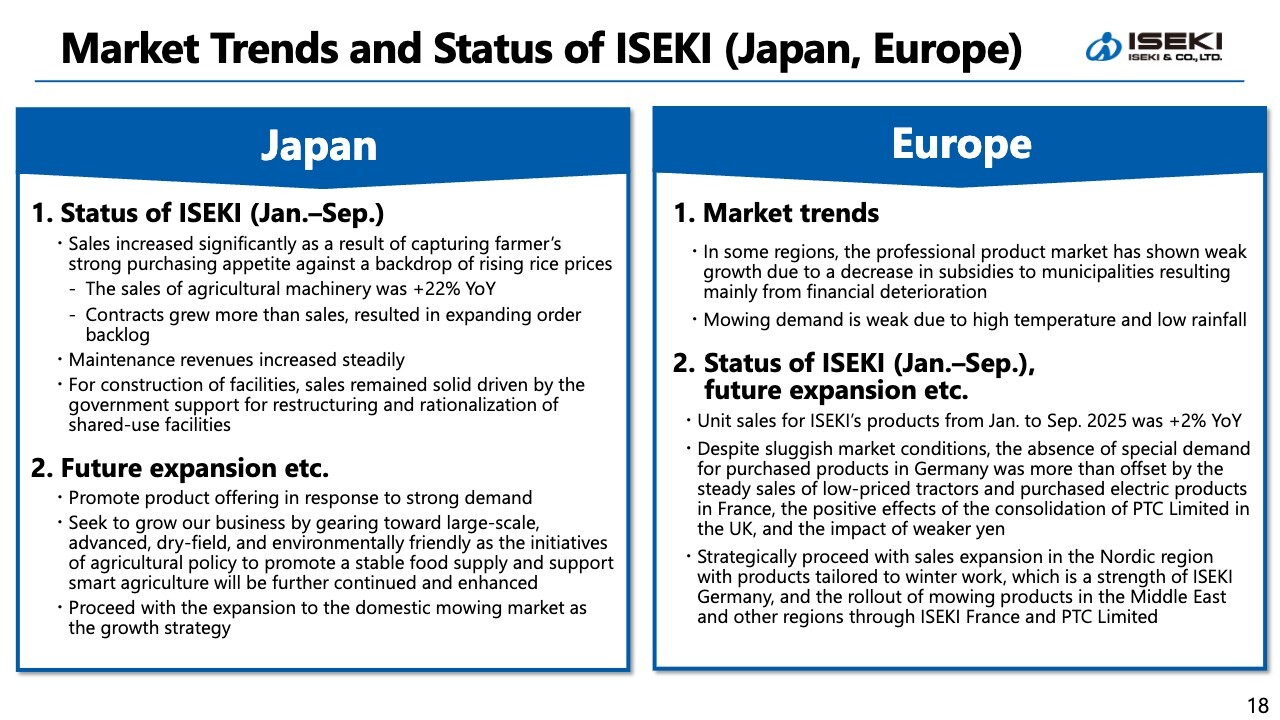
Turning to our performance in Japan, sales of our agricultural machinery from January to September increased 22% YoY, resulting in significant sales growth as we captured the recovery in farmers’ purchasing appetite. Contracts grew more than sales, resulted in expanding order backlog.
Going forward, we will continue to supply products in response to robust demand, while strengthening our initiatives in growth markets, specifically in the large-scale, advanced, dry field, and environmentally friendly areas, supported by agricultural policy.
In addition, we will proceed with the domestic rollout of the “Mower” ride-on mowing machines that have earned strong recognition in Europe.
In Europe, the market remained soft due to a decrease in subsidies in some regions and the impact of weather conditions. However, the absence of special demand for procured products in Germany was more than offset by the steady sales in France leveraging our brand strength, the positive effects of the consolidation of PTC Limited in the UK, and the impact of weaker yen.
Going forward, we will proceed with sales expansion in the Nordic region with products tailored to winter work, which is a strength of ISEKI Germany, and the rollout of mowing products in the Middle East through ISEKI France and PTC Limited.
Market Trends and Status of ISEKI (North America, Asia)
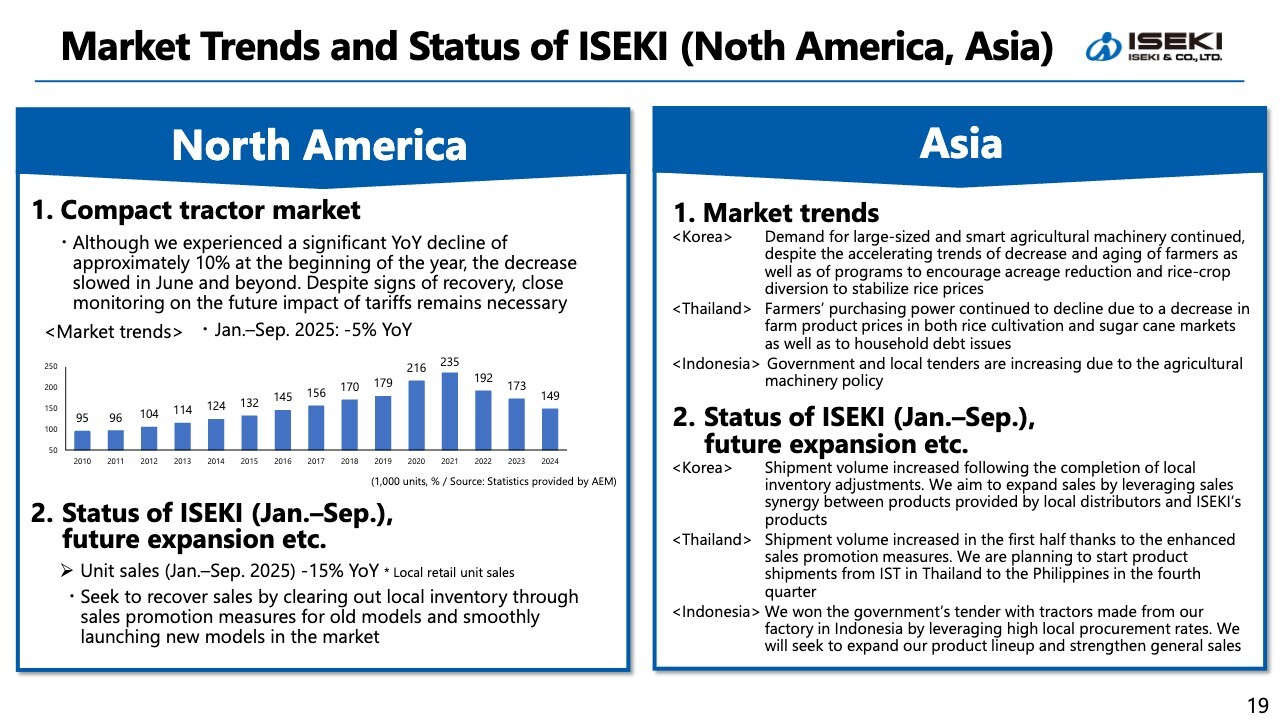
Next, North America. In the market for compact tractors of 40 horsepower or below, our main supply category, demand from January to September declined 5% YoY.
Unit sales in the region decreased 15% YoY. We seek to recover sales by clearing out older inventory and launching new products.
In Asia, shipments increased in South Korea as local inventory adjustments were completed. We will aim to expand sales by leveraging synergies between the products handled by local distributors and our own products.
The business environment in Thailand remains challenging. At our local subsidiary IST Farm Machinery Co., Ltd., promotional campaigns for tractors helped increase unit sales.
From 4Q, we plan to begin shipments to the Philippines as part of a new regional expansion initiative. In Indonesia, government and municipal tenders are increasing as part of agricultural mechanization policies, and we are strengthening initiatives to capture these orders and grow sales.
Forecast of Consolidated Financial Results for the Fiscal Year Ending December 31, 2025
This section covers the full-year consolidated earnings forecast. Backed by a recovery and rise in domestic rice prices, which boosted purchasing appetite among farmers, cumulative net sales for the first nine months of the current fiscal year increased significantly.
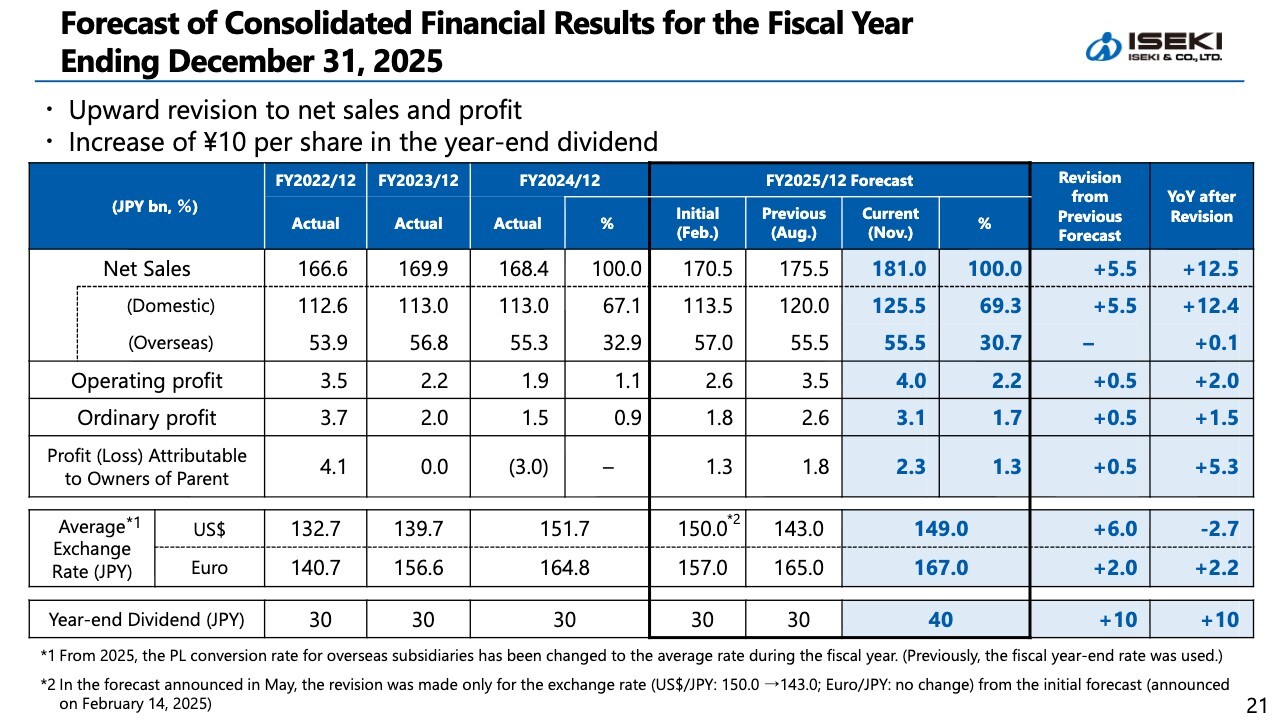
As a result, both net sales and profit are now expected to exceed the previous forecast announced in August, prompting us to revise the outlook upward once again.
Net sales in Japan are expected to reach ¥125.5 billion, an increase of ¥5.5 billion from the previous forecast, while the overseas forecast remains unchanged. Total consolidated net sales are now expected to be ¥181.0 billion, the highest level since consolidation.
Operating profit is now projected to be ¥4.0 billion, up ¥0.5 billion from the prior forecast. Profit attributable to owner of parent is also expected to rise ¥0.5 billion to ¥2.3 billion. The dividend forecast has been raised by ¥10 to ¥40 per share.
Forecast of Consolidated Financial Results for the Fiscal Year Ending December 31, 2025
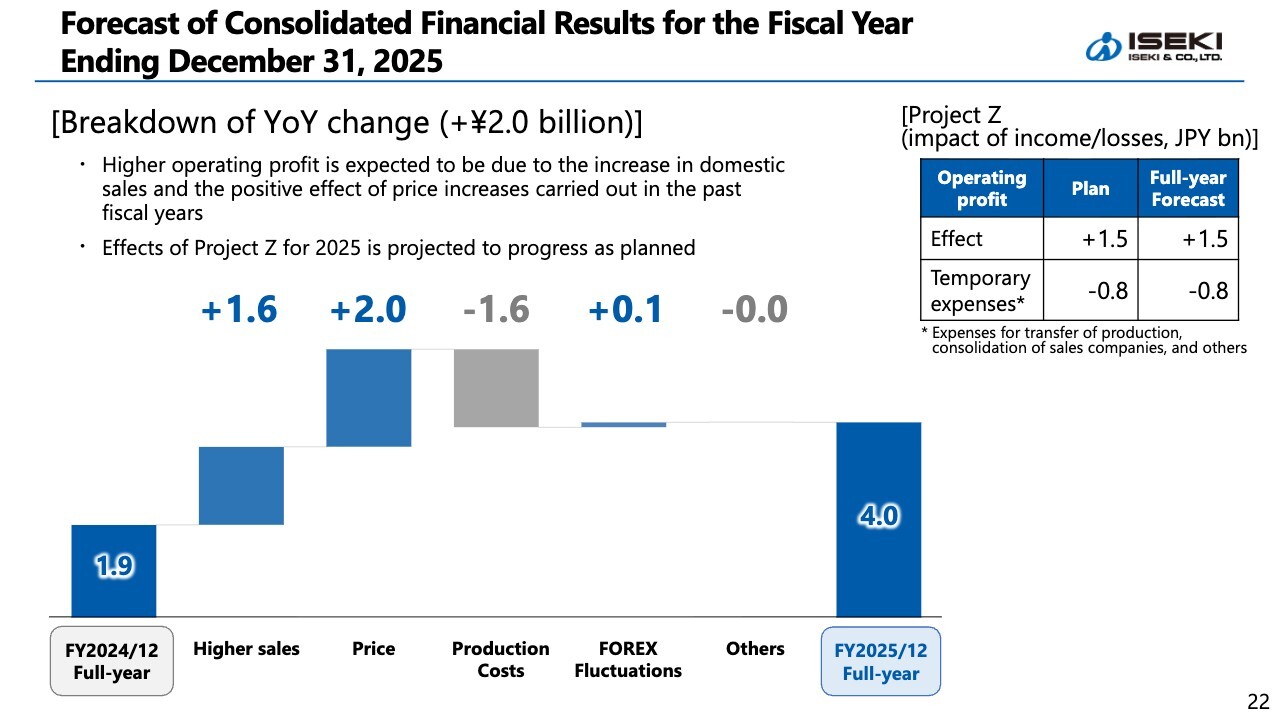
Let me explain the key factors behind the YoY change in operating profit. The second bar from the left in the chart shows that higher sales contributed ¥1.6 billion to gross profit, and price revision effects added another ¥2.0 billion.
Meanwhile, soaring raw material prices are expected to have a negative impact of ¥1.6 billion. On a net basis, operating profit is expected to increase by ¥2.0 billion YoY, reaching ¥4.0 billion in total.
Finally, the measures under Project Z, shown in the upper-right corner of the slide, are expected to deliver benefits as planned.
Topics: Notice of New Product Launch Event
We would like to highlight two topics.
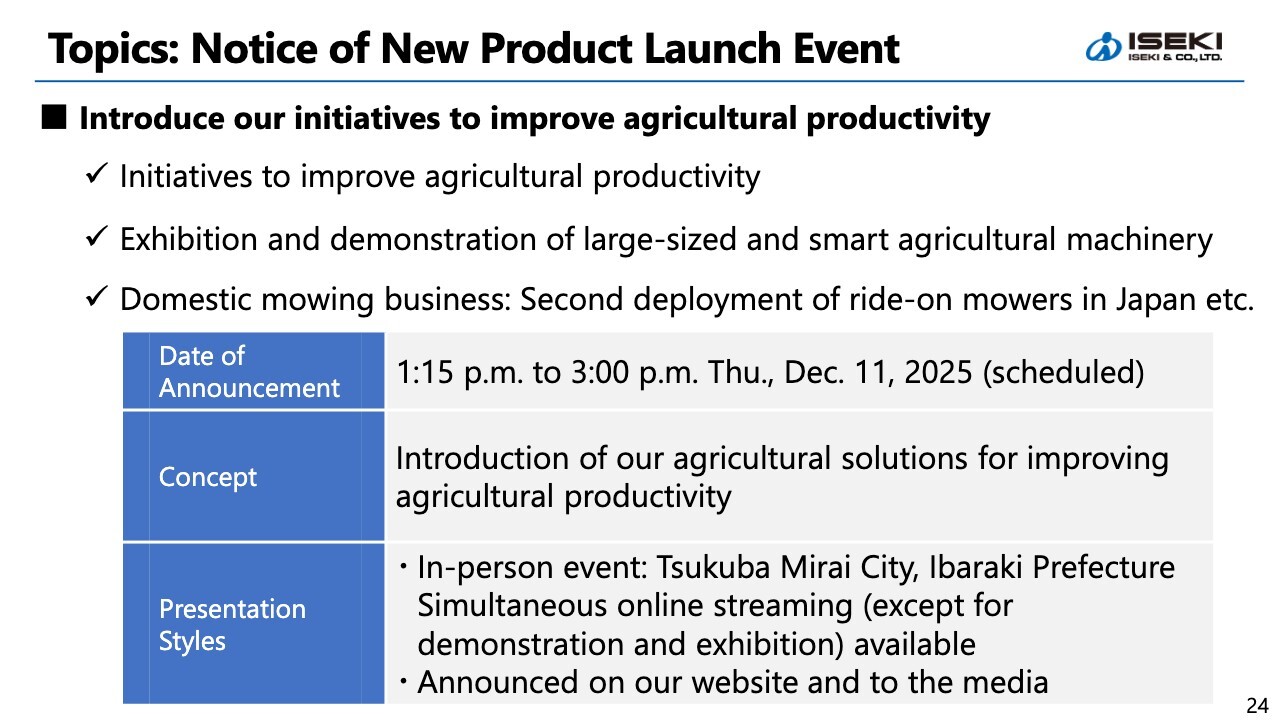
The first relates to the new product launch event scheduled for next month. At our Tsukubamirai facility, we will present our initiatives aimed at enhancing agricultural productivity.
The event will also be streamed live via Zoom. However, demonstrations and exhibits will only be available on-site, so we would be delighted if you could attend in person. We will send you a formal invitation separately and sincerely hope you will join us.
Topics: Strengthening of IR Activities
The second topic concerns our ongoing efforts to strengthen IR activities.
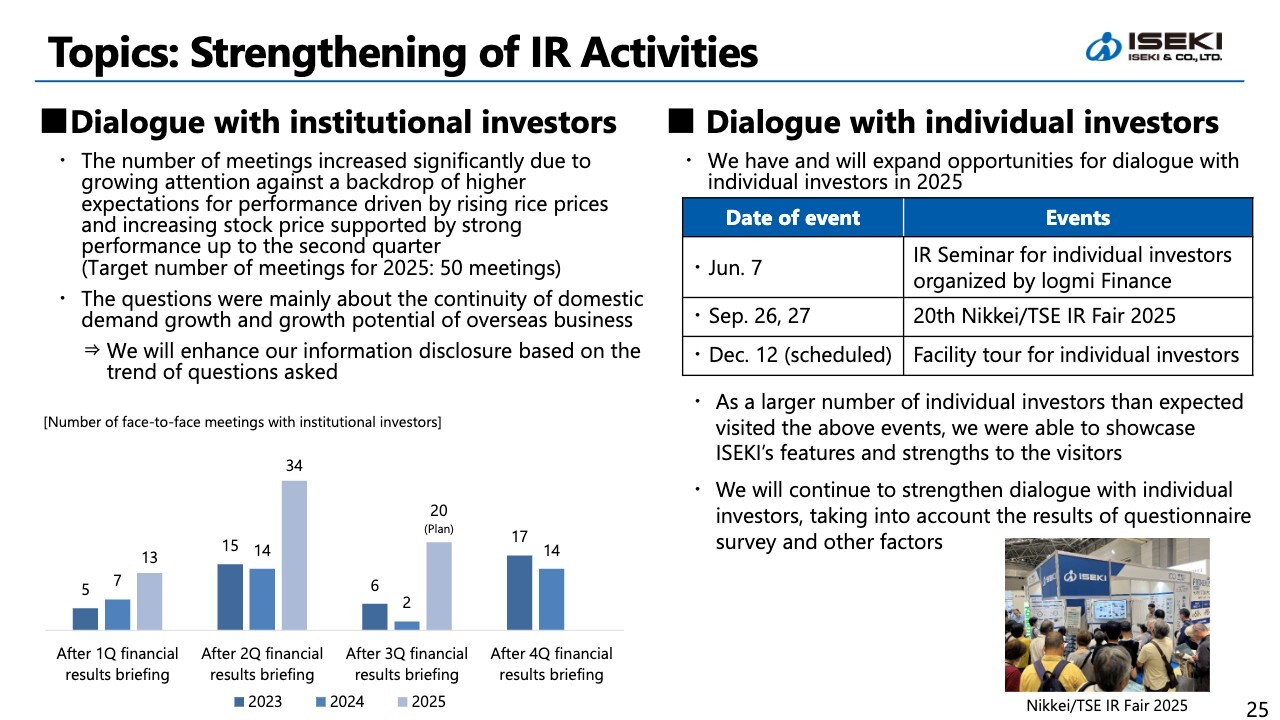
Driven by expectations for earnings improvement due to the recovery and rise in rice prices, as well as our actual strong business performance, the number of meetings with institutional investors has been steadily increasing. Going forward, we will continue enhancing our disclosures by analyzing the trends in questions raised during these meetings.
We are also expanding our engagement with individual investors. Attendance at various events has far exceeded our expectations, and we believe these opportunities have helped us showcase ISEKI’s features and strengths to the visitors.
We intend to leverage the comments and survey responses we have received to further improve our IR activities.
That concludes our presentation. Thank you for your attention.
Q&A: Factors Behind the Share Price Decline and Appropriate Share Price Levels
Moderator: We have questions: “Your share price declined significantly despite the upward revision and the dividend increase. What do you believe drove this? Furthermore, based on the company’s growth potential and earnings capability, what level do you consider appropriate for your share price? Lastly, what equity story do you envision to achieve that valuation?”
Tomiyasu: Regarding the drop in our share price in the 30 minutes between our 3 p.m. announcement and market close, I would actually like to ask all of you what you believe caused it.
Perhaps expectations were higher than we understood, or perhaps it was the result of what is commonly referred to as algorithmic trading in the current market environment. We intend to analyze this on our own as well.
We would appreciate your continued views on this matter. As for what the appropriate share price level should be, given our growth potential and earnings capability, it is difficult for me to state a specific figure. However, we do believe that a PBR of 1x is a natural benchmark.
I have long believed that our current share price level undervalues the company. At the same time, the recent rebound in our share price has been, in a sense, quite rapid.
As mentioned earlier, some of this may be a reactionary adjustment, but I also believe that the rapid recovery reflects an assessment of our capabilities and the improvement in our recent performance.
If the recent rise in our share price has been driven solely by the rise in rice prices, then we would like our own efforts and achievements to be properly recognized as well, and for that to be reflected in our valuation.
This may not fully answer the question, but we remain committed to successfully completing Project Z and ensuring a solid recovery in our share price.
By managing the company appropriately, we expect to further improve our equity ratio, which in turn could raise the level implied by a PBR of 1x. We will continue working toward that target.
Q&A: Production Status and 4Q Sales Outlook
Moderator: We have a question: “If production is unable to keep up, does that mean you are currently operating at full capacity? Even so, will 4Q net sales decline YoY?”
Tomiyasu: In response to whether we are operating at full capacity—yes, in a sense, we are. As you know, combine harvester production in Kumamoto will end in December 2025. With that in mind, we are building inventory for certain products.
Production of combines will shift from Kumamoto to Matsuyama next year. However, the production ramp-up in Matsuyama will involve some timing differences, and we are preparing inventory accordingly.
We are also facing a shortage of personnel. We are operating at maximum output while addressing constraints of the workforce and equipment capacity.
Regarding whether 4Q revenue will decline, nearly 70% of our sales are still generated in Japan. After the rice harvest ends, revenue tends to taper off naturally. This is the context behind the outlook.
Additionally, we still have outstanding backlogged orders for which delivery has not yet been completed. While we intend to maximize production in 4Q and convert as many of those orders into sales as possible, we expect it will still be difficult to reach profitability for the quarter.
Having a backlog itself is a strength, and we aim to continue production steadily and convert those orders into sales.
Q&A: Response to Market Demand
Moderator: We have questions: “You mentioned that demand has exceeded your capacity to supply. How long is the current lead time? And even with such strong demand, will sales still not materialize in 4Q?”
Tomiyasu: To explain the situation at our domestic distribution subsidiary, I would like to ask Mr. Ishimoto, who oversees domestic sales, to comment. I believe one key point is the approximate number of months required for delivery.
Noriaki Ishimoto: I am Ishimoto, General Division Manager of the domestic Business Division. In the Business Division, our priority is to propose and deliver the right products that meet customer demand. As a first step, we are addressing demand by selling available inventory.
Actual lead times vary depending on the product. Some cases may take around three months, while others may take up to six months. During this period, we continue our sales activities while asking our customers to wait until production is completed.
As Mr. Tomiyasu mentioned, order backlogs have expanded significantly. We are continuing to make deliveries as appropriate while working through these backlogs.
Q&A: Demand Trends for New Rice and Farmers’ Investment Appetite
Moderator: We have a question: “Some newspaper articles suggest that new rice is selling poorly and that rice prices may fall. What is your view on farmers’ willingness to invest in equipment?”
Tomiyasu: I am aware of those articles, but I personally do not sense that rice prices are declining. For this year’s harvest, organizations such as JA are purchasing rice at prices higher than last year.
Given that 2025-harvest rice is priced higher than the 2024 crop, consumers may face a choice.
That said, new rice is naturally of higher quality, and there is solid demand for it, so I am not concerned about a slowdown in new rice sales. Accordingly, we believe farmers’ investment appetite remains strong.
As an additional note, our domestic distributors implemented a price revision in July 2025.
Normally, price revisions lead to a temporary decline in demand as customers front-load purchases ahead of the change. However, this time, demand has more than offset the impact of the price increase, demonstrating a strong recovery in buying interest.
Moreover, JA and rice wholesalers are purchasing rice from farmers at prices higher than last year.
Based on these conditions, we believe farmers’ appetite for capital investment will remain solid.
Q&A: Expected Impact of Project Z in the Next Fiscal Year
Moderator: We have a question: “How much impact do you expect from Project Z in the next fiscal year?”
Tomiyasu: Since this concerns the next fiscal year, I will refrain from giving specific figures. The “Optimize production” component of Project Z is investment-heavy, with a total of ¥38 billion planned for production-related investment.
The effects will emerge gradually, and in the early stages, depreciation will outweigh efficiency gains, meaning the benefits will not be substantial at first.
The most significant impact is expected from “Optimize development” and “Deepen domestic sales.”
For “Optimize development,” we are redesigning products from the ground up. While the benefits in FY2025 will be modest, we expect clear improvement next fiscal year.
For “Deepen domestic sales,” the integration of our distribution subsidiary has improved operational efficiency, not only in personnel but also in logistics and inventory. Inventory levels have already been significantly reduced this fiscal year, and we will continue to pursue further efficiencies.
In addition, the Large-scale Planning Section will spearhead the sales expansion of large-scale and advanced machinery, which ties into our growth strategy.
For the current fiscal year, Project Z will contribute approximately ¥1.5 billion, while one-time costs of ¥0.8 billion are expected. These include costs related to the merger of our distribution subsidiary, ISEKI Japan, and expenses associated with transferring production from Matsuyama to Kumamoto.
These costs will not recur next fiscal year. This is also reflected in the graph on the slide. Overall, we are confident that the effects of Project Z will materialize as planned.
Our earnings forecast for the next fiscal year will be announced in February, at which time we will provide further details.
Q&A: Expected Growth Drivers and Potential Risks for 2026
Moderator: We have a question: “Could you cite two to three key drivers expected to support earnings in 2026, as well as any potential risk factors we should be aware of?” Tomiyasu: Domestically, we expect contributions from the strategic areas we have identified: large-scale, advanced, dry field, and environmentally friendly. The Large-scale Planning Section established within ISEKI Japan serves the role of overseeing the domestic business from a broad, company-wide perspective.
Various initiatives are already underway, and we have strong expectations for their contribution.
In the BtoB segment, we are expanding the provision of large-scale machinery to corporate customers. Furthermore, we plan to introduce riding mowers, highly regarded in Europe, into the domestic market. While these areas may not generate large revenue figures immediately, we are seeing clear signs of traction.
We also believe there is room for strong expectations regarding various machines such as the Aigamo-Robo, as well as drones that have advanced further this fiscal year. These are the products developed under our strategic areas: “large-scale, advanced, dry field, and environmentally friendly.”
Overseas, growth was less visible this year due to the absence of last year’s one-off demand in some product categories. However, we anticipate that collaboration among our three consolidated subsidiaries in France, Germany, and the UK will further expand both geographic and product coverage.
As for potential risk factors, judging from the current momentum in the domestic market, we believe we are likely to get off to a solid start.
In North America, however, several challenges may emerge. Although we previously noted that the impact of the so-called “Trump Tariffs” would be limited this year, we expect some degree of impact next fiscal year.
We intend to address and mitigate these risks as we advance our initiatives.
Q&A: Price Increase Trend and Future Outlook
Moderator: We have a question: “What is your view on future product price increases?”
Tomiyasu: At this point, we do not have a concrete answer regarding additional product price increases. As mentioned earlier, we implemented a price revision in Japan this July. It is still difficult to clearly explain how much of a tangible impact this revision has produced.
From 2022 to 2024, we raised prices by 3%, 5%, and 3%, respectively, more than 10% in total. We believe that the current positive impact reflects these revisions over the past three years.
The 7% price increase implemented domestically this July was considerably larger than previous revisions, and we believe its impact has begun to emerge gradually.
Since most orders received up until June are still being delivered at the previous price level, the benefit from the July revision will only materialize after these orders are cleared. Personally, I expect the earnings contribution to become significant next fiscal year.
As we discussed earlier, this will likely be one of the favorable factors for next year.
As for additional price increases, as I stated at the beginning, our stance remains undecided. At the same time, the broader trend, both in government policy and across society, is to raise wages to keep pace with rising prices.
For example, while we are seeing positive effects from price revisions this fiscal year, we are also experiencing negative impacts from soaring raw material prices. As shown on the slide, the benefit from price revisions amounts to ¥1.3 billion, while the impact of higher raw material procurement costs is minus ¥1.0 billion.
Although market prices for steel and copper appear to be stabilizing somewhat, procurement costs continue to rise due to higher labor costs at our suppliers and subcontractors.
Taking such factors into consideration, we will continue to closely monitor the situation before determining any future price increase.
Again, we remain optimistic about the impact of this year’s price revisions.
At the same time, we expect rising labor costs at suppliers to affect our procurement prices. We will make decisions based on these developments, while also considering broader market conditions, of course.
The same applies to overseas markets, although the situation varies significantly by region. Europe, for example, is an environment where raising prices is relatively easier, and this serves as a positive factor for us.
Q&A: Sales Composition for 2H FY12/2025
Moderator: We have a question: “If the price increase will contribute mainly from next fiscal year, does this mean that most of the sales for 2H FY12/2025 will come from clearing orders received by June?”
Tomiyasu: We believe a certain portion of the impact from this fiscal year’s price revision is already reflected in our current fiscal-year sales.
As of the end of June 2025, we had approximately two months’ worth of undelivered orders, what we call “pending orders.” This means we have coverage for roughly half a year.
As we work through these orders, we expect the impact to start showing from 4Q. In terms of the full-year contribution, however, the effect will be larger next fiscal year, which is the point I mentioned earlier.
Q&A: Outlook for Operating Profit in 4Q
Moderator: We have a question: “If the price increase will contribute from 4Q, why do you expect a larger operating loss in 4Q?”
Tomiyasu: As our business is primarily domestic, demand tends to soften before rice transplanters begin selling and after the harvest season for combine harvesters ends, that is, in January, February, November, and December. As a result, in our December fiscal year-end, it was common for us to post losses from 1Q.
However, our overseas ratio has increased in recent years. Sales are recorded from 1Q in Europe, which has enabled us to generate operating profit in 1Q. Nevertheless, the seasonal trend in 4Q has remained unchanged.
Against this backdrop, what does this mean for this year? As mentioned earlier, the European market also experiences a drop in demand in 4Q, similar to Japan.
In addition, domestic demand is expected to decline YoY. Combined with higher raw material costs, we may fall below last year’s 4Q result of minus ¥1.1 billion, as shown in the slide.
That said, we consider this the baseline case, and we aim to narrow the deficit as much as possible. Domestic demand remains robust, and we will do our utmost to reduce the loss.
Closing Remarks from Mr. Tomiyasu
Tomiyasu: Thank you very much for taking the time to join us today and for sharing your valuable opinions and questions.
The overarching theme of Project Z is structural reform. As I mentioned earlier regarding the quarterly earnings pattern, we believe that several aspects still need to be reassessed and refined.
By expanding our overseas business, we are beginning to move away from the structural tendency to post a loss in 1Q. We will continue to explore ways to improve and rebalance our sales mix going forward.
Another major initiative is what we call “Optimize production.” In Japan, we plan to consolidate the production of tractors, rice transplanters, and combine harvesters at our Matsuyama facility.
Historically, rice transplanters were produced exclusively in Niigata, while combine harvesters were produced solely in Kumamoto. As a result, we had to maintain production even outside the peak demand seasons for each product line, which in turn increased overall inventory. Addressing such challenges is also a key component of our structural reform efforts.
Through these reforms, we believe we can alleviate the quarterly fluctuations to a certain extent.
This fiscal year, favorable market conditions, such as rising rice prices, helped us achieve the results that led to today’s upward revision. However, above all, completing Project Z remains our top priority.
We will continue to work diligently so that our efforts are clearly reflected in our performance and recognized by all stakeholders. We sincerely appreciate your continued support. Thank you once again for your time today.