Highlights of FY2025 Q1 Results
Muneyuki Hashimoto: Thank you for joining our earnings results presentation today. I am Muneyuki Hashimoto, CFO of the Company. I would like to outline our results for Q1 of the fiscal year ending May 31, 2026.
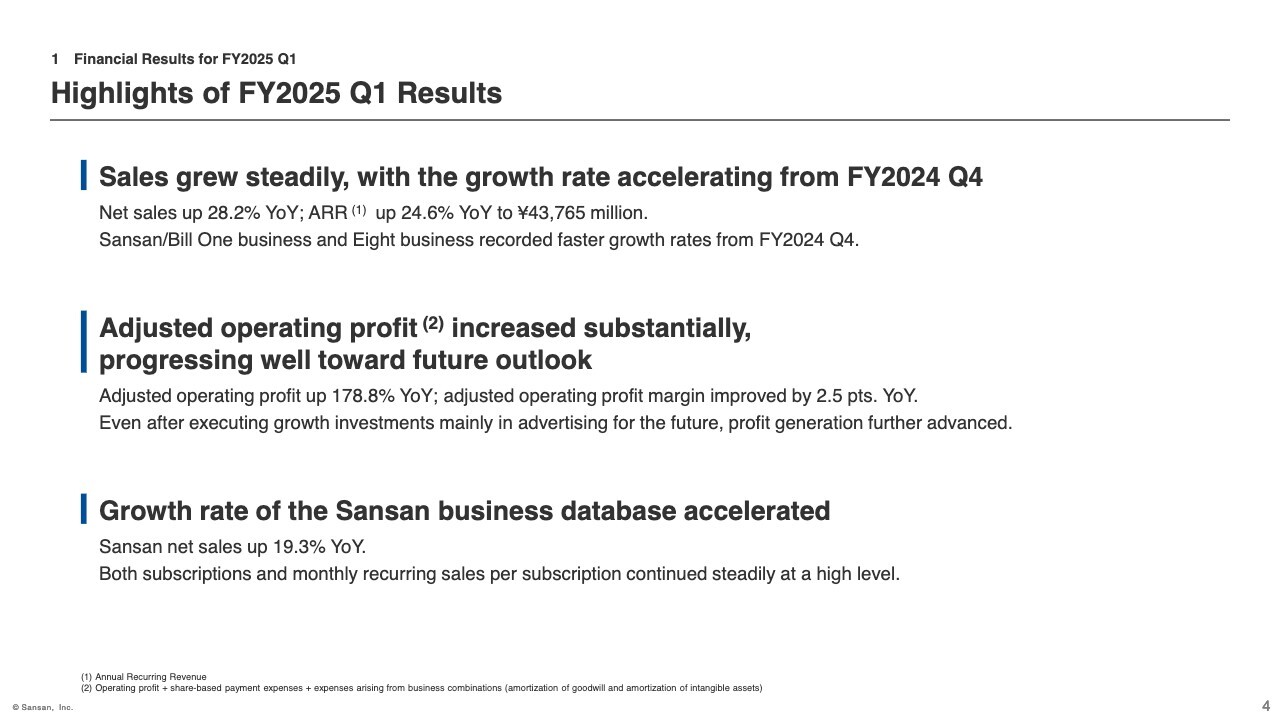
Let me begin with three highlights. The first of these is net sales. Growth rates in all segment were up from Q4 of FY2024 and remained steady. As of August 2025, annual recurring revenue (ARR) exceeded ¥43,765 million.
The second highlight is adjusted operating profit. Despite increased advertising expenses associated with large-scale promotions, we achieved a profit growth rate significantly greater than the sales growth rate.
The third highlight is Sansan business database. The number of subscriptions and monthly recurring sales per paid subscription remained high, recording the highest growth rate of the past three fiscal years.
Overview of Financial Results
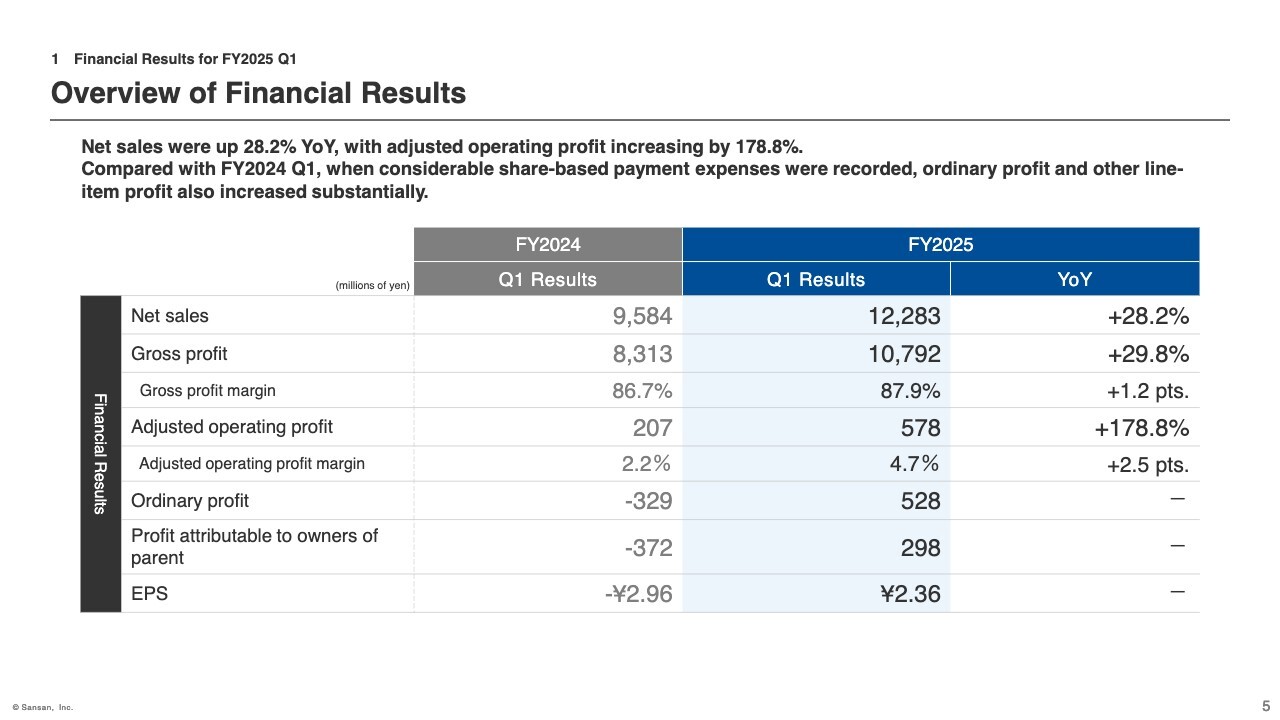
Group-wide financial results are shown in the slide. Net sales grew steadily, rising 28.2% YoY. Gross profit margin increased by 1.2 percentage points YoY. This is mainly due to improved efficiency in Bill One data digitization operations.
Adjusted operating profit increased by a significant 178.8% YoY due to net sales growth, an improved gross profit margin, and a lower ratio of personnel expenses, despite increased advertising expenses due to TV commercials and other large-scale promotions continuing from Q4 of FY2024.
Ordinary profit and profit attributable to owners of parent were negative in Q1 of FY2024 due to a large one-off charge for share-based payment expenses. No such special factors were present in Q1 of FY2025, which resulted in significant increases in profits.
Contributors to Changes in Adjusted Operating Profit
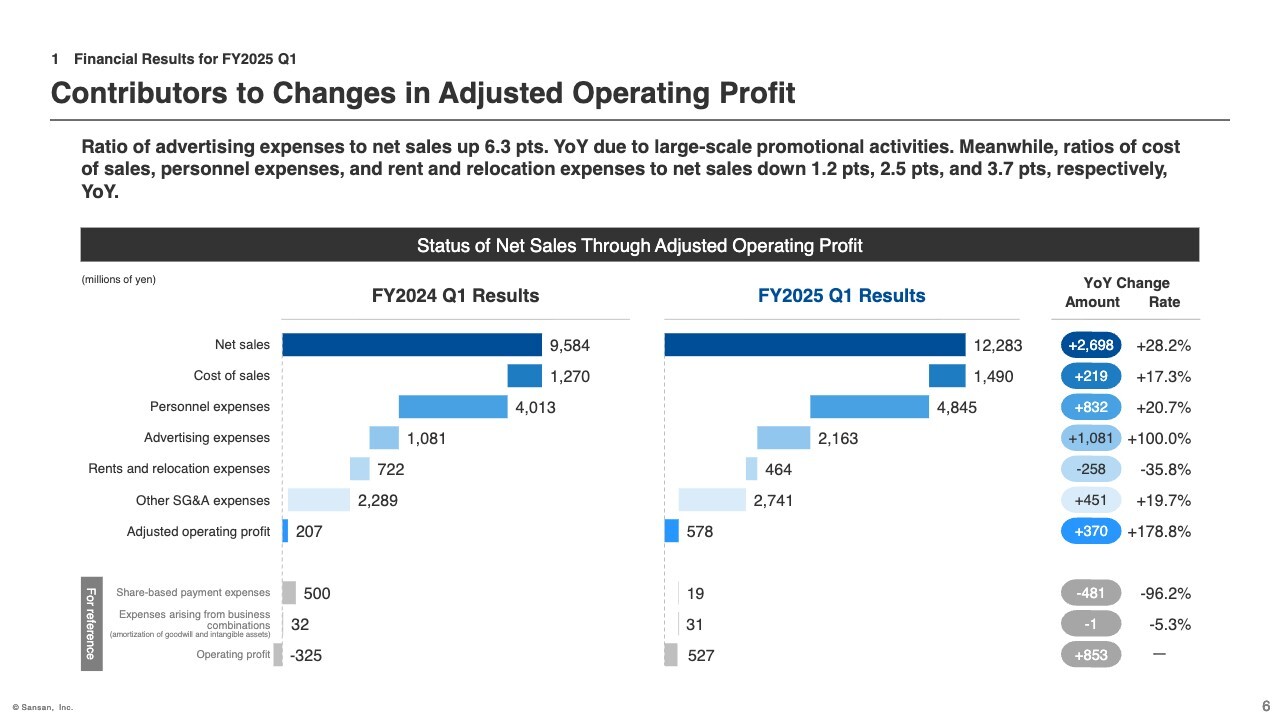
I would like to discuss some details of adjusted operating profit. Net sales remained steady and gross profit margin increased by 1.2 percentage points due to an improvement in the cost of sales ratio.
Breaking down SG&A expenses, advertising expenses increased by approximately ¥1,081 million and the ratio to net sales rose by 6.3 percentage points. On the other hand, the increase in personnel expenses was limited to approximately ¥832 million, resulting in a 2.5 percentage point decrease in the ratio to net sales.
Rents and relocation expenses decreased by approximately ¥258 million due to the elimination of expenses associated with head office relocation and double rent incurred in the same period of the previous year. As a result, the SG&A ratio declined by 6.5 percentage points, leading to a significant increase in adjusted operating profit.
Due to these factors, the Company was able to achieve high profit growth in Q1 of FY2025 while carrying out solid investments in growth for the future.
Results by Segment
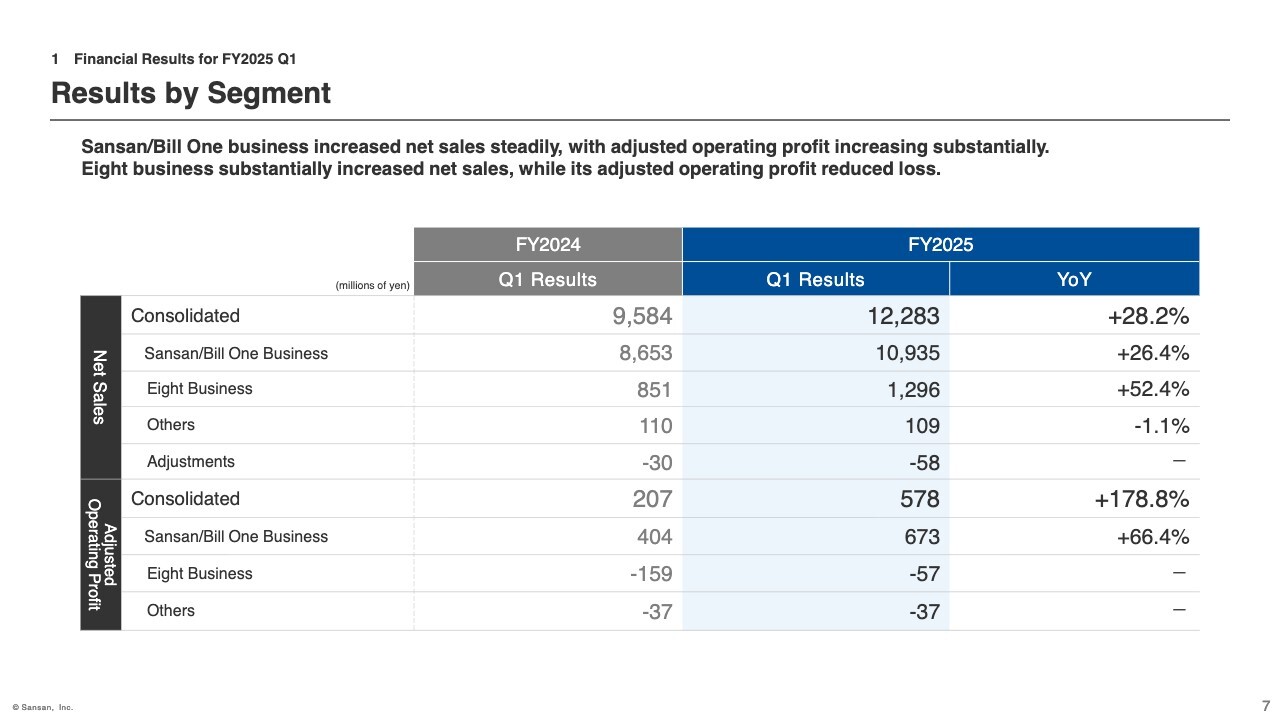
I will now discuss results by segment. The Sansan/Bill One Business posted strong net sales growth and a significant increase in adjusted operating profit. The Eight Business segment saw a significant increase in net sales and a narrowing of its loss.
Sansan/Bill One Business Overview
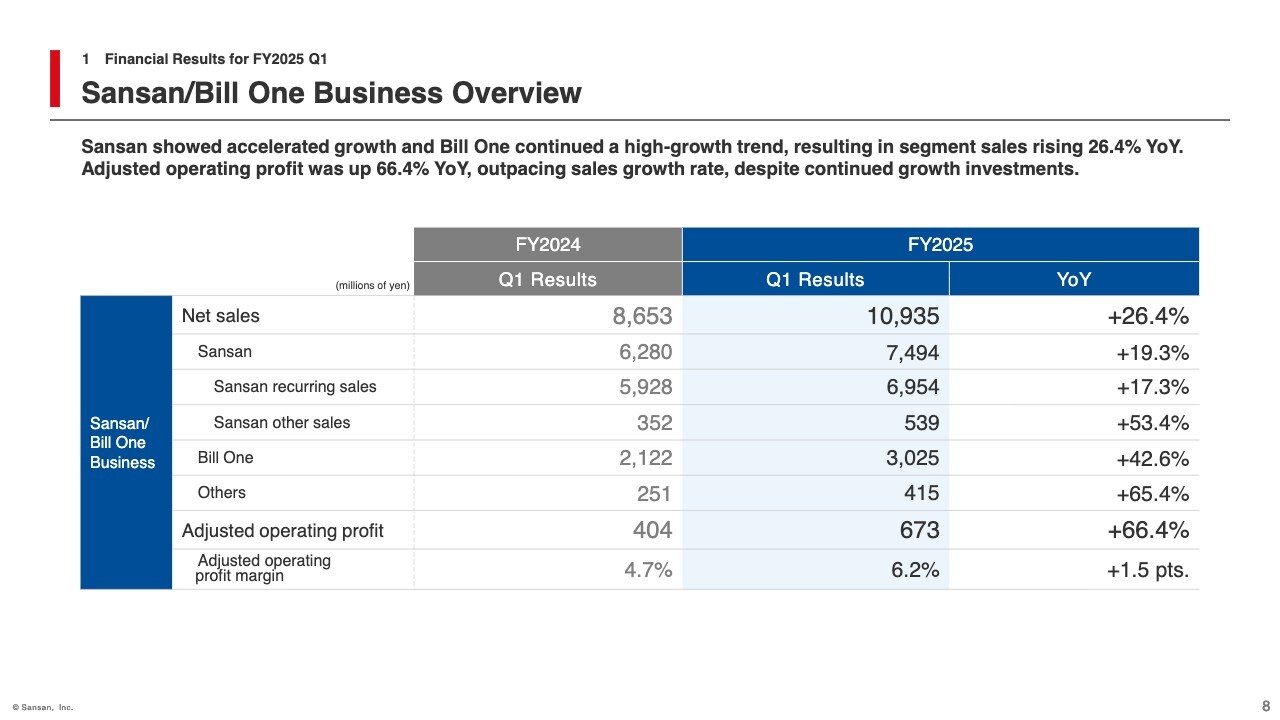
Looking at results by segment, net sales in the Sansan/Bill One business increased by 26.4% YoY.
Looking at results by service, Sansan grew by 19.3%, accelerating its growth rate from Q4 in FY2024 and achieving its highest growth rate of the past three fiscal years. Bill One maintained a high growth rate, increasing its sales by 42.6%.
Adjusted operating profit increased by 66.4% YoY due to net sales growth and an improvement in the gross profit margin of Bill One, despite higher advertising expenses.
In other areas, the AI-driven contract database service Contract One and the group company Nineout, Inc. both showed strong growth. The number of Contract One subscriptions increased to 463, up from 218 at the end of Q1 in FY2024.
Sansan: Status of Key Indicators
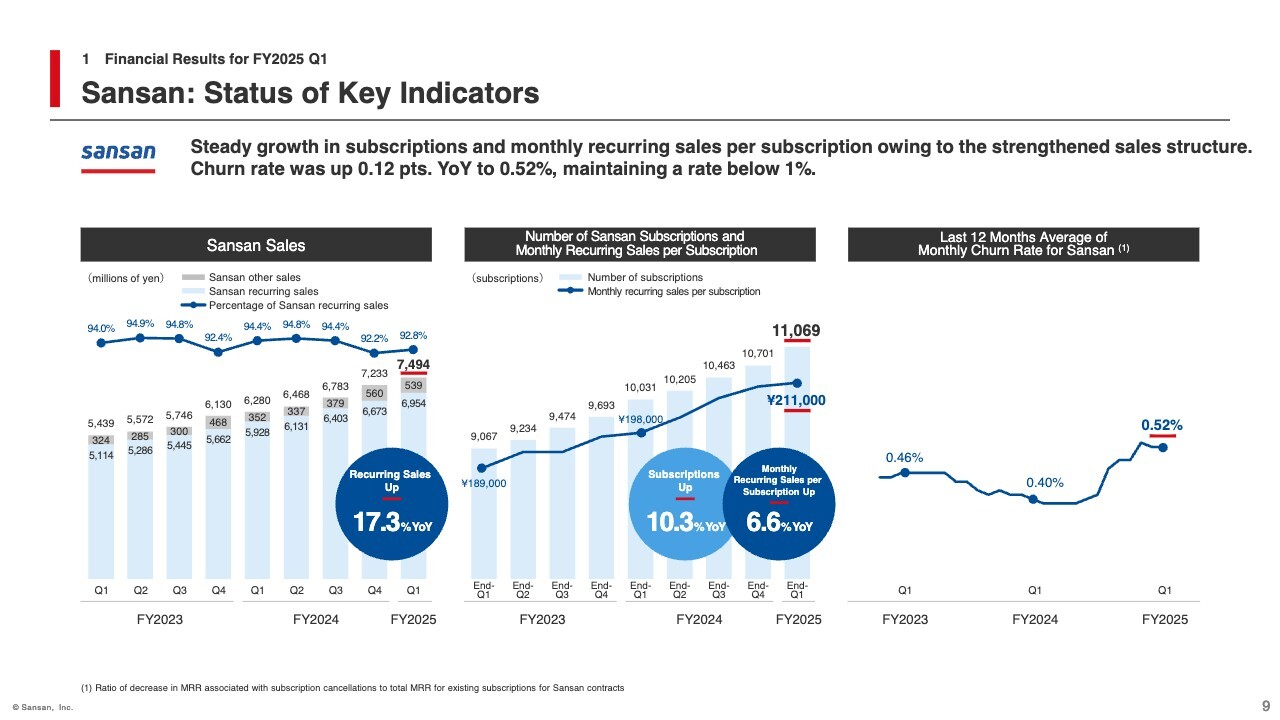
Here I would like to discuss KPIs for Sansan. Recurring sales, shown on the left side of the slide, delivered solid performance, increasing by 17.3% YoY.
The number of subscriptions is shown in the center of the slide. Subscriptions grew by a steady 10.3% YoY, with a net increase of over 350 subscriptions for the quarter. Monthly recurring sales per paid subscription remained high, increasing by 6.6% YoY.
The average monthly churn rate for the most recent 12 months, shown on the right side of the slide, was 0.52%, maintaining a low level of less than 1%. Although the rate increased by 0.12 percentage points YoY, this was due to a temporary increase in churn rate in the previous Q4, a period in which subscription renewals were concentrated. We believe that the increase presents no concern.
For reference, I will provide an update on new contracts received in Q1. The amount of new contracts shown here is a metric similar to the recurring sales metric that will be additionally recorded from here on out, reflecting decrease due to cancellations. The metric includes items that have already been reflected in Q1 net sales and items that began to be recorded in Q2.
That amount was up 20.8% YoY, indicating solid performance.
Bill One: Status of Key Indicators
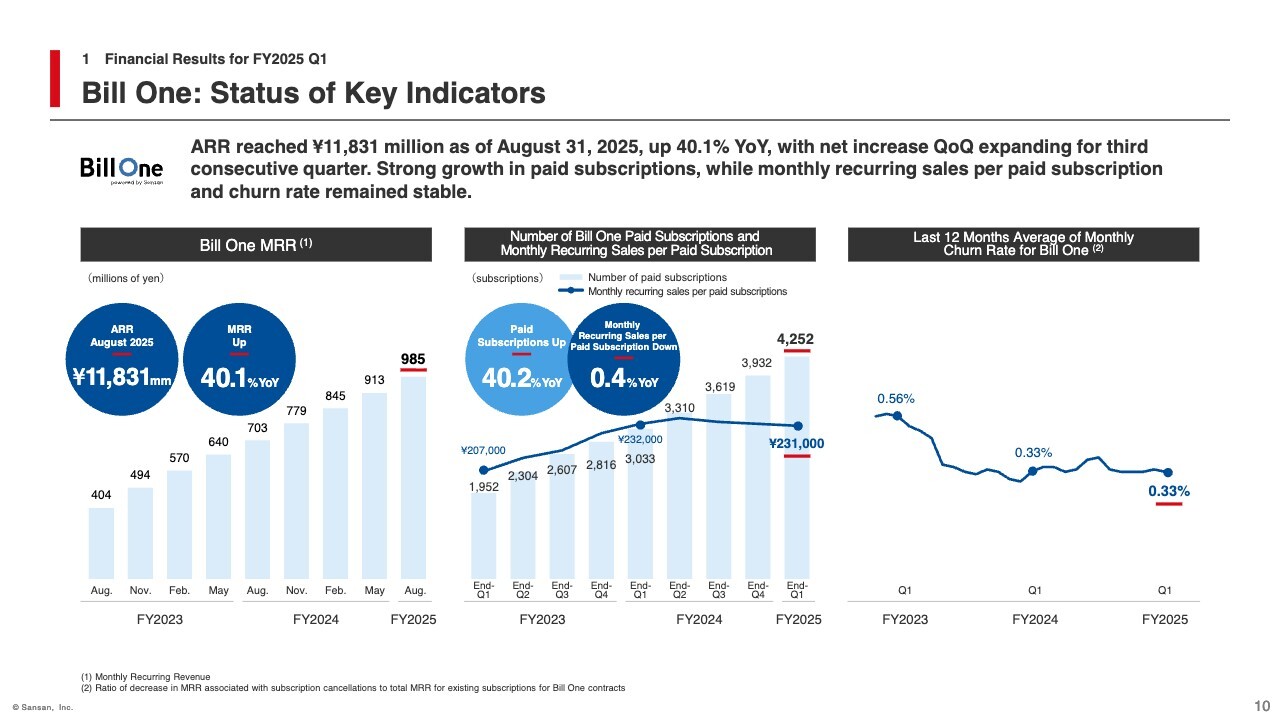
Next, I will discuss KPIs for Bill One.
Looking at MRR on the left side of the slide, August 2025 results increased by 40.1% YoY to ¥985 million, recording a net increase for the quarter of ¥72 million. QoQ net growth has continued for three consecutive quarters since Q3 of FY2024 and remains solid.
The number of paid subscriptions, shown in the center of the slide, increased by 40.2% YoY, recording a net increase of 320 subscriptions for the quarter. This number has continued to grow steadily by over 300 every quarter since Q3 of FY2024.
On the other hand, monthly recurring sales per paid subscription declined by 0.4% YoY due to increased acquisition of smaller customers. However, monthly recurring sales by customer size remain high and present no particular problems.
The average monthly churn rate for the last 12 months, shown on the right side of the slide, remained low at 0.33%.
The amount of new contracts in Q1 declined by 3% YoY, mainly due to a number of expected order wins being pushed back to Q2. The factors behind the negative result are clear, and we believe that we are making steady progress toward achieving our full-year forecast.
Eight Business Overview
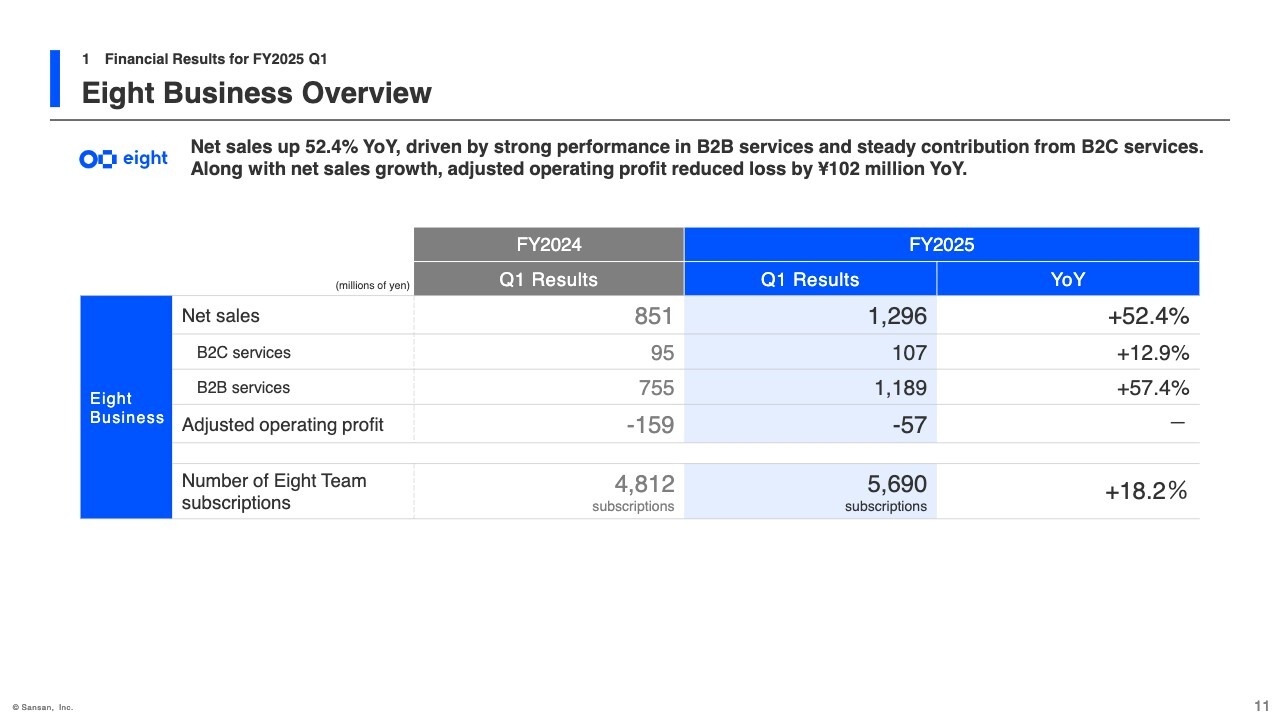
Next, I will discuss the Eight Business. Net sales of B2C services remained strong, rising 12.9% YoY.
Net sales of B2B services were up 57.4% YoY, mainly due to the effect of several business events. As a result, net sales increased significantly by 52.4% YoY, with net sales growth narrowing the loss in adjusted operating profit by approximately ¥102 million.
Medium-Term Financial Policy
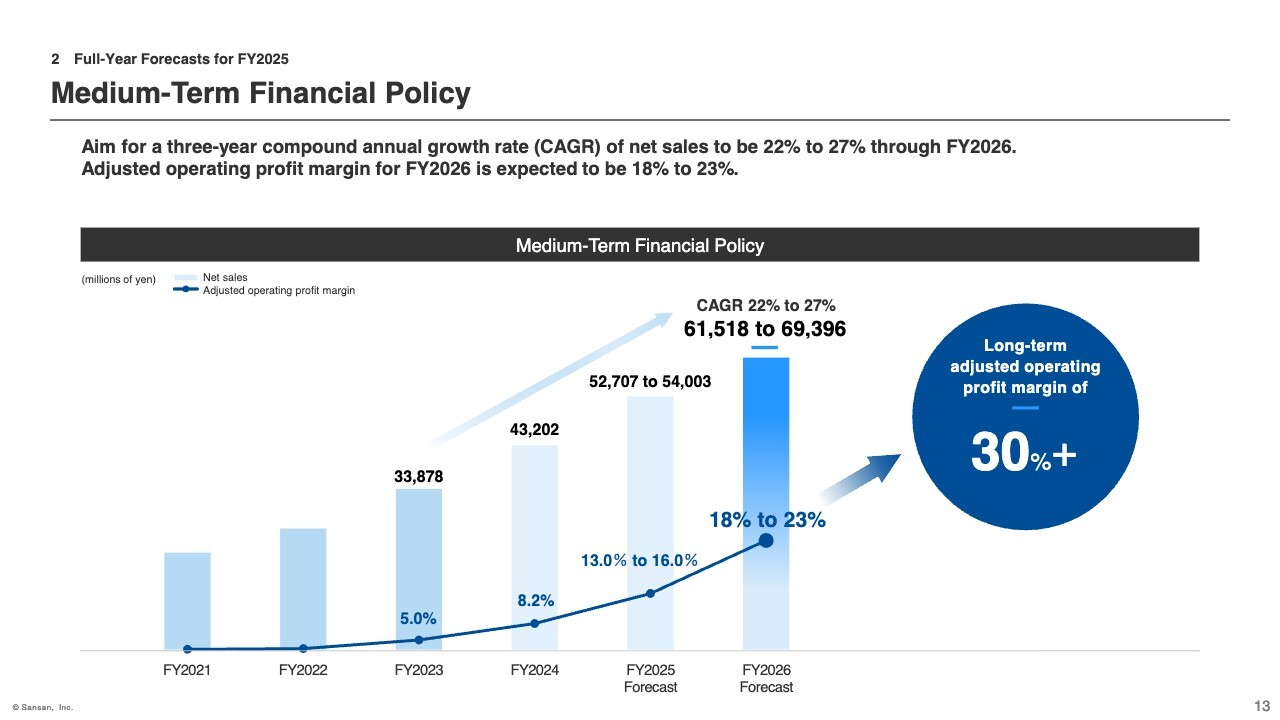
Finally, I would like to discuss our earnings forecast. First, regarding the medium-term financial policy, performance is progressing well and there are no changes to figures at this time.
Full-Year Forecasts
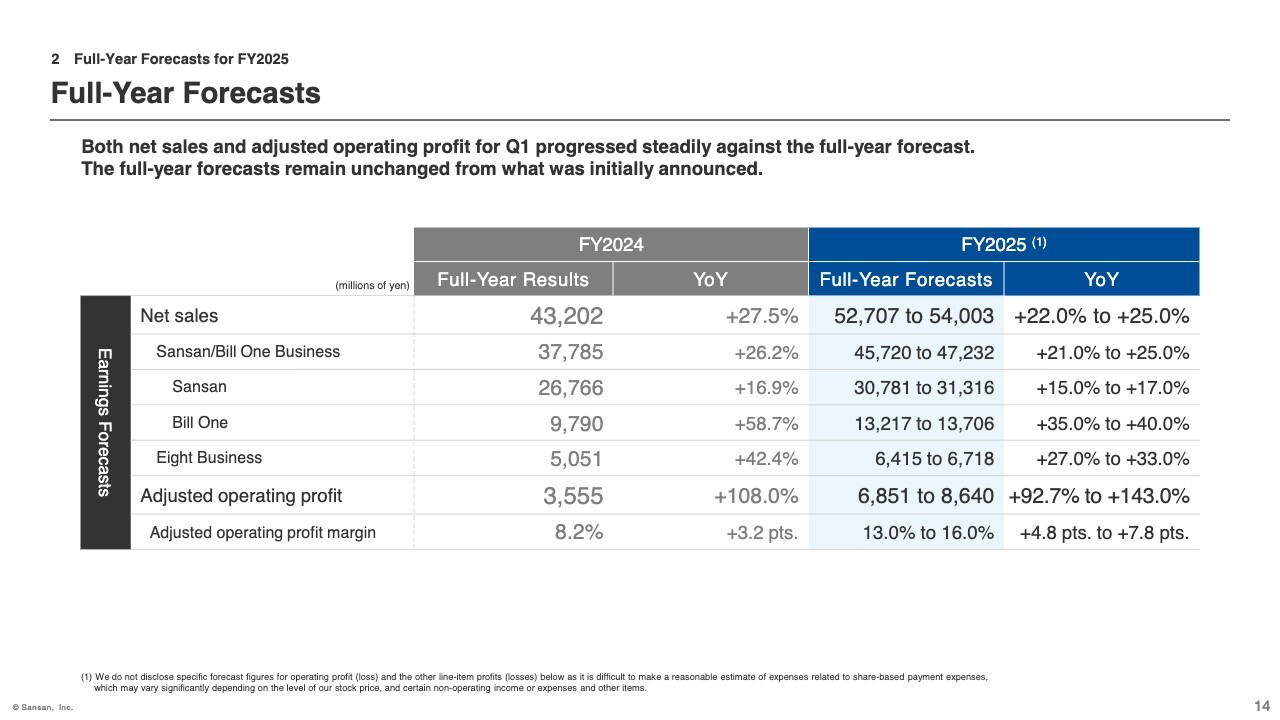
For the fiscal year ending May 31, 2026, there is no change to the full-year forecast from that announced at the beginning of the fiscal year. Net sales are expected to increase by 22.0% to 25.0% YoY, and adjusted operating profit is expected to increase by 92.7% to 143.0%.
Because the Company's business is based on recurring revenue, its structure is such that performance builds and expands as the quarter progresses. The Company plans large-scale advertising expenses in conjunction with the implementation of large-scale promotions in the first half of the fiscal year under review, and thus expects the recording of profits to be weighted in the second half. Specifically, the Company plans to book approximately 25% in the first half of the fiscal year and 75% in the second half.
Therefore, although the rate of progress in adjusted operating profit for Q1 appears low, in reality it is at a very favorable level for the quarter, exceeding internal plans. In addition, advertising expenses are planned to peak in Q1 and profit is expected to remain at an even higher level from Q2.
This concludes the briefing. Thank you very much.
Q&A: Advertising expenses
Q: In Q1, I believe that the company spent quite a bit on advertising expenses. How will you measure the effectiveness of this? Also, how do you plan to allocate future advertising expenses?
Respondent: At this stage, I think it is a little early to judge whether the investment in advertising has been successful or not. We use a variety of indicators to verify the effectiveness of our advertisements and make comprehensive assessments, but the most important items are brand recognition and lead acquisition.
If a measure involves a marketing investment that allows, for example, approaches to individual customers, the most important indicator is the amount of contracts received. In mass marketing leading up to that, however, number of leads acquired and brand recognition are necessary indicators. How this connects to orders will be assessed over the next three to six months.
Large-scale promotions for the current fiscal year have come to a close in Q1. The remaining amount of the full-year advertising expense budget of ¥6.5 billion will be invested evenly over the next three quarters, with a slight weighting toward Q4.
We have not yet finalized the content and breakdown, but we believe that some parts will be mass marketing, while others will be more individual marketing initiatives.
What was very good about advertising investments in Q1, especially for Bill One, was that we focused advertising investments on the launch of the expense reimbursement service. We had already gained recognition of Bill One as an invoice receipt service, and we now note a gradually growing recognition that the service also handles expense reimbursement. We have a very positive feeling about this.
QUESTION: I have the image that the company spends less on advertising expenses than competitors do, but in the last two quarters, it has spent more on advertising than in the past. Has there been some change in the competitive environment?
Respondent: We do not believe the competitive environment has changed significantly. The biggest change that occurs when the competitive environment changes is in the number of contracts acquired, but both Bill One and Sansan have been very strong, and Sansan has been acquiring customers at a greater level than ever, so we do not see any particular change in the competitive environment.
Q&A: Bill One net sales
Questioner: The materials note a relative increase in small businesses as a way of looking at Bill One KPIs. How do you analyze the background to this? Was it an internal factor of new sales force personnel starting up, or was there SMB upside in terms of market penetration?
Respondent: Currently, when we look at the enterprise, mid, and small categories of Bill One, we see that sales to small customers are growing the most year over year.
In the field sales force development process, it is common in a business model such as ours to first gain experience in the small customer area and then move up to mid and then enterprise. Therefore, relatively heavily staffing in the area of small customers is a natural structure.
On the other hand, from the perspective of maximizing order value, we finely tune resource allocation. Currently, it is easiest to obtain orders in the small- and mid-areas, so we are focusing resources on these areas. As a result, order growth is particularly high in these areas.
However, we are not failing to address the enterprise area. We are applying sales know-how obtained through Sansan to Bill One as well, and are establishing a structure for capturing large-scale projects. We expect the results of these efforts to become more apparent in Q2 and later.
Q&A: Trends in Bill One orders
Questioner: What is the outlook for Bill One orders? In the discussion of order momentum in Q1, you mentioned that some orders were pushed back to Q2. Were there some special factors behind this? Also, I would also like to ask whether the considerable advertising expenses in Q1 are likely to yield effects on orders received in Q2 and beyond.
Respondent: The fact that some of the orders were pushed back to Q2 was due to individual factors. There have been no changes in our sales approach, strategy, or on-boarding policy.
Orders in the first month of Q2 (September) are very strong, and we expect the first half as a whole to exceed plans.
Q&A: Bill One cross-selling and ARPU trends
Questioner: My question concerns Bill One. We heard at the beginning of this fiscal year that the company is focusing on the expense reimbursement function and promoting cross-selling with accounts receivable management. With promotional measures taken into account, what is your current sense of whether we can expect a change in ARPU for Bill One in the second half and beyond?
Respondent: We do not yet have a clear feel for the extent of quantitative effect, but our approach to selling invoice receipt, expense reimbursement, and accounts receivable management functions as a package is coming together.
We call this our "suite package." We are gradually seeing cases in which we have been able to sell and receive contracts for the functions as a suite. We are also receiving relatively large orders from customers who use multiple services, even if not the suite, and from customers newly adopting multiple services. We feel that this is having the effect of boosting ARPU.
At the same time, we cannot simply conclude that successful cross-selling and suite sales will automatically increase ARPU. Our acquisition of small-scale customers is progressing very well, creating a structure that makes raising ARPU challenging.
Therefore, we need to keep a close eye on ARPU trends while watching how this balance is offset. In the end, we have a very positive sense that both are working in the right direction for our overall net sales.
Q&A: Factors behind the sales growth and sustainability of Sansan
Questioner: My question concerns Sansan. Net and unit cost increases appear to be positive. What specific factors have brought about these increases, and do you see them being sustained?
Respondent: We have not taken any special measures in the past three months. In mass marketing, we have promoted new functions such as Virtual Cards, but we do not see this as a main factor. Rather, we credit the fact that we have refined our sales approach and can now engage in sales and marketing activities from a firmer footing.
In other words, the fundamental needs of our customers mesh well with the value we can provide, and orders and sales are growing as a result.
At the same time, we also believe that this alone will not achieve evolution. Regarding the new AI-based initiatives announced in the last full-year financial results in July, we plan to release a series of new services from this fall. We expect that this will lead to further sales growth and accelerated growth rates.
Q&A: Factors behind changes in Others category sales at Sansan
Questioner: Sansan's net sales in the Others category grew significantly in Q1. What are the reasons for this and what is your outlook for Q2 and beyond?
Respondent: The main reason for the large increase in the Others category in Sansan sales is the increase in the number of cases in which we receive initial income from digitization of business cards lying dormant at a company when we sign a new contract.
Although specifics vary with company size, we believe that solidly booking these Setup Fees in Q1 enabled the increase in Others sales.
We expect no major changes in Q2 and beyond.
Q&A: Sansan growth trends by customer size
Questioner: Looking at Sansan sales composition by customer size, the growth rate rose YoY for companies with 1,000 or more employees. Is it safe to assume that this trend will continue in Q2 and beyond?
Respondent: We do not think that the trend will change significantly. However, I believe that initiatives such as the noted one regarding MCP servers using AI will be more effective in the mid or enterprise space than in the small space.
We intend to confirm which areas are affected, and to what extent, as we proceed with the release.
Q&A: Bill One order structure and enterprise sales development
Questioner: You mentioned the ease of achieving Bill One orders with customers in the small and mid areas. How should we understand the reason for this? Also, you mentioned that Sansan know-how is being brought to the enterprise area. What are your specific initiatives here?
Respondent: The greater ease of acquiring orders is in the nature of the small area and is not due to the sales approach or product specifications.
One factor that can be inferred is that larger companies already have their invoice processing operations in place, leaving relatively little room for us to enter. However, there is ample room to highlight value in terms of cost reduction and other benefits. We believe this is an area that we will penetrate over time.
In terms of sales structure, while we have mainly targeted small- and mid-size customers for Bill One with a focus on mass promotions, for Sansan we have been working to deepen business-to-business relationships through golf tournament sponsorship deals and other activities.
This approach is important for enterprise sales. We have also absorbed know-how from Sansan for application to Bill One, and are developing a structure that that includes the assignment of personnel to conduct similar sales activities. We look forward to seeing it up and running.