
Index
Shiro Tomiyasu (hereafter, Tomiyasu): Hello everyone. I am Shiro Tomiyasu, President and Representative Director, ISEKI & CO., LTD. Thank you for attending our financial results briefing for 2Q FY12/2025. We truly appreciate your continued support and valuable feedback on our investor relations efforts. Today's briefing will proceed as outlined on this slide.
Key Points
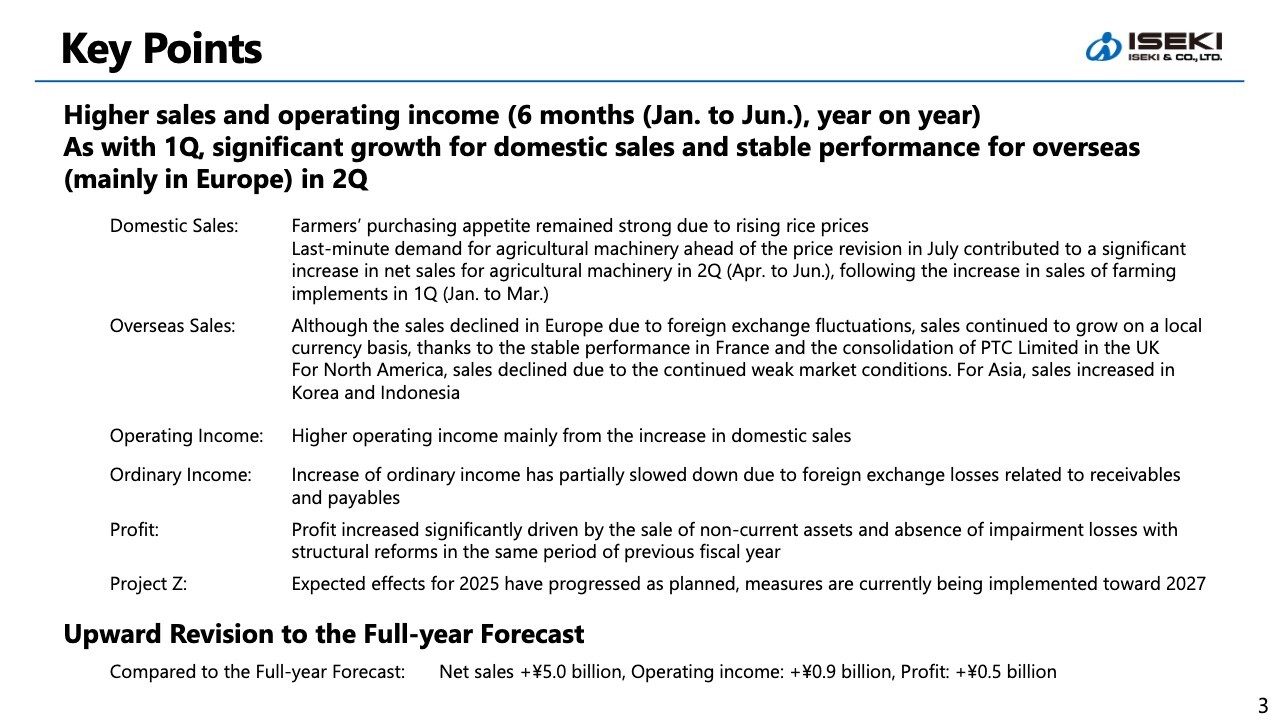
First, let me summarize the key points of these financial results. Performance for 2Q (April to June) showed both higher sales and profit YoY. As with 1Q, we achieved significant growth for domestic sales, while overseas we maintained stable growth, mainly in Europe. The breakdown of domestic and overseas sales is shown on the slide and explained in more detail later.
On the profit front, operating income increased mainly due to higher domestic sales. Ordinary income turned negative, shifting from a positive position, as the weak yen led to the deterioration in foreign exchange gains and losses under non-operating income. Consequently, the increase in profit was narrower compared with operating income growth. However, profit for 1H increased significantly, reflecting gains on the sale of non-current assets and the absence of impairment losses with structural reforms that occurred in the same period of the previous fiscal year.
In addition, Project Z, which we are currently advancing with great effort, is progressing as planned in terms of its impact on profits for the current period, and we are promoting various measures toward 2027.
The full-year forecast has been revised upward, as both net sales and profit are now expected to exceed the initial forecast due to significantly higher sales in 2Q.
Outline of Consolidated Business Performance
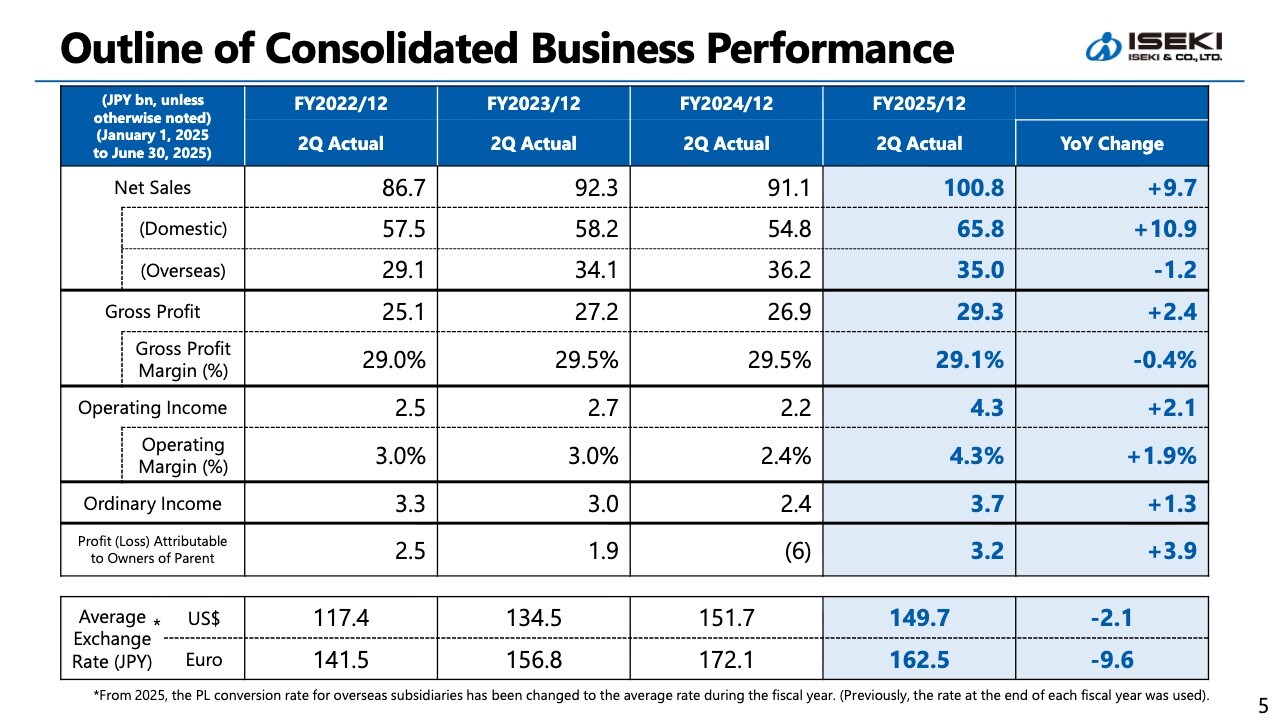
Here is a summary of the 2Q consolidated business performance. Net sales increased by ¥9.7 billion YoY to ¥100.8 billion, with domestic sales increasing by ¥10.9 billion and overseas sales decreasing by ¥1.2 billion. On the profit side, operating income increased by ¥2.1 billion YoY to ¥4.3 billion, while ordinary income and interim profit also increased.
Trends in Consolidated Financial Results (Quarterly)

This slide shows quarterly trends in net sales and operating income. The bar chart represents net sales, with blue indicating domestic sales and yellow indicating overseas sales. The line chart shows operating income. As you can see, our performance exhibits seasonality, with 2Q (April to June) being the peak period.
Previously, 1Q typically began with an operating loss, largely because the domestic market was in its off-season, before rice transplanters began selling. However, with overseas net sales now accounting for a larger proportion, we have been able to start 1Q in positive territory since FY12/2023.
Domestic Sales
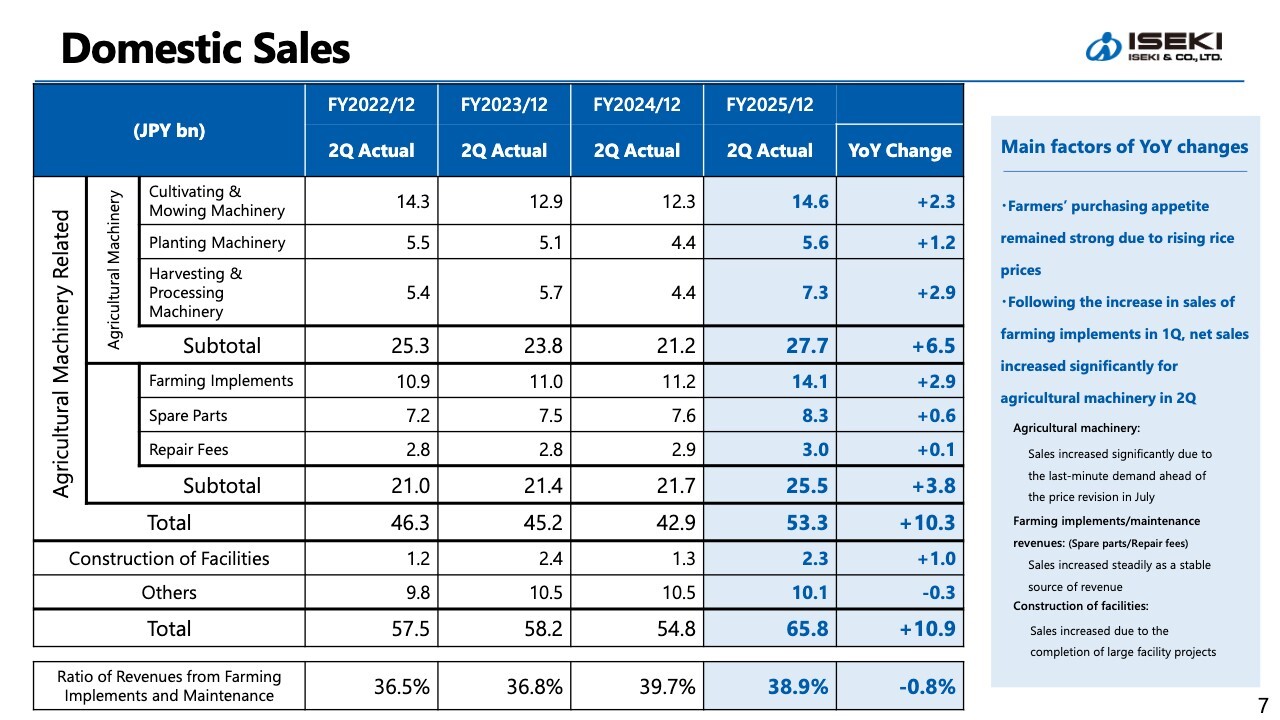
This slide shows the status of domestic sales. As indicated in the total column of the table on the slide, net sales increased by ¥10.9 billion YoY. For agricultural machinery—specifically those manufactured and sold by ISEKI—sales increased by ¥6.5 billion. This growth was driven by the continued strong purchasing appetite of farmers, resulting from rising rice prices, coupled with last-minute demand ahead of the price revision in July.
Farming implements, spare parts, and repair fees recorded higher sales by ¥3.8 billion YoY. Items listed in the middle section of the table, such as maintenance-related sales, have been central to distributors’ reforms of revenue and cost structures over the past decade. These are growing steadily as stable sources of revenue. As for the construction of facilities, sales increased by ¥1.0 billion, reflecting the completion of large facility projects during the current period.
Overseas Sales
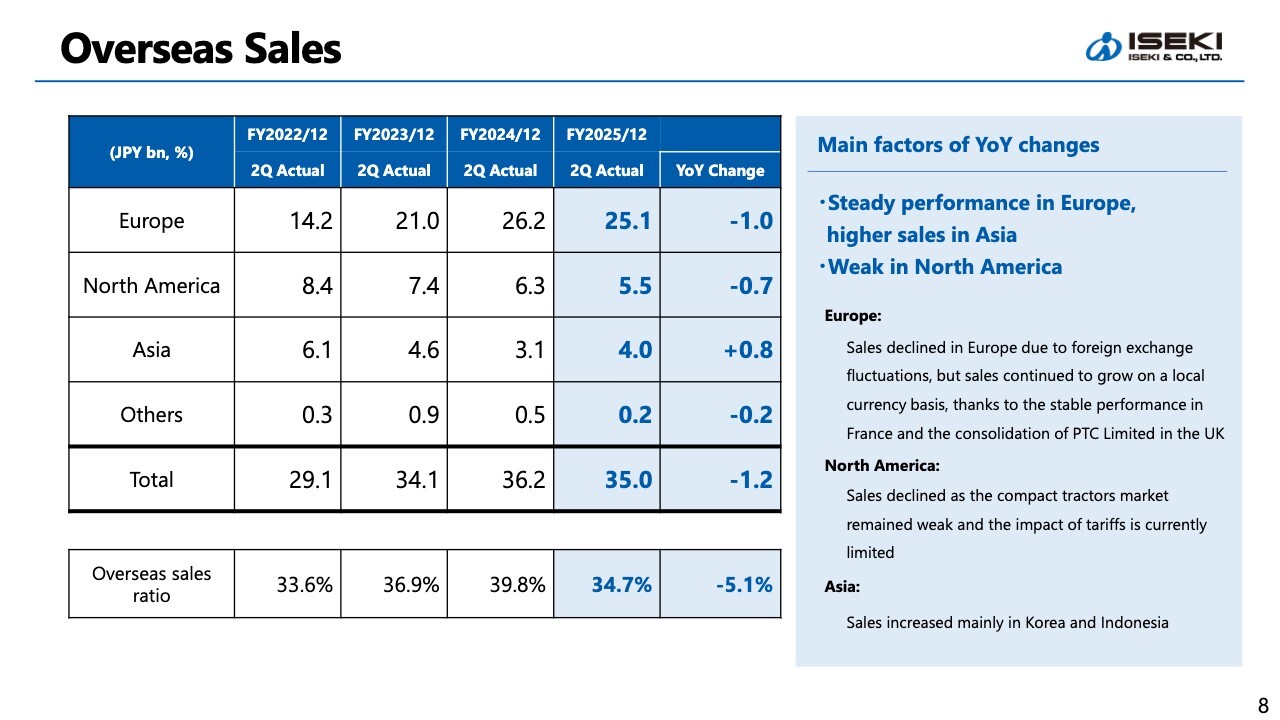
Next, overseas. As shown in the total column on the slide, sales declined by ¥1.2 billion YoY. However, sales increased on a local currency basis. While in Europe, sales declined due to foreign exchange fluctuations, stable performance continued in France. In addition, the consolidation of PREMIUM TURF-CARE Ltd. (PTC) in the U.K. since January contributed to continued growth on a local currency basis.
In North America, the compact tractor or small-class tractor market remained weak, resulting in a ¥0.7 billion decrease in sales. In Asia, sales increased in Korea and Indonesia. The overseas sales ratio was 34.7%.
Regarding the Impact of U.S. Tariffs
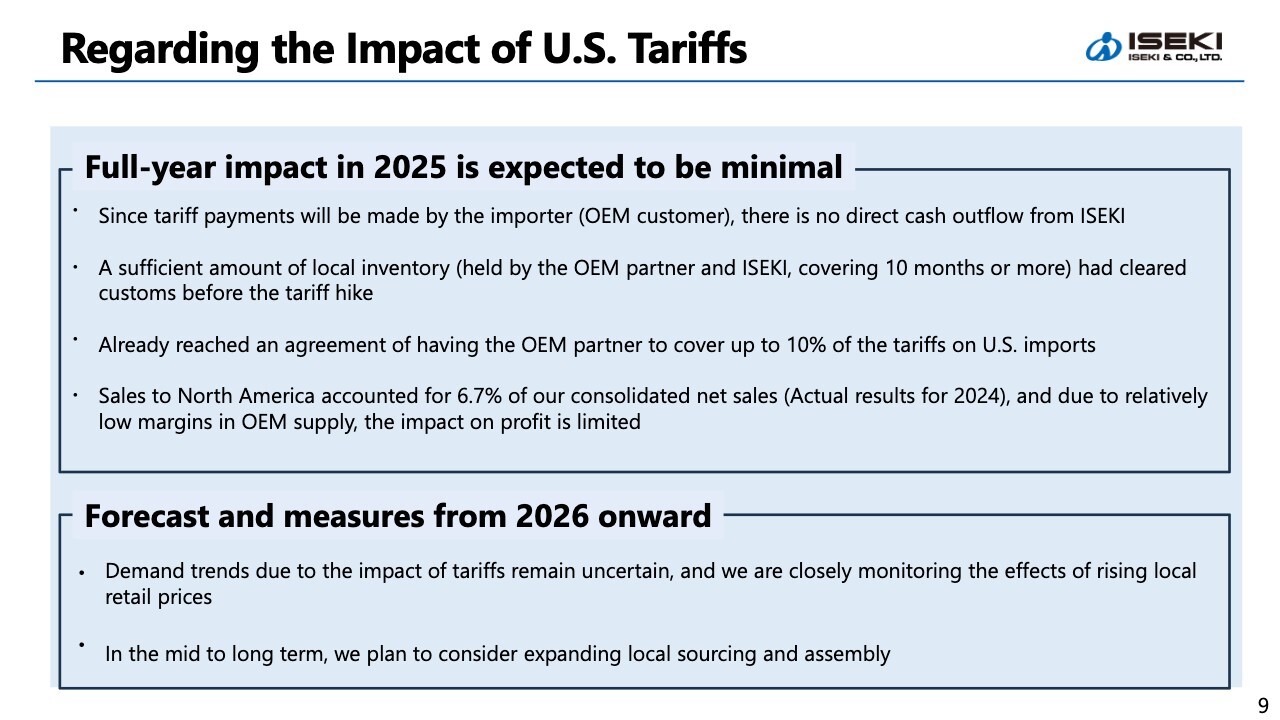
Next, I will explain the impact of U.S. tariffs. We continue to view the full-year impact for FY12/2025 as minimal. We bear no tariff burden. Furthermore, because a certain amount of local inventory cleared customs before the tariff hike, we believe the impact on local sales will be limited.
The proportion of our total net sales attributable to North America stood at just 6.7% in the previous fiscal year. Since this is an OEM business, which by nature has low profit margins, it is one of the reasons we consider the impact limited.
From 2026 onward, demand trends due to the impact of tariffs remain uncertain at this point, and sales volumes may decrease. To address this over the medium to long term, we have begun exploring local sourcing and assembly.
Operating Income
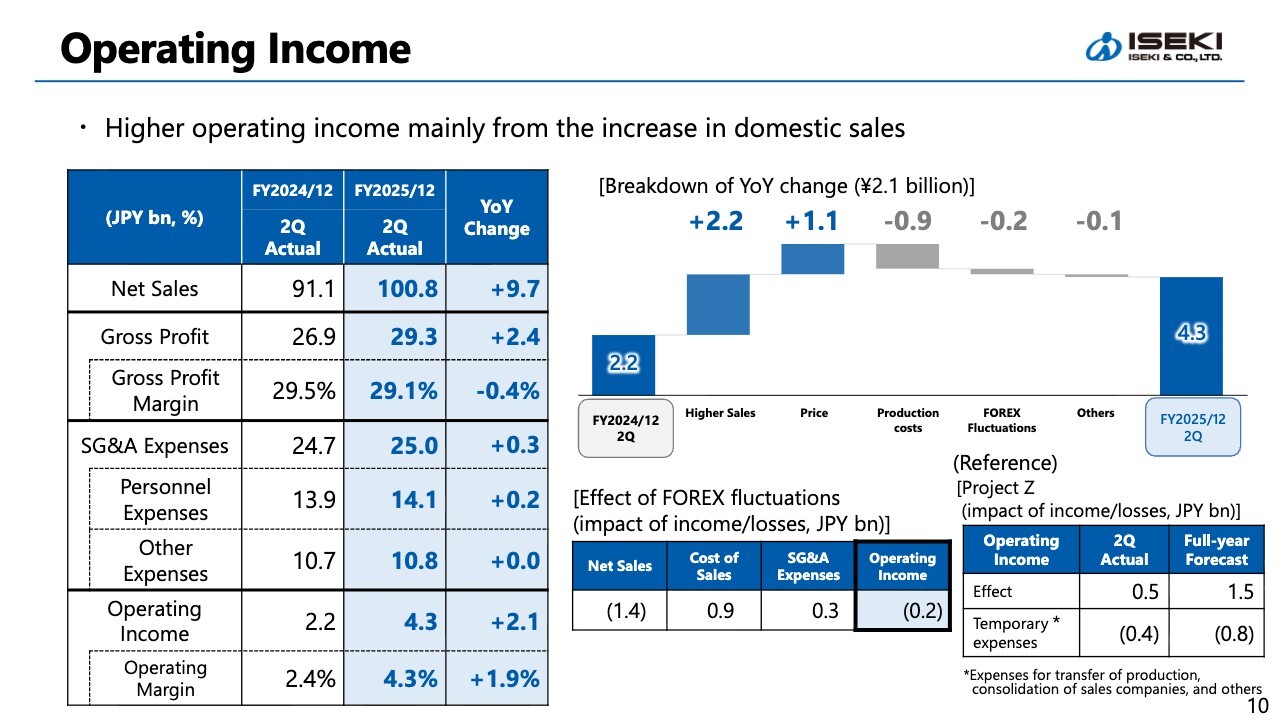
As shown in the graph on the right side of the slide, operating income increased by ¥2.2 billion due to higher gross profit from increased domestic sales, and by ¥1.1 billion from the effect of sales price revisions. Price revisions totaled approximately 11% across 2022, 2023, and 2024, and their impact is gradually becoming apparent.
Meanwhile, operating income increased by ¥2.1 billion to ¥4.3 billion during the current period, driven by a ¥0.9 billion positive impact from rising production costs and a ¥0.2 billion negative impact from FOREX fluctuations. At present, when looking at specific periods, the positive effects of price revisions have outweighed the impact of rising raw material costs.
As shown in the table on the lower right, the effect of FOREX fluctuations was negative ¥1.4 billion on net sales and negative ¥0.2 billion on operating income. Furthermore, the effect of the Project Z measures, shown to the right of that, was positive ¥0.5 billion by the current period, offset by temporary expenses of ¥0.4 billion, resulting in a net positive effect of ¥0.1 billion.
During the period, the effects of Project Z measures remain minimal. Meanwhile, this period includes merger costs for distributor ISEKI Japan and temporary expenses related to the transfer of production from Kumamoto Factory to Matsuyama Factory.
For the full year, the effect is expected to be a positive ¥1.5 billion, while the expenses will be ¥0.8 billion. For the current period, the effect was a positive ¥0.5 billion and the expenses were a ¥0.4 billion. At present, these results remain within the expected range.
Ordinary Income & Profit

This slide shows the results for ordinary income and below. As noted on the right side of the slide, foreign exchange gains and losses deteriorated. While they were positive during the yen’s depreciation, they turned negative during the current period due to the yen’s recovery, resulting in a net decrease of ¥0.6 billion. Consequently, the increase in ordinary income has slowed down compared with that at the operating income level.
Profit attributable to owners of parent increased by ¥3.9 billion YoY to ¥3.2 billion. This was due to gains on the sale of non-current assets during the current period and the absence of impairment losses related to the suspension of production at the Kumamoto Factory, which had been recorded in the same period of the previous fiscal year, leading to an increase in the ordinary income level and below.
Balance Sheet

This slide summarizes the balance sheet. Total assets decreased by ¥12.6 billion YoY to ¥211.5 billion. Inventories, the urgent issue, were significantly reduced by ¥14.1 billion, reflecting strong performance in domestic sales. In addition, interest-bearing liabilities decreased by ¥11.3 billion.
Project Z, currently underway, aims to improve profitability and enhance asset efficiency. While non-current assets are a major theme in improving asset efficiency, immediate progress is difficult as we are advancing capital investment in manufacturing facilities, primarily in Matsuyama Factory. Meanwhile, a reduction of nearly ¥7.0 billion was made in inventories over the previous fiscal year, and we expect further reductions in 2H.
Equity Ratio / Interest-bearing Liabilities

This slide shows the changes in the equity ratio and interest-bearing liabilities during 1H of the current fiscal year. The end of 1H is a period when collections for spring products, such as rice transplanters in the domestic market, have not yet been fully realized. As a result, interest-bearing liabilities remain high.
During the period, the reduction in inventory assets contributed to progress in reducing interest-bearing liabilities. As a result, the D/E ratio fell below 1.0, to 0.97. While the equity ratio is still not sufficient, it has recovered to 33.6%. Going forward, we expect interest-bearing liabilities to be further reduced by the end of the current fiscal year as the collection of trade receivables progresses.
Cash Flows
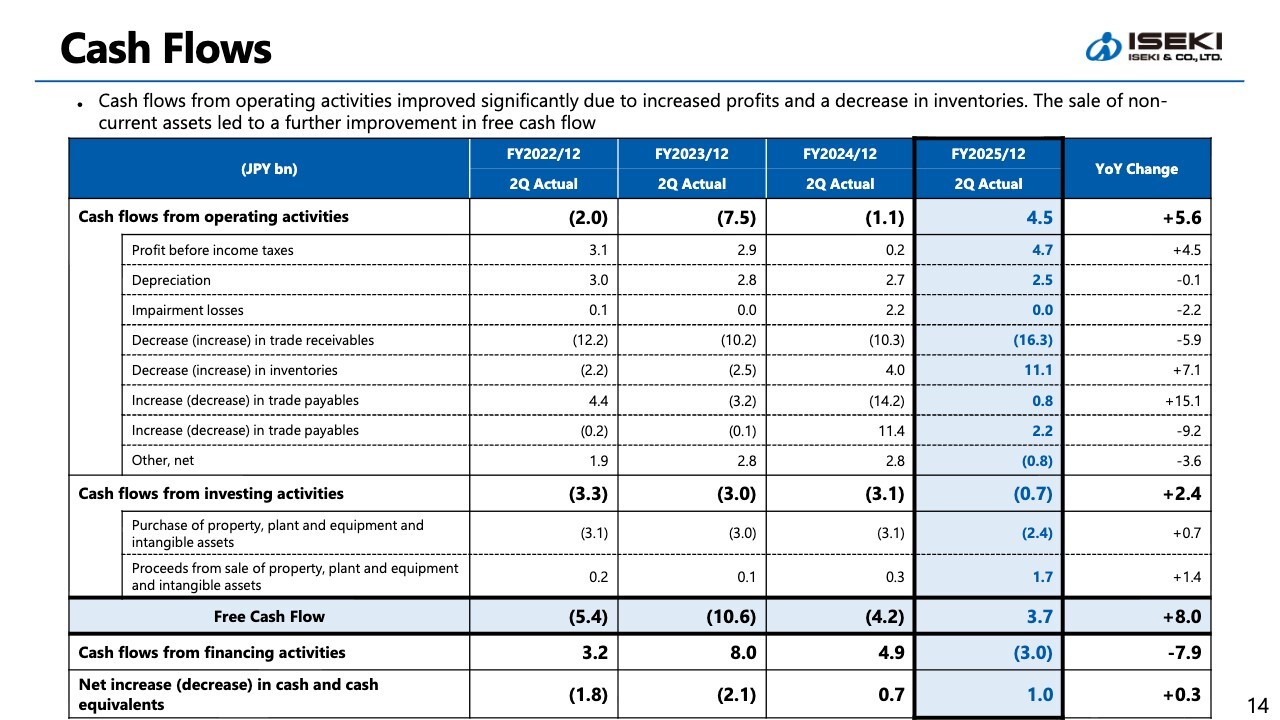
This slide summarizes cash flows. As shown in the upper section of the slide, cash flow from operating activities turned positive due to the recognition of interim profit and the reduction of inventories. As explained earlier, we expect the collection of trade receivables to progress further from July onward, leading to an expansion of positive cash flow from operating activities for the full year.
In terms of cash flow from investing activities, we advanced capital investment while carefully selecting investment targets, and curbed payments through measures such as real estate sales. As a result, we generated positive free cash flow in 1H.
Domestic Market Trends
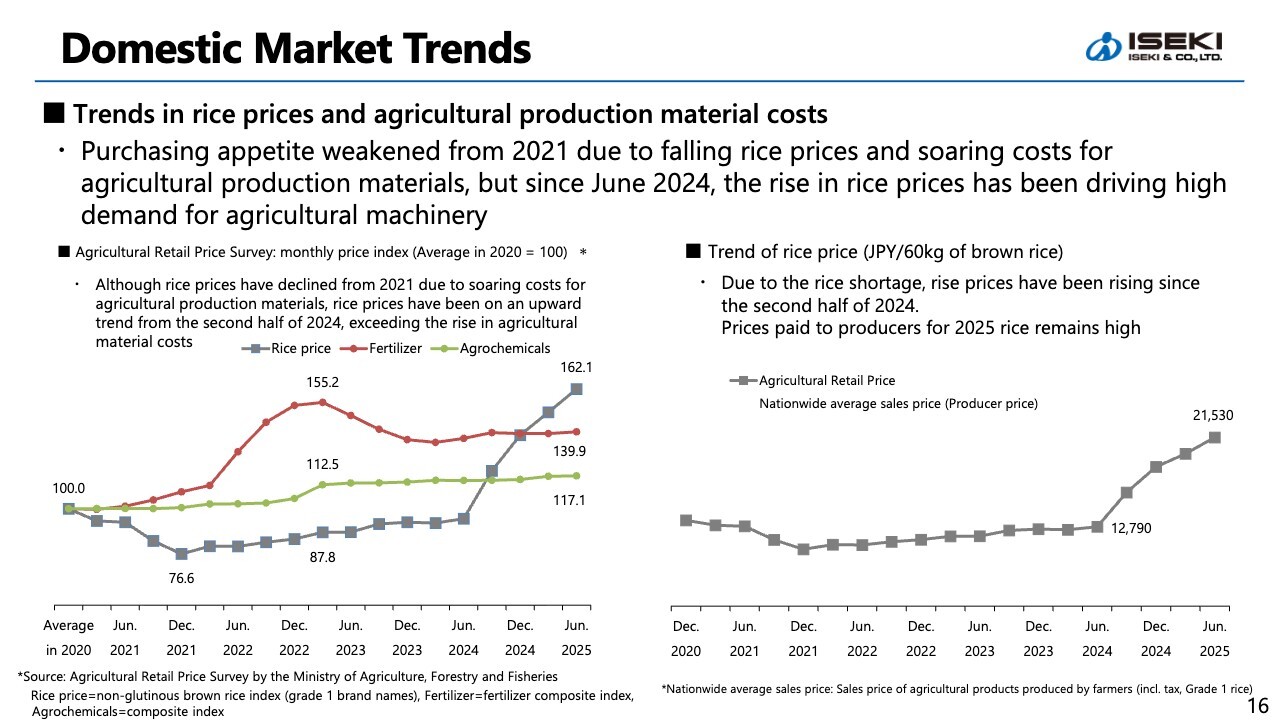
This slide shows domestic market trends. The line graph on the left side of the slide illustrates price index trends for rice, fertilizer, and agrichemicals, with 2020 set as the base value of 100.
The COVID-19 pandemic began in 2020. Its impact—including reduced inbound tourism and a slump in the restaurant industry—led to lower demand for rice and a subsequent decline in rice prices. Meanwhile, agricultural production materials such as fertilizers, agrichemicals, feed, and even the plastic used for greenhouses saw sharp price increases across the board. As a result, rice farmers in particular faced a situation where the more they produced, the greater their losses became. This in turn led to a decline in farmers’ appetite for purchasing our machinery.
Since the summer of 2024, rice prices have been recovering. As shown in the graph, the profitability of rice farming has also improved, leading to a recovery in farmers’ appetite to purchase agricultural machinery.
The graph on the right shows the trend of rice prices. This represents the producer price, which directly affects farmers’ income. For the 2025 new rice crop, estimated payments for transactions with Japan Agricultural Cooperatives remain high across regions, with multi-year contracts being signed in some areas.
A similar trend is also observed in transactions with collectors. We anticipate that rice prices will remain at a certain level, supporting farmers’ appetite to purchase agricultural machinery for at least the next two to three years.
Domestic Market Trends
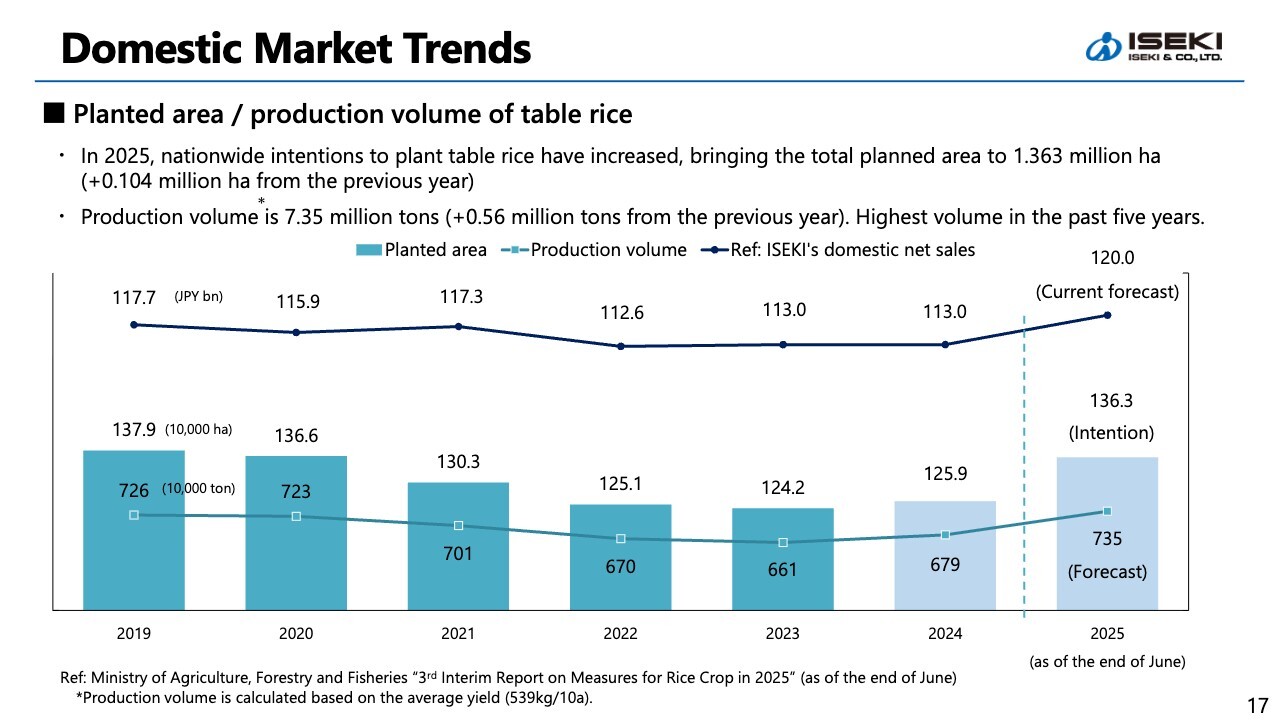
This slide’s graph shows a bar chart of the planted area of table rice and a line chart of its production volume. Our net sales are also shown for reference, highlighting their correlation.
The area planted with table rice in 2025 is expected to increase across Japan, reaching just over 1.36 million hectares—up approximately 0.1 million hectares from the previous year. Production volume is projected to reach 7.35 million tons, up 0.56 million tons from the previous year, marking the highest volume in the past five years.
Our domestic net sales are expected to increase for the full year of FY12/2025, supported by improved purchasing appetite among farmers driven by rising rice prices and improved market conditions.
Domestic Market Trends (Agricultural Administration)
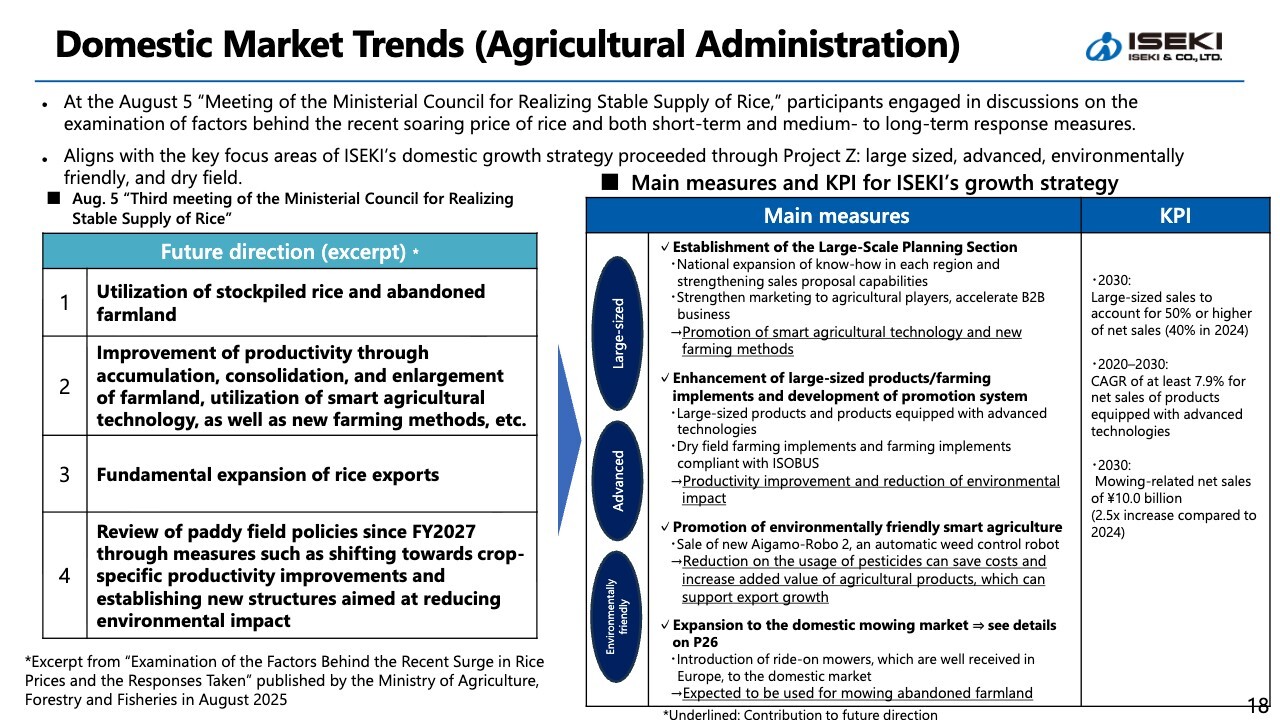
Let me briefly discuss the latest trends in agricultural administration. To address the rice shortage, a meeting of the Ministerial Council was convened. Prime Minister Ishiba instructed an examination of the factors behind the soaring price of rice, the implementation of countermeasures, and a review of medium- to long-term rice policies.
The excerpt outlining future directions for agricultural administration is shown on the left side of the slide. In these directions, production aligned with demand is emphasized, and we understand that large-scale operations and high efficiency are key points. This focus is closely aligned with Project Z’s domestic growth strategy of large-sized, advanced, environmentally friendly, and dry field.
We believe that Project Z will contribute to the expansion of smart agriculture and new farming methods, as well as to higher productivity. Furthermore, in environmentally friendly agriculture, it will not only reduce environmental impact but also support increased exports by enhancing the added value of products such as organic rice.
While steadily capturing these changes, we will continue to advance each measure and achieve the KPIs shown on the right, driving growth through the successful completion of Project Z.
Domestic Market Trends (Status of ISEKI)
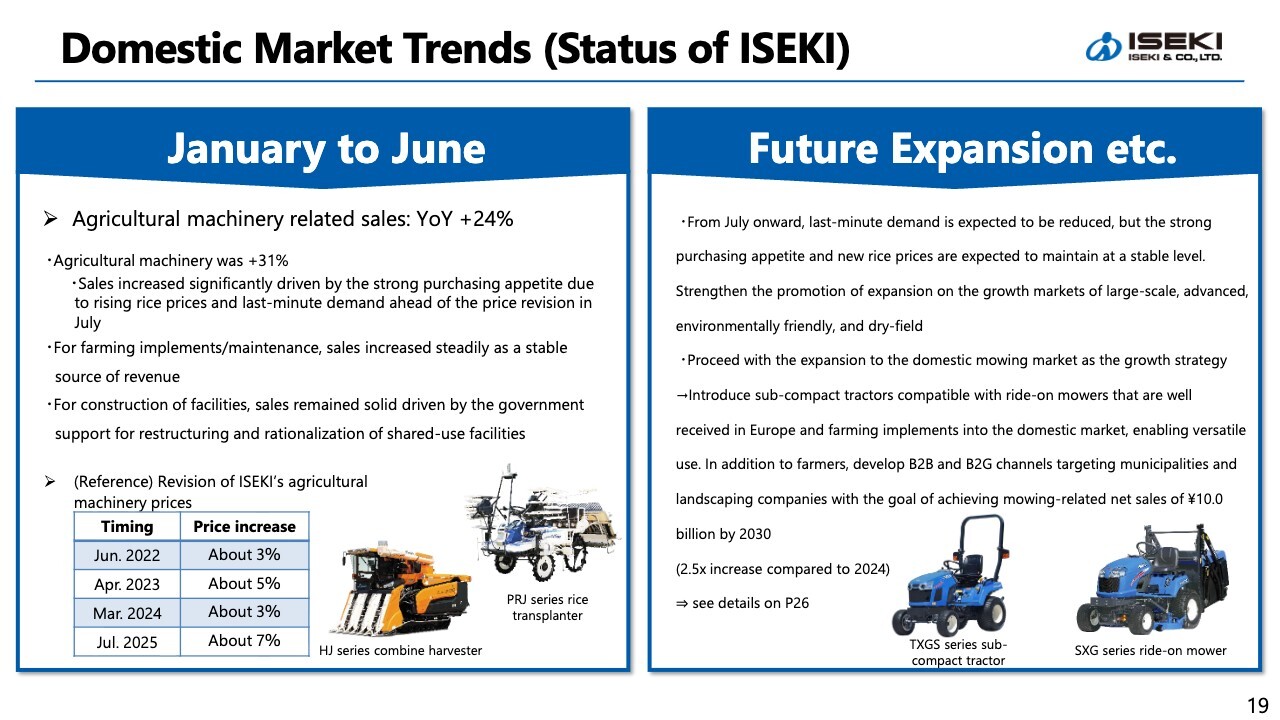
This slide shows domestic market trends. On the left side, sales of agricultural machinery-related products from January to June increased by 24% YoY, with agricultural machinery sales up 31% YoY.
The right side highlights future expansion. While last-minute demand is expected to be reduced after July, purchasing appetite is likely to strengthen with rising rice prices, and new rice prices are projected to remain at a certain level going forward. Therefore, we plan to strengthen our promotion of expansion in the growth markets of large-sized, advanced, environmentally friendly, and dry-field. In addition, as part of our growth strategy, we will enter the mowing market.
Overseas Market Trends (Europe)

Next are overseas market trends. I will discuss the market in Europe, a pillar of our growth strategy. Here are our sales results for the January to June period. In the same period last year, there was a special demand for some electric appliances in the purchased products. This factor was absent in the current period, and it was anticipated from the beginning of the period. Meanwhile, sales of new products that effectively captured customer needs remained steady, particularly in France.
Furthermore, in terms of our own products, sales volume of ride-on mowers remained stable in the professional market, our primary arena, with an increase of 3% YoY.
The right side of the slide outlines our future expansion. We are developing measures around four themes to strengthen our presence in the European market. We aim to further grow our business by leveraging profit contributions to the Group from the consolidation of U.K.-based PTC Limited, expanding our product lineup, and enhancing centralized management and improved efficiency of inventories across our three European subsidiaries.
Overseas Market Trends (North America, Asia)
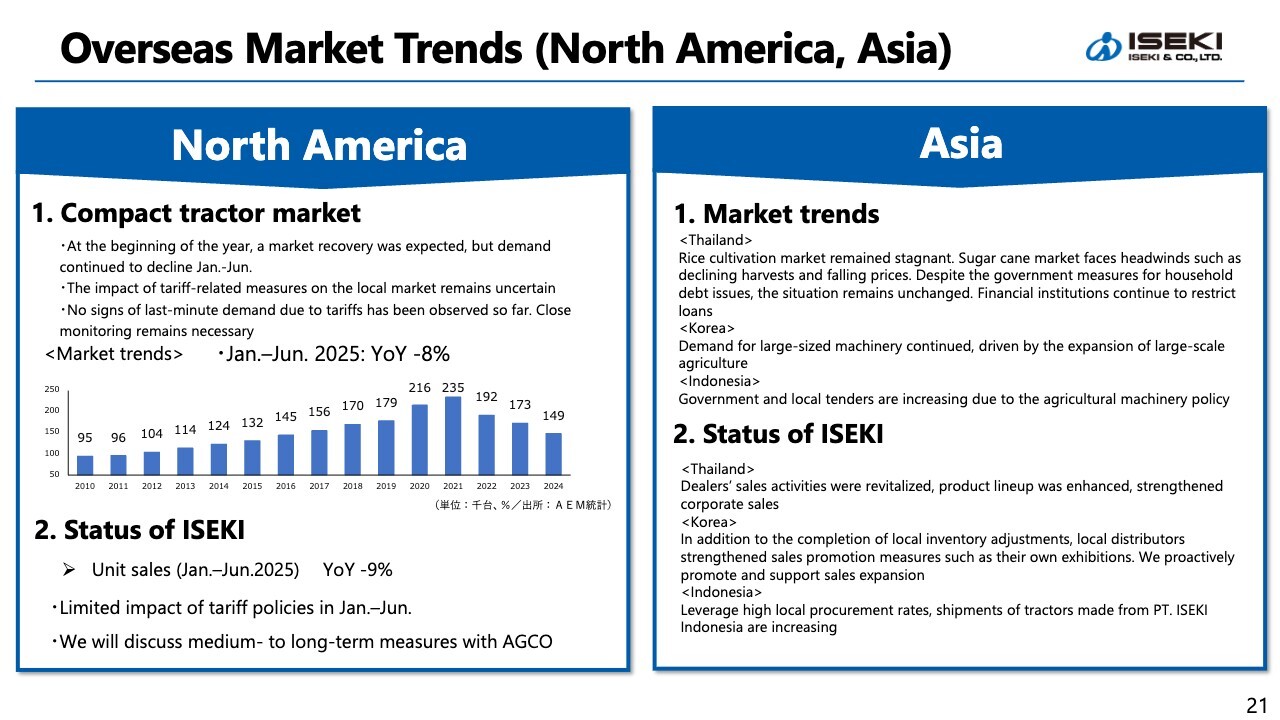
Next are trends in North America and Asia. In North America, within the compact tractor market where we primarily supply tractors below 40 horsepower, sales volume decreased by 8% YoY, with our unit sales down 9%, in line with the overall market decline during the January to June period.
We continue to collaborate with AGCO, our OEM customer, to strengthen the execution of various measures, including new product launches, while also beginning to explore strategies from a medium- to long-term perspective.
In Asia, the Thai market continues to face challenging conditions. However, our local distribution subsidiary, IST Farm Machinery Co., Ltd., is conducting a sales campaign for ISEKI’s NT tractors. We are also introducing new products, strengthening our lineup, and implementing measures to expand corporate sales.
In the Korean market, we are exporting primarily large-sized, high-value-added products—so-called Japan-class products—similar to those sold domestically. With local inventory adjustments now complete, local sales agents are intensifying sales promotion activities, such as hosting their own exhibitions. We are also actively supporting sales expansion, and the results of these efforts are beginning to emerge.
In the Indonesian market, government and local tenders are increasing due to agricultural machinery policies. Furthermore, with the change in presidency, policies are being reviewed, leading to renewed initiatives aimed at improving food security and self-sufficiency. Against the backdrop of population growth, we continue to strengthen our efforts to secure orders and expand sales.
Forecast of Consolidated Financial Results for the Fiscal Year Ending December 31, 2025
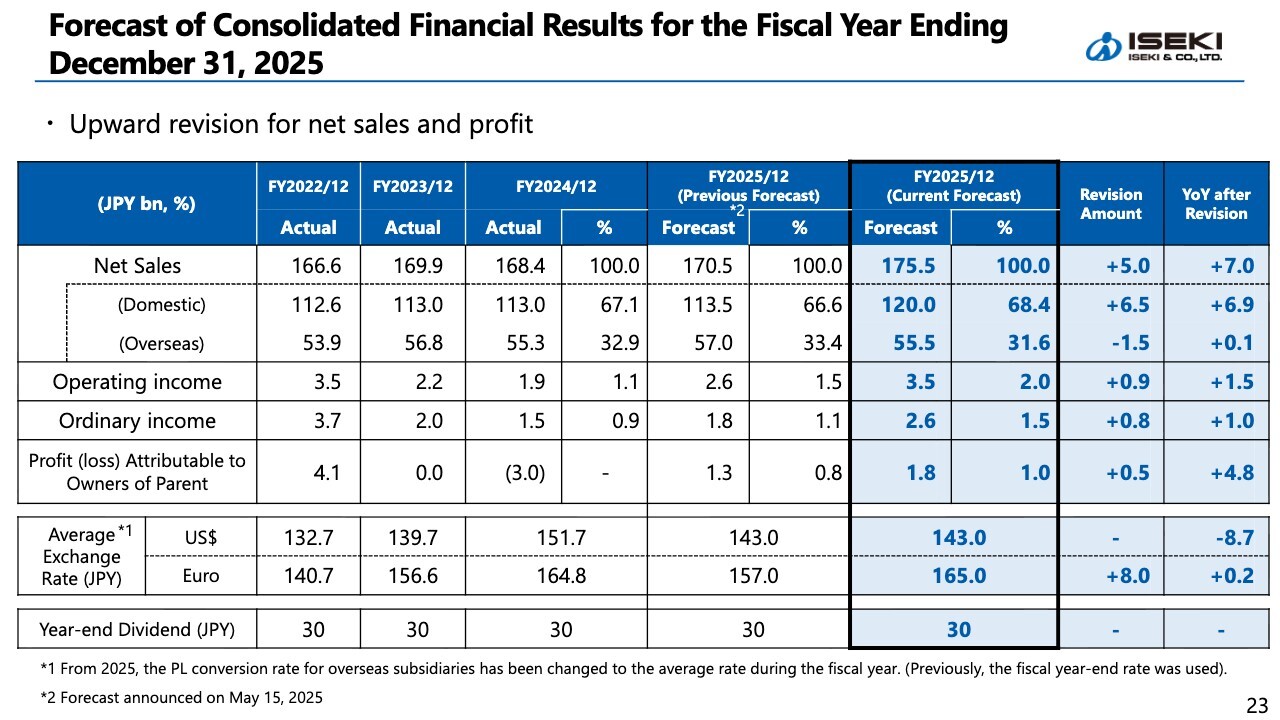
This slide shows our forecast of consolidated financial results. Against the backdrop of a stronger customers’ appetite to purchase, driven by rising domestic rice prices, net sales for 2Q increased significantly. Consequently, both net sales and profits are now expected to exceed the initial forecasts, leading to this upward revision. The details are shown on the slide.
Outline of Project Z Plan
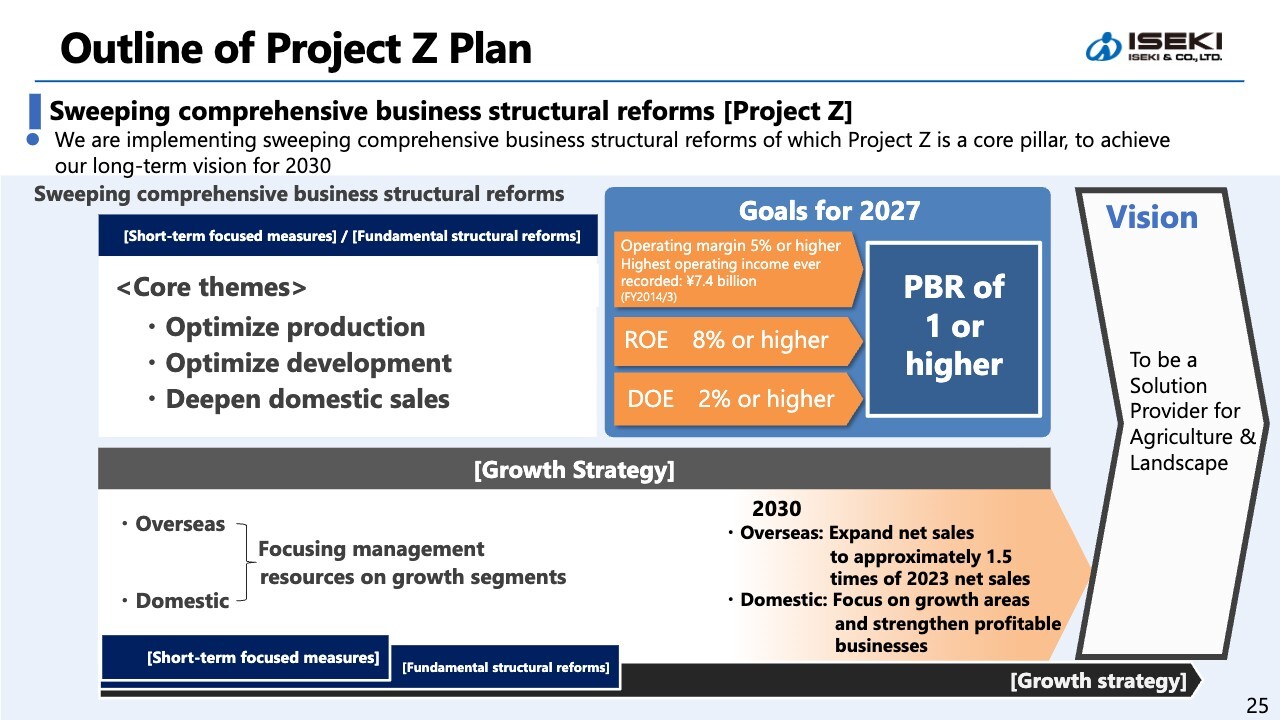
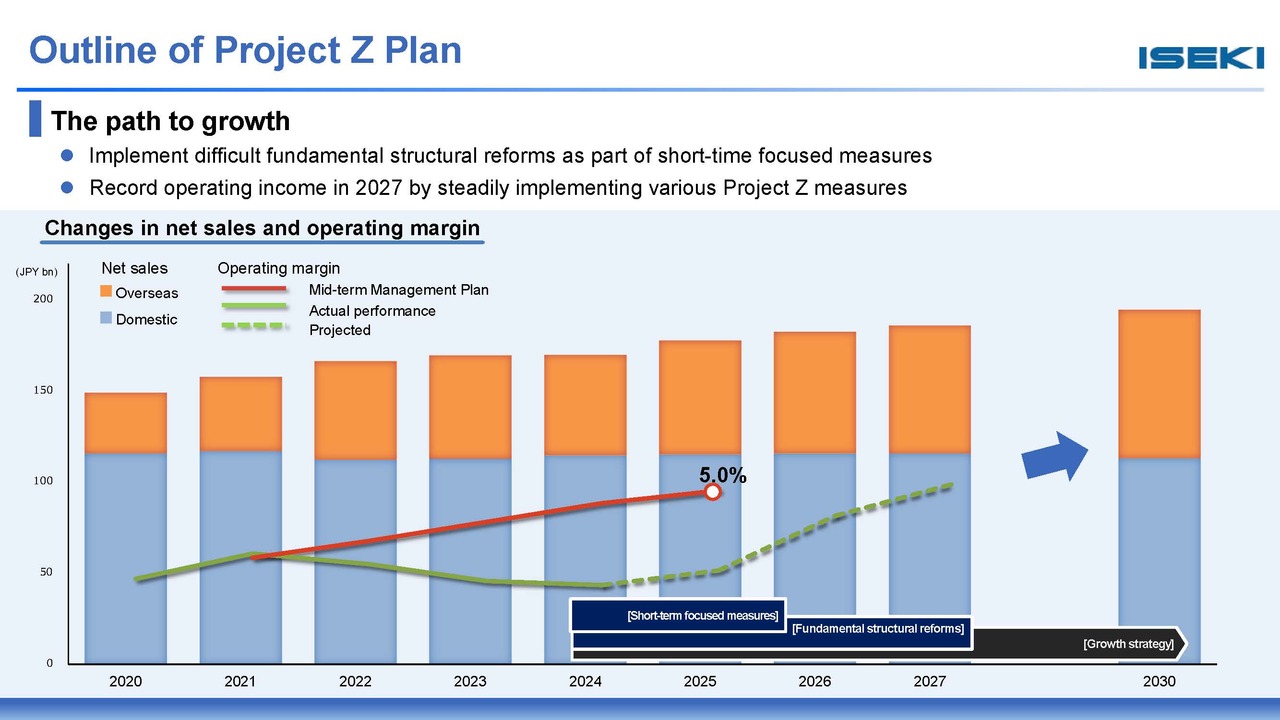
Next, I will discuss the progress of Project Z. First, I will briefly outline the overview of Project Z. We are simultaneously advancing a growth strategy while focusing on fundamental structural reform. Within this reform, we are undertaking initiatives: “Optimize production,” which involves rethinking production from the ground up, centered on manufacturing factory reorganization; “Optimize development,” which involves rethinking design from the ground up; and “Deepen domestic sales,” which involves rethinking sales approaches and service delivery methods from the ground up.
We plan to implement these measures intensively over a short period from 2024 to 2025 to ensure solid results. Through this reform and growth strategy, we aim to achieve a consolidated operating margin of 5% or higher and ROE of 8% or higher by 2027. Furthermore, we plan to raise DOE to 2% or higher and achieve a PBR of 1 or higher.
Progress of Project Z
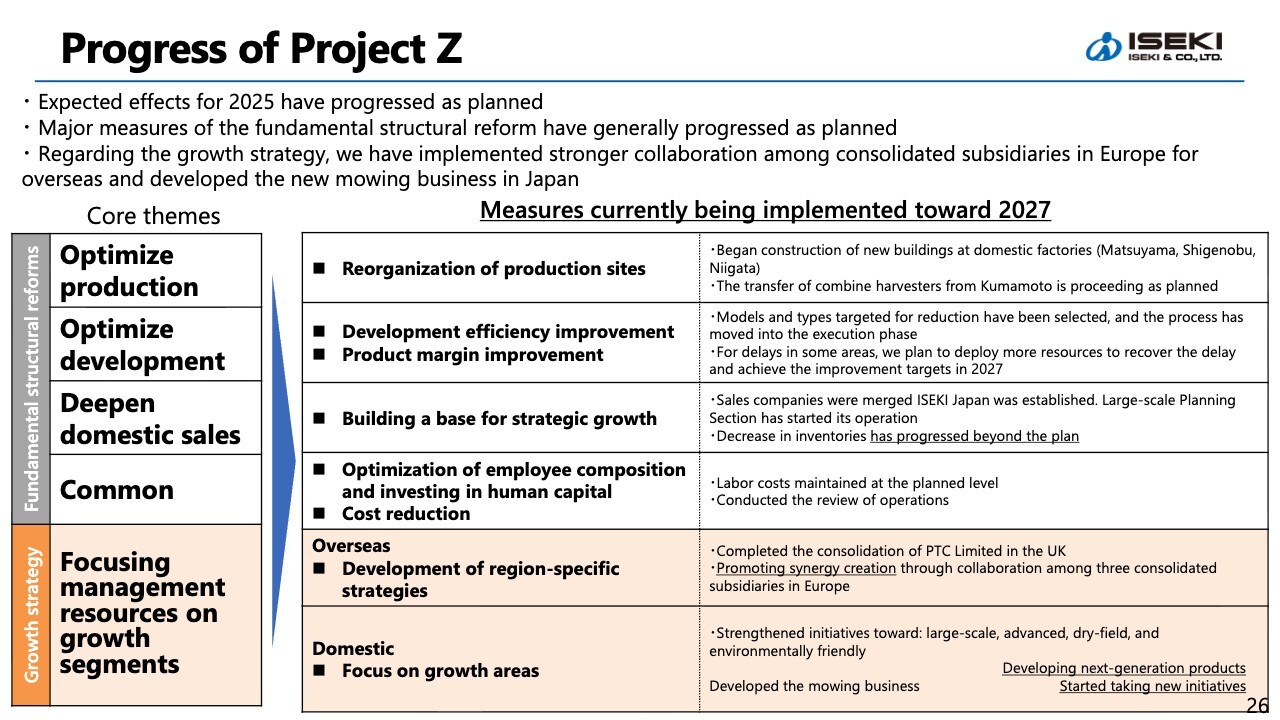
This slide shows the progress. Major measures, such as the reorganization of production sites and the merger of distributors, are generally progressing as planned. As mentioned earlier, we are also achieving results that exceed the plan in asset efficiency, including a decrease in inventories.
On the other hand, product margin improvements through “Optimize development” and design method revisions, as well as cost reductions, are lagging behind. However, figures for 2025 are expected to progress as planned. For 2027, progress still shows gaps, so we are firmly allocating resources to the necessary areas and making course corrections.
Regarding the growth strategy, we are beginning to further strengthen collaboration among consolidated subsidiaries in Europe to create synergies overseas. While we have yet to fully penetrate certain peripheral regions in Europe, we are building the capabilities to address these markets. Domestically, we are steadily advancing initiatives in growth areas and have also launched a new mowing business.
Domestic Growth Strategy “Development of Mowing Business”
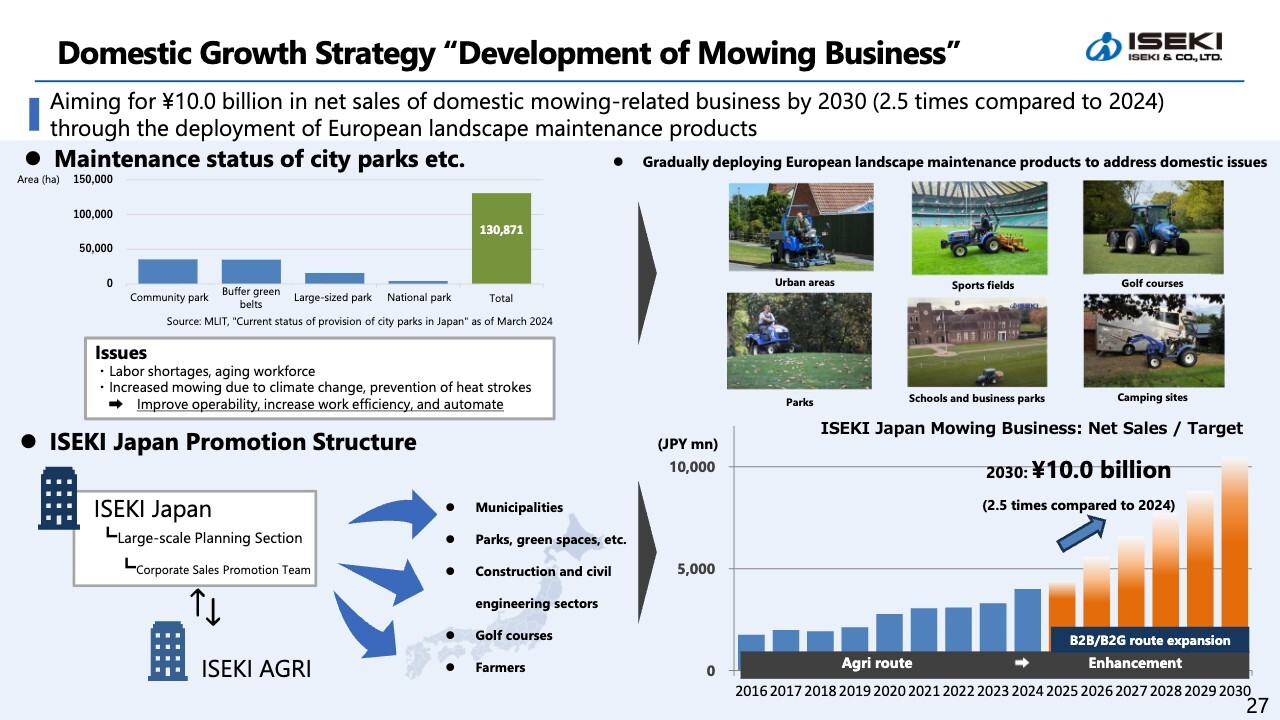
I will explain the development of our mowing business here. As part of our domestic growth strategy, we will strengthen the development of our mowing business. We have traditionally offered mowing products in the domestic agricultural sector. Going forward, we will fully enter the domestic landscape maintenance market, focusing on our well-regarded ride-on mowers in Europe. We aim to increase domestic mowing-related net sales to ¥10.0 billion by 2030, a 2.5 times increase compared to 2024.
The graph in the upper left shows the maintenance status of city parks. This is the market we are developing in Europe. In the domestic landscaping maintenance sector, such as parks, there are issues similar to those in the agricultural sector, which in turn present business opportunities.
We are positioning the mowing market as a new growth area. By introducing machinery successfully marketed in Europe, we will address issues such as an aging workforce and increased operational burdens from climate change.
Furthermore, we are establishing dedicated support structures for diverse customer segments, including municipalities, parks, and the construction sector. At the same time, we are expanding our sales channels to achieve net sales of ¥10.0 billion by 2030.
Topics: ISEKI’s Technology
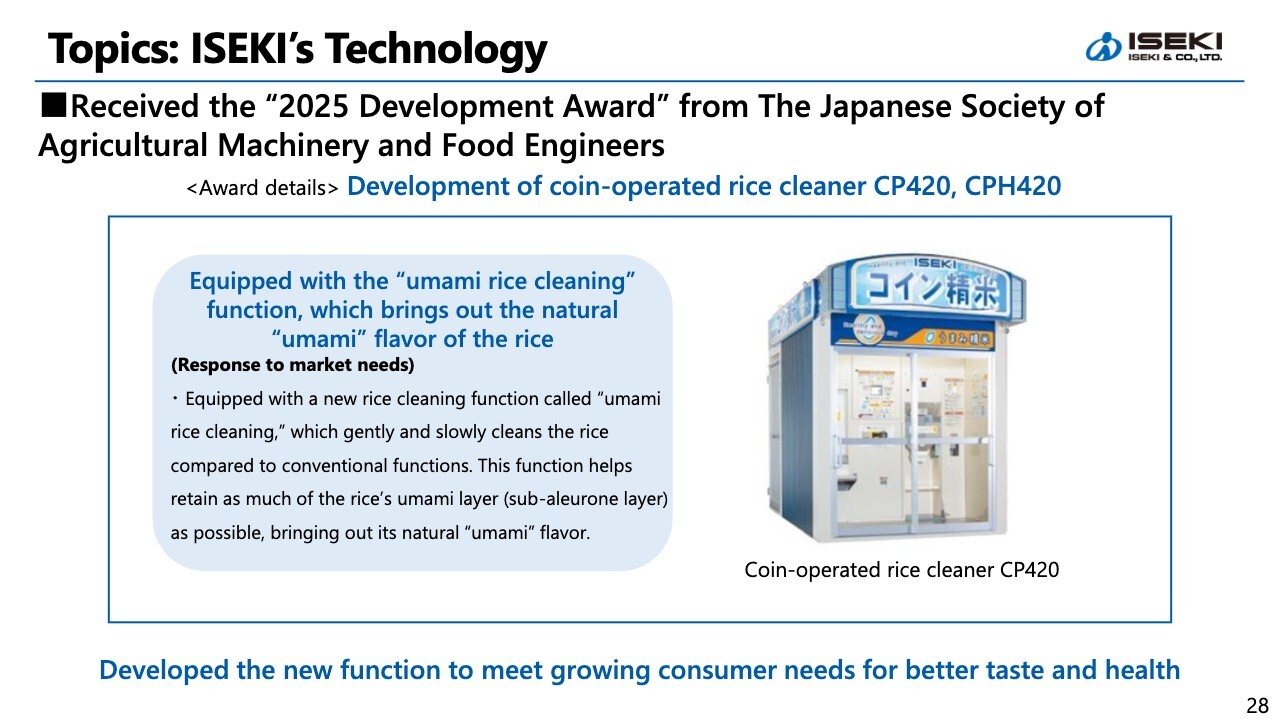
Let me introduce two topics. The first is our coin-operated rice cleaners. A newly redesigned model, launched as a new product, received the “2025 Development Award” from the Japanese Society of Agricultural Machinery and Food Engineers. Responding to growing consumer demand for taste and health benefits in recent years, it features an “umami rice cleaning” function that enhances the inherent “umami” flavor of rice.
Sales from rice cleaning services provided by our distribution subsidiaries—using rice cleaners developed and produced by ISEKI & Co., Ltd. and installed at various locations of the subsidiaries—increased by 10% YoY. This growth occurred amid the rice shortage that began in the latter half of last year, driven by demand for cleaning so-called gift rice, or rice directly received from relatives or farmer friends.
We will continue to promote the provision of products and services that reflect consumer needs.
Topics: Issuance of “ISEKI Report 2025”
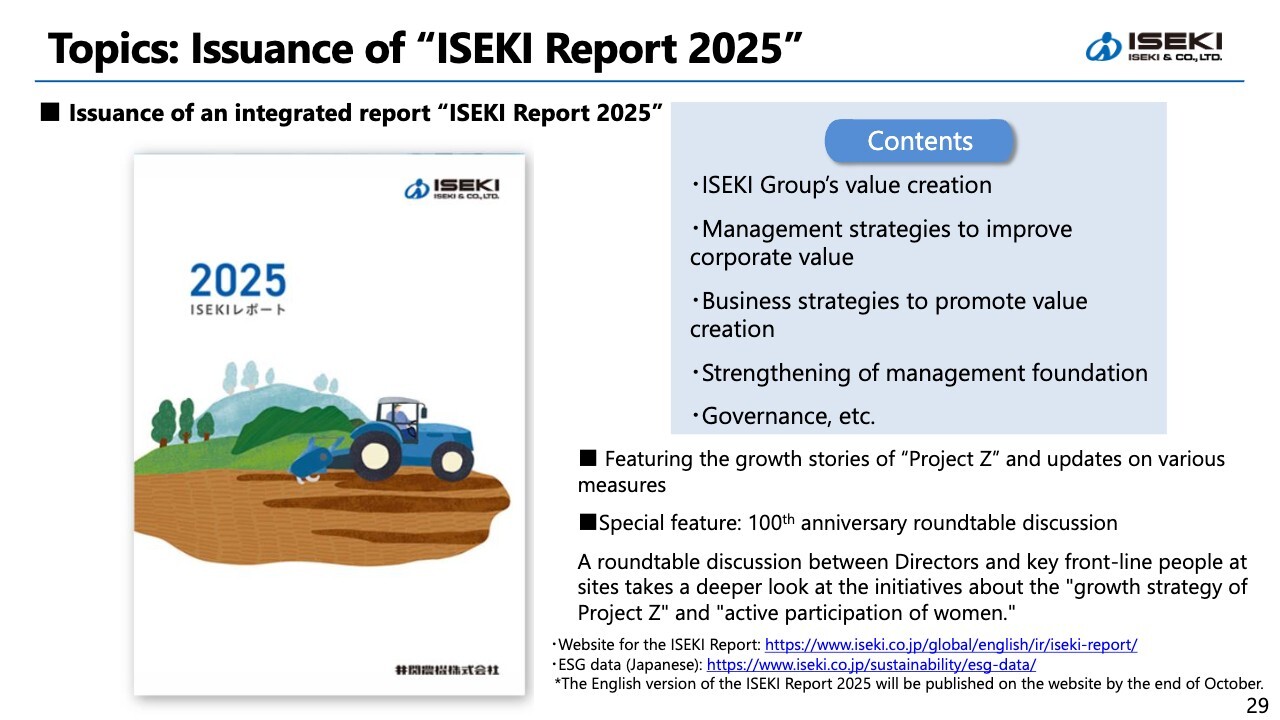
The second topic is the issuance of our integrated report, ISEKI Report 2025. This report features the growth stories of Project Z and various measures, including my message, an explanation from Odagiri, the leader of Project Z, and further details from each general division manager.
This year marks our 100th anniversary. As a commemorative highlight, we take a deeper look at the initiatives about the growth strategy of Project Z and the active participation of women through a roundtable discussion between Directors and key front-line people at sites.
The ISEKI Report is positioned as one of our key communication tools with stakeholders. We would greatly appreciate it if you could take the time to read it and share your thoughts and opinions through the questionnaire.
This concludes my presentation. Thank you for your attention.
Q&A: “Optimize production” and Capital Investment Planning
Questioner: You mentioned that the Company will focus its capital investment on the Matsuyama Factory going forward. With the transfer of combine harvesters’ production from the Kumamoto Factory to the Matsuyama Factory, production volumes are expected to increase. I believe that leveraging technologies such as robots, Automated Guided Vehicles (AGVs), IoT-related artificial intelligence (AI), and generative AI will be key to realizing the benefits of this investment. Regarding capital investment to further increase production volume, please outline the enhancement measures planned for FY12/2025 and FY12/2026.
Tomiyasu: Regarding “Optimize production,” we anticipate capital investment of ¥38.0 billion. This investment will be spread across 2029 and 2030, so the annual burden will not be particularly large. Within these investments, significant effects are expected to materialize from 2027 through 2029 and beyond.
The total amount comes to ¥38.0 billion, so if you consider it as an average over roughly five years, you can get a sense of the scale. Within that framework, we will proceed with establishing new production lines, keeping in mind the goal of improving production efficiency. Therefore, while we have not been completely inactive in this area, we are also considering the introduction of AGVs and other technologies.
Robots have already been introduced in welding workplaces and engine lines. However, on assembly lines, given the small-batch, high-variety nature of agricultural machinery production, we consider it difficult from an investment efficiency perspective. In short, our policy is to proceed with appropriate deployment while monitoring conditions on site.
Tsutomu Watanabe (hereinafter, Watanabe): I am Tsutomu Watanabe, responsible for development and production. We will utilize the AGVs mentioned earlier to explore labor-saving potential through automation. While the investment amounts to ¥38.0 billion, it will not be used solely for rebuilding the Matsuyama Factory; we plan to proceed while making use of existing equipment and buildings. The use of AGVs is also included in the plan to reduce transportation burdens.
Furthermore, in terms of productivity improvements through IoT technology and other methods, we are currently implementing efficiency measures within our welding lines, press flexible manufacturing system (FMS) lines, and “Optimize production” investments. Each of these is managed as a system within its respective line.
We plan to consider capital investments aimed at centralized management, efficiency improvements, and enhanced safety. In the inspection process, by applying image recognition rather than relying on human judgment or memory, we can immediately detect issues such as misapplied labels or incorrect assembly. We are also considering the use of AI-based inspection for pass/fail determination.
Q&A: Annual Investment Scale in Matsuyama
Questioner: Is the annual investment for the Matsuyama Factory around ¥1.0 billion, for example?
Tomiyasu: The ¥38.0 billion investment will be spread over five years, resulting in approximately ¥7.0 billion per year. Regarding the breakdown, while a portion will be allocated to the Niigata Factory, roughly 80% will be invested in the Matsuyama Factory. Therefore, on an annual basis, you can assume an investment of approximately ¥6.0 billion.
However, there may be some year-to-year variation. Please note that the plan includes major peaks in 2026 and 2028, during which investment will exceed typical levels, bringing the annual scale to approximately ¥10.0 billion.
Q&A: Response to the Electric Mowing Subsidy Program and Certification Application Plan
Questioner: Among mowers, the current flagship ride-on mowers have achieved significant sales in Europe. Therefore, I would like to address “electric” as another important keyword in the development of the mowing business. In construction machinery, electric equipment is currently certified by the Ministry of the Environment (MOE) and the Ministry of Land, Infrastructure, Transport and Tourism (MLIT), with subsidies provided. This preferential program subsidizes the price difference for electric construction machinery, which is more expensive than diesel-powered models. Starting this fiscal year, the program has been extended beyond construction machinery to include agricultural machinery, launched as a joint initiative between the MOE and the Ministry of Agriculture, Forestry and Fisheries (MAFF). Recently, the certification organization approved around ten models, with agricultural machinery from YAMABIKO CORPORATION, Honda Motor Co., Ltd., Yamaha Motor Co., Ltd., and others reportedly making up the majority. Additionally, I have heard from the certification organization that one model of your Chinese-made agricultural machinery has also been certified. Therefore, I would like to ask about the benefits of obtaining certification for electric agricultural machinery going forward. From the user’s perspective, I believe it is appealing that, in addition to promoting environmental initiatives, the disadvantage of higher prices compared with conventional models can be offset by subsidies. Furthermore, for user companies and sales companies—that is, your company—many benefits are expected in demonstrating proactive environmental efforts. Beyond the current single Chinese-made model, do you plan to apply for certification from the organization for subsidies by the MOE and MAFF for other models—for example, products intended for the European market or a future electric mower under development?
Tomiyasu: If applicable products exist, we will naturally apply. As you know, we already offer electric products for the European market. Should subsidies or similar support become available for these, we believe it could further strengthen our domestic development efforts. While it is difficult to provide a definitive answer at this stage, we intend to move forward with new development as our next approach.
Q&A: Mowing Business in Europe and Competitive Environment
Presenter: What are the strengths and competitive environment in the mowing business?
Tomiyasu: In Europe, we are developing our business primarily in landscape maintenance, focusing on ride-on mowers and compact tractors (used for towing road-cleaning equipment and snowplows). Our strength lies in more than 50 years of history and the established presence of the ISEKI brand built over that time. Furthermore, our machines offer superior performance.
Kazuya Tani (hereinafter, Tani): I am Kazuya Tani, responsible for corporate planning and finance. Since I served as General Division Manager of the Overseas Business Division until this March, let me add to the answer. While we refer to it as mowing, there are various applications, such as golf courses and parks. Currently, our greatest strength lies in machinery used in public lands and parks, by local municipalities in Europe, and by professional contractors working with those municipalities. This is our greatest strength.
Competitors include Kubota Corporation and Deere & Company in Europe, as well as other European manufacturers. Among these, we are highly regarded and hold the leading market share. Our strength lies in the machines’ exceptional cutting performance across a wide range of grass conditions.
Tomiyasu: Beyond simply mowing, their grass-collection capabilities are also a key strength. There is demand for mowing within the domestic agricultural sector. We believe we can firmly establish ourselves in the domestic market going forward by differentiating ourselves from existing machines while meeting this demand.
Q&A: Demand Trends after Price Revisions and the Impact of Rising Rice Prices
Presenter: How has demand for agricultural machinery changed after the price revision?
Tomiyasu: The prices were revised upward in July, but there has not been a significant change in the figures yet. However, the revision has not led to a major drop in demand; rather, demand appears to be holding steady. We believe that the recovery in rice prices is a major factor behind this trend.
Noriaki Ishimoto (hereinafter, Ishimoto): I am Noriaki Ishimoto, responsible for domestic business. We revised prices this July, but we have implemented price revisions annually since 2022 in response to rising costs, making this the fourth such adjustment.
Previous price revisions saw roughly three peaks and troughs in sales. However, this time, a stronger purchasing appetite among farmers due to rising rice prices, combined with demand-boosting measures implemented before the revision, created a significant multiplier effect, resulting in a major peak during 1H.
Although there has been a slight decrease, we maintained a substantial backlog of contracts during 1H, which we plan to reflect in sales going forward into next year.
Another key point is that this year’s rice harvest volume is crucial. Despite challenges such as extreme heat and drought, a reasonable harvest has been achieved. We are also planning various promotional events starting in October. With the impact of rising rice prices, we believe the situation has the potential to shift in a positive direction.
Tomiyasu: As mentioned earlier, as of the end of June, we had a significant backlog of contracts that had not yet been delivered—what we refer to as outstanding contracts. These will not only translate into sales in 2H, but we are also seeing demand in line with current rice price trends, despite anticipating a certain degree of reactionary decline starting in July.
Q&A: Business Performance Outlook for the Next Fiscal Year and Positive/Negative Factors
Questioner: In today’s presentation, you mentioned both positive and negative factors: while there are concerns about a decline due to the absence of last-minute demand, the effects of Project Z are expected to materialize next year. Could you share what kind of outlook you envision for the next fiscal year?
The chart for Project Z indicated the direction, but considering the current business environment, I would appreciate it if you could explain the positive and negative factors separately.
Specifically, while there may be negative impacts from the reactionary decline, I believe the positive effects of Project Z could offset this to some extent. Additionally, I think there are factors such as the potential continuation of price increase effects into the next fiscal year and the launch of new products. I would appreciate it if you could explain the positive and negative effects separately.
Tomiyasu: As you pointed out, we believe there are both positive and negative factors. Regarding the consolidated financial results forecast for FY12/2025, we have revised it upward, as we anticipate performance exceeding the initial Project Z plan trajectory.
One contributing factor is the price of rice, along with elements such as last-minute demand before price revisions. Consequently, the anticipated reactionary decline is considered a negative factor.
On the other hand, regarding positive effects, while there are limits to how much I can comment on rice prices, given my position, I do not believe they will fall easily. I anticipate they will remain at a level that allows rice farmers to maintain sufficient motivation for production.
Therefore, I believe the recovery in farmer sentiment and the increase in purchasing activity—which have been particularly constrained over the past four to five years by soaring material costs—will continue to some extent, not only this year but also into next year and beyond.
Furthermore, we can expect results from Project Z. This initiative is based on the fundamental structural reforms and growth strategy I mentioned earlier. For “Optimize production,” we plan to reorganize our manufacturing facilities, ultimately consolidating them at the Matsuyama Factory by 2030. Consequently, the effects will take time to materialize, and we anticipate significant depreciation burdens from investments in the near term. The challenge lies in how to accelerate the realization of these benefits.
Next is “Optimize development,” which involves rethinking the design process from the ground up. This initiative fundamentally revisits the design itself, conducting detailed reviews starting at the component level, while also reexamining the design methodology. Therefore, implementing this at the time of model changeovers can yield significant benefits.
However, since it takes time for the effects to materialize, we believe they will become significantly apparent around 2026 to 2027.
Finally, regarding “Deepen domestic sales,” this fiscal year marks the launch of ISEKI Japan, and as mentioned earlier, initial costs will be high, including merger-related expenses.
Earlier, I mentioned that one-time expenses in 2025 amount to approximately ¥0.8 billion. However, these expenses will no longer occur in 2026. Taking this into account, the effects of Project Z and the elimination of these negative factors will serve as positive drivers in the next fiscal year.
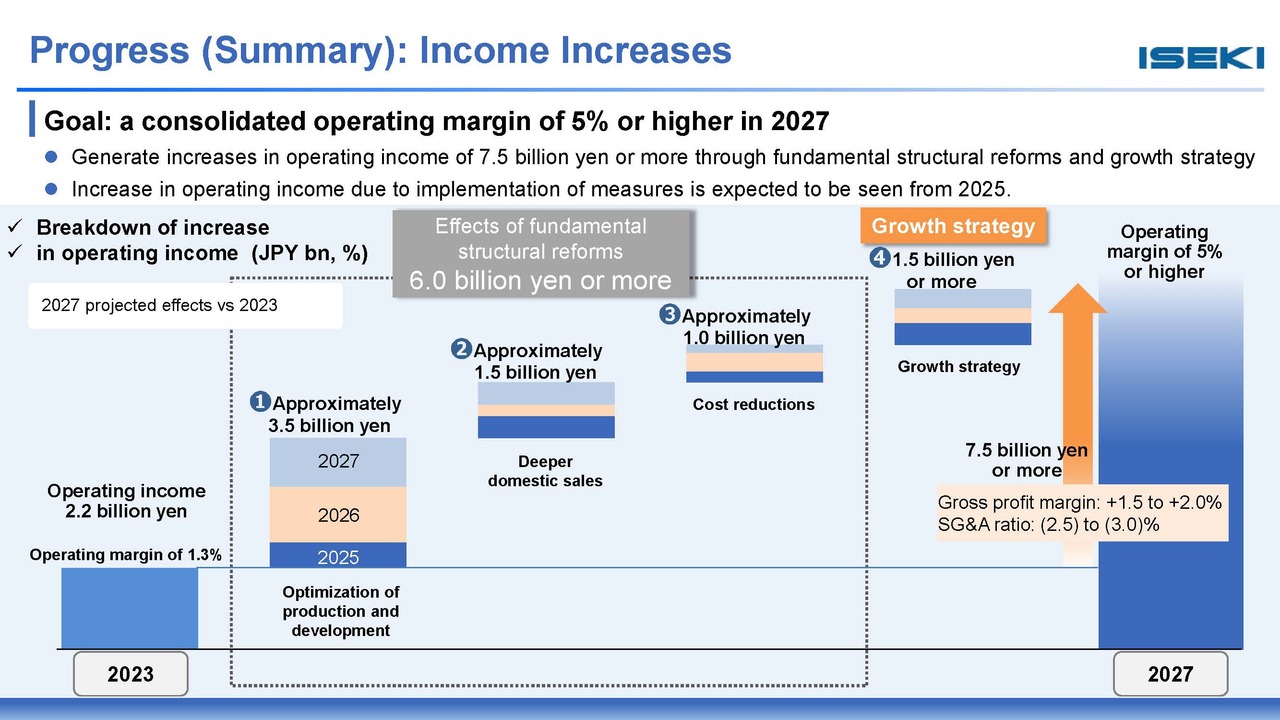
This slide shows the trajectory of our plan. From the start of Project Z, we will grow net sales and operating income as shown in the graph. The slide illustrates the operating margin, and we currently believe we can maintain this pace through 2027.
In a certain sense, the recovery in rice prices has been a very favorable factor for us. However, we believe our greatest mission is to capture this opportunity while the effect persists and to complete Project Z. We will continue to steadily advance our fundamental structural reforms and growth strategy.
We aim to achieve a cumulative operating income increase of ¥7.5 billion or more by 2027. Within this goal, specifically regarding the growth strategy, the figure of ¥1.5 billion or more in operating income increase at the start of Project Z was a cautiously drawn target.
It is difficult to present specific figures at this point for certain areas. However, we are actively working to ensure that we achieve the target of ¥7.5 billion or more, even if setbacks occur in some areas, by steadily building on these efforts. We would appreciate your understanding of this.
Questioner: By measuring the volume of operating income and stacking it against the upward revisions made in the current period, it may be possible to form an outlook for operating income in the next period. For example, what kind of outlook do you have in mind?
Tomiyasu: We expect to build up the figures through 2026 and 2027, resulting in an operating income increase of ¥7.5 billion or more compared with 2023. However, I will refrain from providing specific figures at this stage and ask for your understanding.
Q&A: Shareholder Returns and Dividend Policy through 2027
Questioner: In terms of shareholder returns, the target is to achieve a DOE of 2% or higher in 2027. However, based on this upward revision, I understand that the dividend per share is ¥30, the DOE is just under 1%, and the payout ratio is 38%.
From what you just said, I get the impression that profit growth will continue. I am curious how dividends will change accordingly. If the target is a DOE of 2% or higher in 2027, I imagine you might be aiming for a DOE of around 1.5% next year. Could you share your thoughts on this?
Tomiyasu: The target of 2% DOE is what we aim to achieve on the financial results for FY12/2027. Naturally, we believe a step-by-step approach is the general way forward. Therefore, as we formulate our performance plans for 2H FY12/2025 and for FY12/2026, we will clearly define the specific outlook.
Q&A: Growth Strategy in Europe and 2030 Sales Plan
Questioner: Net sales in Europe were ¥38.5 billion in FY12/2024. Does this mean they will reach ¥40 billion by FY12/2030? I get the impression that growth, including the FY12/2027 figures, is not very strong. Also, there were several items on the slide, but specifically regarding the second point under “Future expansion, etc.” on the right side—Expansion of product lineup—please explain in what form, with what products, and to what volume this expansion will occur.
Furthermore, regarding the third point, Expansion to untapped markets, considering the possibility that the war in Ukraine may come to an end, I believe the European market holds significant potential. However, the figures currently presented seem somewhat underwhelming, and I believe there is room for further expansion. Could you elaborate on the scale in relation to the strategy for this area?
Tomiyasu: “Expansion of product lineup” and “Expansion to untapped markets,” as shown on the slides, are precisely the areas that drive top-line growth. Kizuma, General Division Manager of the Overseas Sales Division, will respond.
Yoshiaki Kimata (hereinafter, Kimata): I am Kimata, responsible for the overseas business. While aiming for European net sales exceeding ¥40.0 billion, we have already reached ¥37.0 billion, up from ¥36.0 billion last year, so I agree that the growth margin is small, as you pointed out.
Last year’s results were significantly better than the initial projections for Project Z, which may make the growth rate appear smaller. However, if we take 2023 as the starting point, the figures reflect a reasonable growth expectation, and I believe this conveys the overall picture.
From the perspective of product strategy and regional strategy, we do not currently have any particularly spectacular or large-scale growth measures in place. While we will certainly continue to promote the introduction of electrified products, as mentioned briefly earlier, we do not yet foresee the market expanding significantly in the short term. Factors such as high prices make it difficult to offer products that could drive a major increase in sales.
However, regarding electrified products, we utilize not only our own offerings but also purchased products, and in France, we already have products that are selling very well. We are working to further increase the number of such products.
In Europe, our largest market, we maintain strong operations with bases in France and Germany. Going forward, we will focus on regions such as Eastern Europe and Africa. In Africa in particular, we are exploring opportunities to sell products such as ride-on mowers for resort areas rather than for agricultural use. We believe this will be a process of steady, incremental progress.
We are also open to exploring non-organic M&A opportunities if compelling proposals arise. While we currently have no specific plans, we intend to continue focusing on steady accumulation while also seeking to incorporate non-organic elements where possible.
Q&A: Outlook for Tariff Responses in the U.S. Market
Questioner: Earlier, when discussing the United States, you mentioned that “we have begun considering strategies from a medium- to long-term perspective.” Does this refer to the local procurement and assembly initiatives mentioned in your explanation regarding tariffs?
Tomiyasu: It is true that, even before the tariff issue arose, we had been considering the necessity of establishing local production bases.
Under the Trump administration, the situation is changing. Specifically, we have been discussing how much battery capacity to install and how to procure those batteries, with an eye toward future electrification. We recognize that we must carefully reexamine these issues.
In the North American market, our main strength lies in supplying small compact tractors for individual users on an OEM basis.
At the same time, we intend to explore opportunities related to grass, as mentioned earlier, along with other new directions. Please understand that we are still at the stage of initiating various studies, focusing primarily on how to bring these themes to realization.
Q&A: Replacement Cycle of Agricultural Machinery and Increasing Demand
Presenter: Demand for agricultural machinery is being stimulated by the surge in rice prices. Taking the replacement cycle into account, what is your outlook for demand?
Tomiyasu: For example, since the COVID-19 pandemic, domestic sales have remained quite challenging. Until around 2019, our domestic agricultural machinery net sales exceeded ¥50.0 billion. Considering the replacement cycle for customers who purchased equipment prior to that, six to seven years have now passed, indicating that we are entering a period of replacement demand.
Ishimoto: The replacement cycle for agricultural machinery varies depending on the model, scale, and usage conditions. Two or three years ago, when agricultural material costs were soaring and rice prices were depressed, many replacements were deferred even for machinery that had reached its cycle. Now, however, replacements are finally starting to occur.
The future trajectory of rice prices remains uncertain in some respects. As mentioned briefly earlier, agricultural administration is shifting significantly, with policies now steering production to better match rice demand.
However, realistically, the aging of agricultural workers is expected to continue driving farm abandonment, though the pace of this trend appears to have slowed somewhat. On the other hand, the shift toward large-sized machinery is a natural consequence. As a result, while sales volume may decline, sales value is expected to increase accordingly—this, we believe, is the trend in the domestic market.
Demand appears to be moving at a slightly faster pace at this time. If this situation persists and rice prices remain relatively stable without declining, we believe the replacement cycle could shorten.
Tomiyasu: The lifespan of agricultural machinery varies considerably by model. To elaborate, during the period when rice prices fell due to the pandemic, the replacement of machinery that should have been renewed was delayed, effectively extending its lifespan. Therefore, it could be argued that this situation may contribute to a potential increase in demand starting next year.
Message from Mr. Tomiyasu
Tomiyasu: I believe we achieved reasonable results during this interim period. In one sense, it was a very favorable environment for us as we advanced Project Z.
That said, it is crucial that we proceed with Project Z while carefully assessing our current situation.
Having successfully navigated the first year of Project Z, I believe we can build reserves in the second year if we maintain this momentum. Leveraging these reserves to steadily advance Project Z is what matters most for ISEKI at this stage.
By thoroughly implementing fundamental structural reforms and growth strategies, we aim to meet your expectations. Thank you very much for your attention today.